

ABSTRACT
Cyclin-dependent kinase 1 (CDK1) orchestrates the transition from the G2 phase into mitosis and as cancer cells often display enhanced CDK1 activity, it has been proposed as a tumor specific anti-cancer target. Here we show that the effects of CDK1 inhibition are not restricted to tumor cells but can also reduce viability in non-cancer cells and sensitize them to radiation in a cell cycle dependent manner.
Radiosensitization by the specific CDK1 inhibitor, RO-3306, was determined by colony formation assays in three tumor lines (HeLa, T24, SQ20B) and three non-cancer lines (HFL1, MRC-5, RPE). Initial results showed that CDK1 inhibition radiosensitized tumor cells, but did not sensitize normal fibroblasts and epithelial cells in colony formation assays despite effective inhibition of CDK1 signaling. Further investigation showed that normal cells were less sensitive to CDK1 inhibition because they remained predominantly in G1 for a prolonged period when plated in colony formation assays. In contrast, inhibiting CDK1 a day after plating, when the cells were going through G2/M phase, reduced their clonogenic survival both with and without radiation. Our finding that inhibition of CDK1 can damage normal cells in a cell cycle dependent manner indicates that targeting CDK1 in cancer patients may lead to toxicity in normal proliferating cells. Furthermore, our finding that cell cycle progression becomes easily stalled in non-cancer cells under normal culture conditions has general implications for testing anti-cancer agents in these cells.
KEYWORDS: CDK1 (cyclin-dependent kinase) inhibitor, RO-3306, radiosensitivity, epithelial cells, fibroblasts, radiation, radiotherapy, cell cycle arrest
Introduction
Cyclin-dependent kinase 1 (CDK1), also known as cell division control protein 2 (cdc2) is required for the transition from the G2 phase into mitosis [reviewed in ref [1]. The activity of CDK1 is tightly regulated by both cyclin levels and checkpoint kinases such as WEE1 and Chk1, ensuring the cell does not enter mitosis with incompletely replicated or damaged DNA [2]. CDK1 remains largely inactive until late G2, when the levels of cyclin B are sufficiently high to allow stable CDK1-cyclin B complex formation. This complex does not become activated until the removal of the CDK1 inhibitory phosphorylation sites Thr 14 and Tyr 15 by cdc25c phosphatases upon mitotic entry. This allows CDK1 to phosphorylate over 100 proteins, which then promote nuclear envelope breakdown, chromatin condensation and spindle assembly. Once the spindle assembly checkpoint is satisfied, the cell progresses from metaphase to anaphase, which requires the attenuation of CDK1 activity. This is mediated by the degradation of cyclin B1, promoted by the anaphase-promoting complex [3].
Overexpression of CDK1 and cyclin B in a number of tumor subtypes including breast, colorectal and lung tumors is correlated with adverse prognosis [reviewed in ref [4]. CDK1 inhibition has therefore been proposed to be an attractive anti-tumor strategy. Indeed, incubation with the specific CDK1 inhibitor RO-3306 was shown to be more pro-apoptotic in tumor than in normal cells [5]. Additional pre-clinical evidence suggests that CDK1 inhibition can also be used in combination therapy. It was shown that targeting CDK1 can specifically sensitize tumor cells to DNA-damaging agents without affecting the sensitivity of normal epithelial cells [6]. CDK1 inhibition can also act synergistically with PARP inhibitors in a tumor specific manner, and this combination was shown to prolong survival in a spontaneous mouse tumor model without apparent normal tissue toxicity [7]. Furthermore, it was recently shown that tumors carrying KRAS mutations could be particularly sensitive to CDK1 inhibition. Mutant KRAS colorectal cancer and pancreatic cell lines were significantly more sensitive to CDK1 inhibition than wild type KRAS tumor cell lines in long-term viability and colony formation assays [8].
We recently screened a kinome siRNA library for novel radiosensitization targets using colony formation in HeLa cells after irradiation as an end point [9]. CDK1 was one of the potential radiosensitization targets identified in this screen. Although siRNA depletion of CDK1 has previously been shown to cause radiosensitization, the effect of pharmacological inhibition of CDK1 on radiosensitivity was only tested with compounds that target multiple CDKs [10]. In this paper, we investigated whether targeting CDK1 using the specific inhibitor RO-3306 [5] would radiosensitize tumor cells and whether the effect was indeed tumor specific.
Results
To validate CDK1 as a tumor specific radiosensitization target identified in our siRNA kinome library screen [9], we tested the effect of the specific CDK1 inhibitor RO-3306 in three tumor lines and three normal lines that are commonly used for radiosensitivity studies [11,12]. The tumor lines were HeLa (used in the siRNA screen), the bladder transitional cell carcinoma line T24, and the head and neck squamous cell carcinoma SQ20B. Normal cell lines were HFL1 and MRC-5 fibroblasts, and RPE retinal epithelial cells. We found that pre-treatment with 5 µM RO-3306 for 20 hours sensitized all three tumor cell lines to irradiation (Figure 1(a)). In addition, RO-3306 treatment had a stand-alone effect, also reducing colony formation in all three tumor cell lines in the absence of radiation (Figure 1(a)). Shorter incubation times or lower concentrations of RO-3306 were less effective, whereas higher concentrations caused increased single agent toxicity (Supplementary Figure 1). In contrast, when these conditions were tested in the three normal cell lines, we found that RO-3306 did not reduce colony formation in the presence or absence of irradiation (Figure 1(b)).
Figure 1.
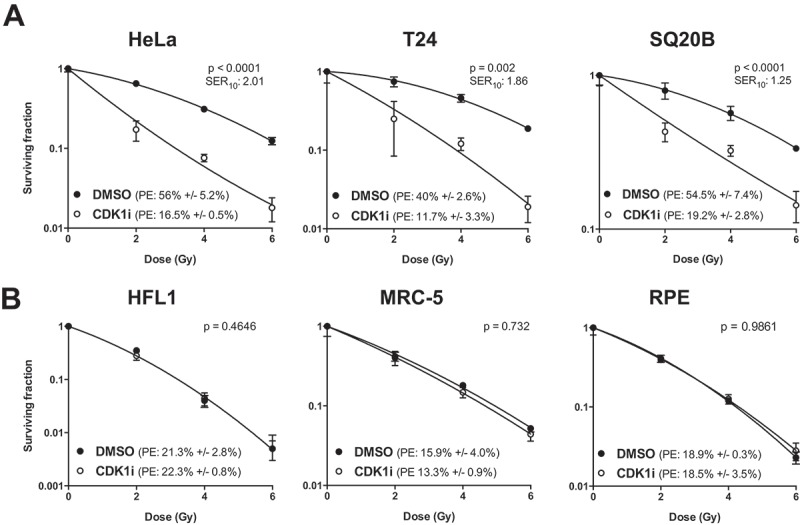
CDK1 inhibition sensitizes tumor cells but not normal cells to radiation. (a) Clonogenic survival assay of (a) tumor cells (HeLa, T24, and SQ20B) and (b) normal cells (HFL1, MRC-5 and RPE) treated with RO-3306 prior to radiation. Cells were seeded as single cells and treated with 5 µM RO-3306 from 3 h after seeding. Cells were irradiated 20 h after compound addition followed by a medium change. Colonies were stained at 7 – 13 days after seeding. Data are representative of three independent experiments, and are presented as mean ± SD from triplicate wells, p-values were derived through two-way ANOVA, testing whether the curves are statistically different. PE = plating efficiency; SER10 = sensitization enhancement ratio at a surviving fraction of 10%.
These results confirmed CDK1 as a radiosensitization target and indicated that this effect was specific for tumor cells. In an attempt to identify the reason for the lack of a cytotoxic effect in normal cells, we first sought to determine whether the capacity of RO-3306 to suppress CDK1 function was comparable in both normal and tumor-derived cell lines. First we tested whether RO-3306 abrogated phosphorylation of CDK1 substrates in these cells using the MPM2 antibody, which recognizes the Ser/Thr-Pro motif in proteins phosphorylated by CDK1. To enhance assay sensitivity, cultures were treated with nocodazole, arresting cells in pro-metaphase when CDK1 activity is highest, and then treated with RO-3306. Inhibitor treatment was equally effective in both tumor and normal cells in suppressing CDK1-mediated phosphorylation (Figure 2(a), Supplementary Figure 2). As inhibition of CDK1 activity is expected to prevent cells from completing mitosis, we used flow cytometry to test whether RO-3306 treatment caused a G2/M arrest in normal cells. The cell cycle profile after 20 hours RO-3306 treatment showed that the inhibitor did cause a G2/M arrest in both tumor and normal cells (Figure 2(b)). Although the percentage of cells in G2/M after treatment was higher in tumor cell lines, these flow cytometry data indicate G2/M arrest was achieved for both tumor and normal cell lines following treatment. Together with the biochemical results, our tests were able to confirm that RO-3306 effectively inhibited CDK1 activity in normal cell lines.
Figure 2.
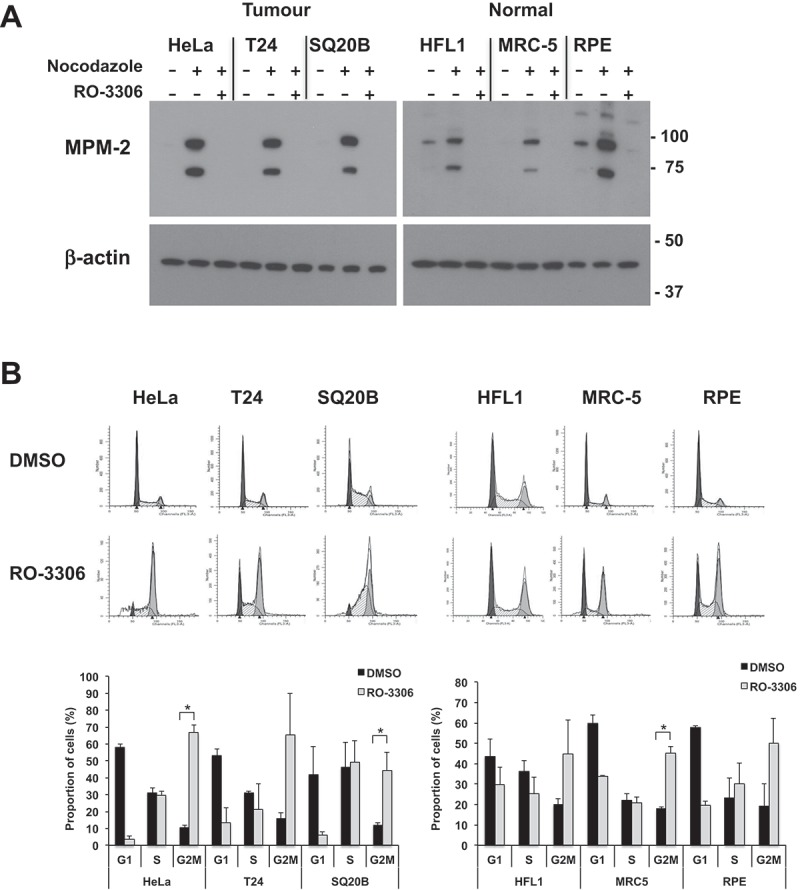
RO-3306 treatment causes inhibition of downstream signaling and cell cycle arrest in both tumor and normal cells. (a) Western blot stained with the MPM-2 antibody, recognizing phosphorylated CDK1 substrates. Cultures were enriched for mitotic cells by overnight nocodazole treatment followed by 2 h treatment with 5 µM RO-3306 in the continuous presence of nocodazole. Both floating and adherent cells were lysed and subjected to immunoblotting. Image is representative of three independent experiments. For clarity, a longer exposure is shown for the normal cell lysates; a comparison of different exposure times is shown in Supplementary Figure 2. (b) Cell cycle profile of tumor and normal cells treated with RO-3306. Cells were seeded in 6-well plates and treated with 5 µM RO-3306 for 20 h. Cells were lifted, fixed in 70% ethanol and stained with propidium iodide for analysis by flow cytometry. Representative histograms are shown (dark grey: G1, white: S; light grey: G2/M). Graph shows percentages in each cell cycle phase determined through curve fitting with ModFit and show the mean +/- SD from two independent experiments. Significant increases in G2/M proportion after RO-3306 treatment are indicated (* p < 0.05).
We next investigated other potential explanations for differences in susceptibility to CDK1 inhibition observed between tumor and non-tumor cells. As the CDK1 inhibitor is expected to be mainly acting on cells going through G2, we decided to closely examine the cell cycle profile of normal cells plated in colony formation assays as performed in Figure 1. For these assays, we routinely grow cells in standard culture flasks for 3 days and then reseed at low densities prior to treatment. We found that under these experimental conditions, normal cells appeared to be arrested in G1 for a prolonged period after plating (Figure 3(a)). At early time points very few cells were in S-phase; cells started to enter S-phase from 15 hours after seeding and reached G2 by 20–24 hours (Figure 3(a)). This apparent arrest was not seen in tumor cells grown and plated in similar conditions. Instead the tumor cells were distributed more evenly across the cell cycle phases and had on average about 30% cells in S-phase at the point of seeding (Supplementary Figure 3). The tumor cells did not experience a lag after plating but continued cycling and their average G2/M content remained at 10–20% throughout the 24 hours period after seeding (Supplementary Figure 3). Interestingly, we found that those few normal cells that were in S-phase at the point of cell seeding had cell cycle phase lengths that were not too dissimilar to that of tumor cells (Supplementary Figure 4). This suggests that proliferating normal cells progress through the cell cycle at a rate similar to that of tumor cells but that they are more prone to cell cycle arrest.
Figure 3.
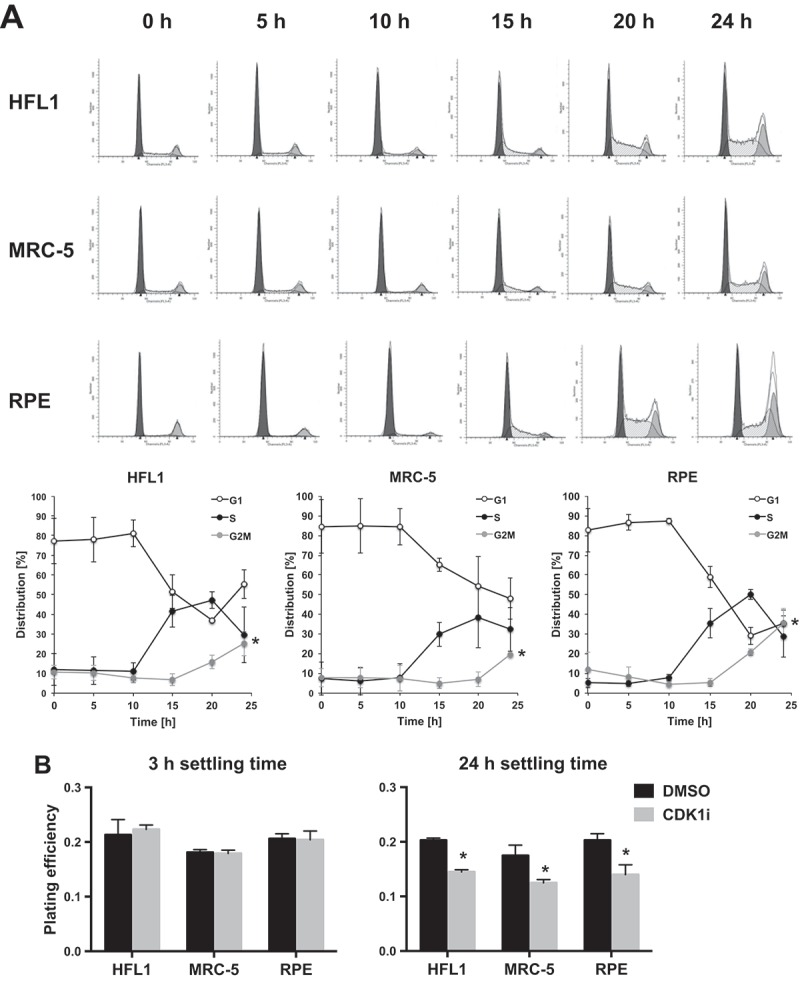
Stalling of cell cycle progression in normal cells causes insensitivity to CDK1 inhibition. (a) Investigation of the cell cycle progression of untreated HFL1, MRC-5 and RPE cells plated for colony formation assays. Cultures were grown for three days to 80% confluence, lifted and reseeded in the absence of drug. Cells were then fixed for cell cycle analysis at the time points indicated. Representative histograms are shown (dark grey: G1, white: S; light grey: G2/M). Graphs indicate percentages in each cell cycle phase over time determined through curve fitting with ModFit and show the mean +/- sd from three independent experiments. Significant differences in G2/M proportion from t = 0 are indicated, * p < 0.05. (b) Clonogenic survival assay of HFL1, MRC-5 and RPE cells treated with RO-3306 at different time points. Cultures were grown for three days to 80% confluence, lifted and seeded as single cells. RO-3306 was added at a concentration of 5 µM at 3 or 24 h after seeding, followed by a medium change after 20 h of compound incubation. Colonies were stained after 12 days. Data are representative of three independent experiments, and is presented as mean +/- SD from triplicate wells, *p < 0.05.
The findings described above could potentially explain the lack of CDK1 inhibition in normal cells shown earlier (Figure 1). Because of the experimental setup, which involved growing the cells for three days prior to seeding, it is conceivable that most of the normal cells were not going through G2 during RO-3306 exposure and thus less sensitive to CDK1 inhibition. To test this hypothesis, we compared colony formation capacity in normal cells after CDK1 inhibition (5 μM RO-3306, 20 hours) using either cells with a low proportion of cells transiting G2 (by adding the compound 3 hours post-seeding), or with a higher proportion of cells transiting G2 (by adding the compound 24 hours post-seeding). When RO-3306 was added 3 hours after seeding, there was no effect on colony formation but when RO-3306 was added 24 hours after seeding, there was a significant decrease in clonogenic survival (Figure 3(b)). These results show that normal cells are susceptible to CDK1 inhibition when they are passing through G2 phase and that the apparent lack of effect shown earlier was merely caused by the experimental setup. This was confirmed by studying the level of G2/M arrest achieved by CDK1 inhibition, comparing addition of inhibitor at 3 or 24 hours after seeding. When RO-3306 was added 3 hours after seeding, the G2/M arrest in normal cells was minimal compared to the level of G2/M arrest achieved when RO-3306 was added 24 hours after seeding (Supplementary Figure 5). In tumor cells in contrast, a high level of G2/M arrest was achieved regardless of whether inhibitor was added at 3 or 24 hours after seeding (Supplementary Figure 5).
These results would predict that normal cells are more sensitive to continuous than short-term CDK1 inhibition when the inhibitor is added 3 h after plating. We compared the effects of short-term versus continuous RO-3306 treatment, again assessing colony formation in the absence of irradiation. Interestingly, while there was a significant difference in IC50 between normal and tumor cells for the 20 hour treatment, this difference was lost for the continuous treatment, showing comparable IC50s for tumor and normal cells grouped together (Figure 4). Together these results show that in these settings, normal cells are less sensitive to short-term treatment because fewer cells pass through G2/M during the course of the incubation period. However, when these cells are continuously exposed to the CDK1 inhibitor, the initial cell cycle distribution and growth rate are irrelevant and hence the differential sensitivity between tumor and normal cells is lost.
Figure 4.
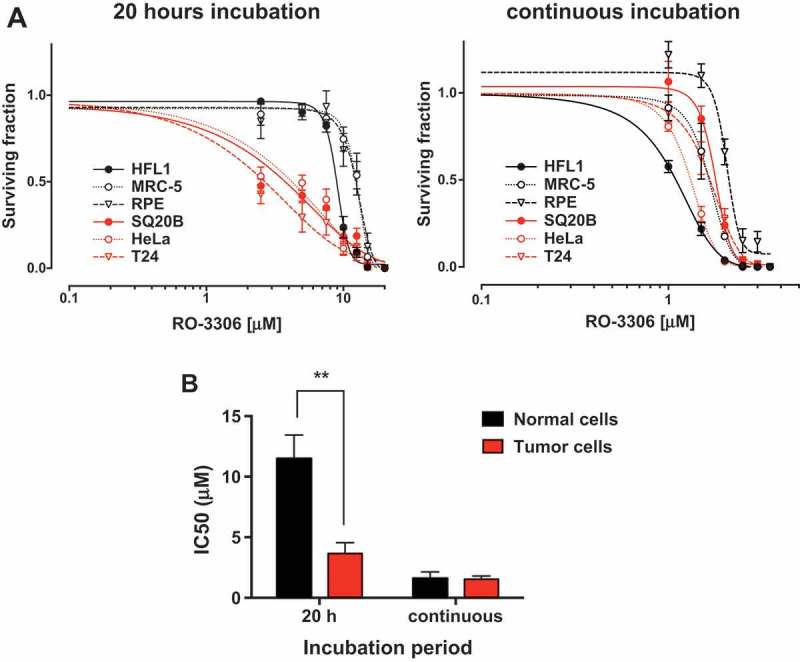
Normal and tumor cells are equally sensitive to continuous CDK1 inhibition. (a) Clonogenic survival assay of tumor and normal cells treated for 20 h or continuously with increasing concentration of RO-3306. Cultures were grown for three days to 80% confluence, lifted and seeded as single cells. RO-3306 was added 3 h after seeding and either removed after 20 h or left for the duration of the experiment. Colonies were stained after 12 days. Representative of three independent experiments, data is presented as mean +/- SD from triplicate wells. (b) Comparison of IC50 values for tumor and normal cells. IC50 values were determined for each cell line using the data in panel A. Mean IC50 was calculated for both tumor and normal cells grouped together. Statistical differences were confirmed by t-tests, ** p < 0.01.
Following the finding that inhibiting CDK1 can kill normal cells going through G2/M, we next investigated whether this cell cycle dependency would also influence sensitization to radiation. This was again tested by adding the inhibitor at different time points after seeding and then irradiating after 20 hours of treatment. As shown earlier in Figure 1, addition of RO-3306 at 3 hours after seeding, when the cells exhibited stalled cell cycle progression, did not cause any radiosensitization (Figure 5). However, when RO-3306 was added 24 hours after seeding, when many cells were entering G2 phase, significant radiosensitization could be seen in all three cell lines (Figure 5). Tumor cells in contrast, which did not experience a lag after seeding, showed comparable radiosensitization in cells treated with RO-3306 both at 3 hours and 24 hours after seeding (Supplementary Figure 6). These results show that inhibiting CDK1 can radiosensitize not only tumor cells but also normal cells when they are actively progressing through the cell cycle.
Figure 5.
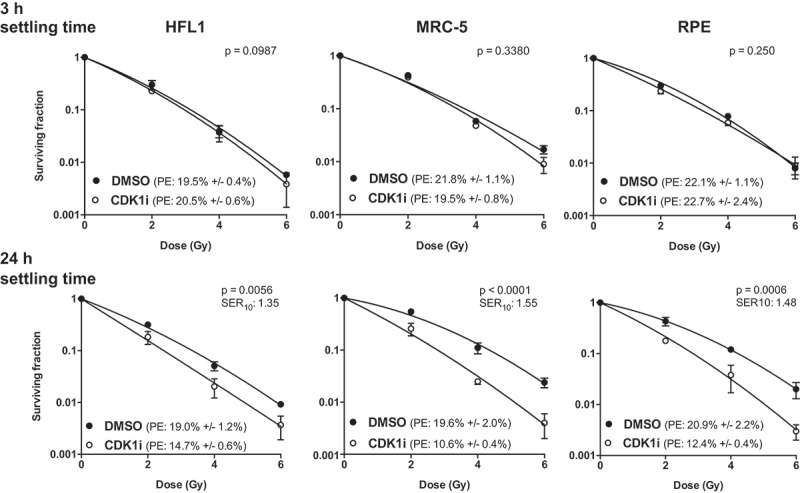
CDK1 inhibition sensitizes normal cells to radiation in a cell cycle dependent manner. (a) Clonogenic survival assay of cells treated with RO-3306 at different time points followed by radiation. Cells were grown in T75 flasks for three days, lifted and plated as single cells in 6-well plates. RO-3306 (5 µM) was added either at 3 h after seeding (for stalled cells) or at 24 h after seeding (when many cells are entering G2), and cells were irradiated 20 h later followed by a medium change. Colonies were stained after 12 days. Representative of three independent experiments, data is presented as mean +/- SD from triplicate wells. p-values were derived through two-way ANOVA, testing whether the curves are statistically different. PE = plating efficiency; SER10 = sensitization enhancement ratio at a surviving fraction of 10%.
Discussion
In this paper we describe how targeting CDK1 using the specific inhibitor RO-3306 can reduce survival both as a single agent and in combination with irradiation in both tumor and normal cells. Our initial results suggested that the radiosensitization effect was restricted to tumor cells. Although the CDK1 inhibitor did reduce CDK1-mediated phosphorylation and induced a G2/M arrest in normal cells, they were not radiosensitized by CDK1 inhibition. Careful investigation of the experimental setup subsequently revealed that the normal cells were not actively cycling when they were seeded in colony formation assays and therefore insensitive to CDK1 inhibition at the point of treatment. At early timepoints after seeding, the normal cells were predominantly in G1-phase with very cells in S-phase. Cells started to enter S-phase from 15 hours after seeding and reached G2 by 20–24 hours. This phenomenon was not seen in the tumor lines, which did not experience a lag after plating and had a comparable G2/M content throughout the 24-hour period after seeding.
It is important to note that it appears these cell cycle delay effects only become apparent when normal cells have been grown in culture for three days or more and have reached a high level (> 70–80%) of confluency. This may explain why Figure 2 showed a G2/M arrest in normal cells treated with RO-3306 added only 4 hours after seeding. Assessment of the experimental procedures suggested that for this experiment, the normal cells had not reached a high level of confluency at the point of seeding and were still actively cycling.
Subsequent experiments showed that treating normal cells enriched in S-G2 phase could uncover their apparent insensitivity to CDK1 inhibition. This cell cycle dependency was also evident for RO-3306-induced sensitization to radiation-induced DNA damage. Although the degree of radiosensitization was not as high as in tumor cells, our findings do show that normal cells are not insensitive to CDK1 inhibition. Importantly, normal and tumor cells were equally sensitive to continuous CDK1 inhibition as a single agent. Our data suggests that the therapeutic window for CDK1 inhibition is therefore narrow and that prolonged CDK1 inhibition may aggravate normal tissue effects in patients.
CDK1 has also been reported to function in G1 and S-phase [reviewed in [13]. Although we did not specifically look at the effect of CDK1 inhibition on G1 or S-phase cells, our finding that CDK1 inhibition did not affect normal cells that are predominantly arrested in G1 suggests that CDK1 inhibition in G1 phase does not affect viability.
Our findings are in contrast with the studies mentioned earlier that suggested that targeting CDK1 is an attractive anti-cancer strategy with potentially minimal normal tissue effects. Johnson and co-workers showed that CDK1 inhibition using shRNA or RO-3306 sensitized non-small-cell lung cancer cells to DNA-damaging agents without affecting the sensitivity of normal RPE epithelial cells [6]. Similar to our findings, their lack of effect on normal cells could perhaps be explained by the cells being stalled at the time of treatment. Several studies also showed that inhibition of CDK1 in vivo reduces xenograft growth but does not cause any normal tissue toxicity [7,8,10]. However, it is possible there were more subtle or long-term side effects, which are not easily detectable in a mouse model.
As RO-3306 is cleared very rapidly from the bloodstream [7], it is not suitable for in vivo assays or clinical application. The CDK inhibitors that are currently in clinical development are all targeting multiple CDKs. Many of these have reported adverse side effects in patients, including myelosuppression, anemia, diarrhea and nausea [14]. Dinaciclib (MK‑7965), a CDK1, 2, 5, 9 inhibitor has been associated with leukopenia and thrombocytopenia [15,16]. The clinical development of the CDK1, 2, 9 inhibitor AZD5438 was discontinued partly because of low tolerability [17]. Although it is not possible to identify the relative contribution of each CDK subtype to adverse outcomes in these studies, our results suggest that these effects are probably attributable to CDK1 inhibition.
In summary our data shows that CDK1 inhibitor-induced toxicity and radiosensitization is not restricted to tumor cells and as such CDK1 inhibition would be expected to exacerbate normal tissue toxicity if used clinically. Furthermore, our observation that an apparent lack of effect in normal cells can be attributed to experimental setup has general implications for in vitro testing for tumor specificity of novel anti-cancer compounds. Our finding that normal cells become easily arrested under standard culture conditions is particularly relevant for evaluation of compounds that target the cell cycle progression or are directed against targets only active in particular cell cycle phases.
Material & methods
Cell culture
HeLa, T24, MRC-5, HFL1 and RPE (ARPE-19) cells were purchased from the American Type Culture Collection (ATCC). SQ20B cells were kindly provided by Dr. Ralph Weichselbaum (University of Chicago). HeLa and SQ20B cells were cultured in DMEM, T24 in RPMI, MRC-5 cells in MEM, HFL1 cells in Ham’s and RPE cells were cultured in DMEM/F-12. Media (Sigma) were supplemented with 10% Fetal Bovine Serum (FBS; Pan Biotech) and cells were grown at 37°C and 5% CO2. Cells were regularly tested for mycoplasma using the MycoAlert kit (Lonza). Cell lines grown beyond four months after purchase were authenticated by short tandem repeat (STR) profiling by the DNA Diagnostics Centre.
Compounds and antibodies
RO-3306 was purchased from Sigma, dissolved at 10 mM in DMSO and stored in aliquots at −80°C. Nocodazole (Sigma) was dissolved in 100 µg/ml in DMSO and stored in aliquots at −80°C. A final concentration of 100 ng/ml was used. Tumor cells were incubated for 16 h in nocodazole and normal cells for 20 h, in order to allow sufficient accumulation of mitotic cells for both cell types. MPM-2 antibody was from Millipore (05–368), mouse anti-human beta-actin from Sigma (A1978), anti-BrdU antibody from BD Biosciences (347580), HRP-conjugated goat anti-mouse antibody from Thermofisher (10158113), Alexa Fluor 488 goat anti-mouse from Thermofisher (A11017).
Colony formation assays
Single cell suspensions were plated at low densities in 6-well plates. For unirradiated wells, 200 cells and 500 cells per well were plated for tumor and normal cells, respectively; the seeding density was doubled for each 2 Gy increase in radiation dose to account for cell death. Cells were left to adhere for a minimum of 3 hours at 37°C prior to compound addition. Plates were irradiated at 2, 4 and 6 Gy using a cesium-137 irradiator (GSR D1 from Gamma Service; dose rate 1.24 Gy/min). Colonies were grown for 8–14 days, stained with crystal violet and counted using the Gelcount automated colony counter (Oxford Optronics).
Immunoblotting
Protein lysates were prepared using RIPA lysis buffer (Thermo Scientific) and proteins were separated using SDS-PAGE electrophoresis followed by immunoblotting. Bound antibodies were detected by developing film exposed to nitrocellulose membrane incubated with chemiluminescence reagent (SuperSignal, Millipore).
Flow cytometry
Cells were seeded into 6-well plates (3 x 10⁵ cells/well) or T175 flasks at a concentration of 2 × 10⁵ cells/flask. At the appropriate time point, cells were lifted in trypsin, fixed in ice cold 70% ethanol and after a PBS wash stained in propidium iodide (PI) staining solution (50 µg/ml PI, 200 µg/ml RNase). Stained cells were run on a BD FACScan flow cytometer and plots analyzed using ModFit software.
Cell cycle analysis through BrdU incorporation
Cells were grown for three days to 80% confluence and pulse-labeled with 10 µM BrdU for the last 30 min. After BrdU removal, cells were lifted, reseeded and grown for 0 h, 4 h, 10 h or 17 h prior to lifting and fixing in ice-cold 70% ethanol. Staining for incorporated BrdU was performed as described [18]. Cell cycle phase length was determined similarly as described in reference [19] and as follows. S-phase length was determined by calculating the relative movement (RM) at t = 0 and t = 4 h: RM = (FL – FG1)/(FG2/M – FG1), where FL is the mean propidium iodide fluorescence of undivided BrdU-labeled cells, FG1 is the mean propidium iodide fluorescence of the G1 cells, and FG2/M is the mean propidium iodide fluorescence of the G2/M cells. RM values were plotted over time and after linear curve fitting, the time where RM = 1 (i.e. length of S-phase) was determined. The length of the G2/M phase was determined by calculating the proportion of BrdU labeled cells in G1 in the whole population, PG1-BrdU, at time points 4 h and 10 h: PG1-BrdU = PBrdU(G1) x PBrdU(whole)/PG1, where PBrdU(G1) is the percentage of BrdU labeled cells in G1, PBrdU(whole) the percentage of BrdU labeled cells in the whole population, and PG1 the percentage of all cells in G1. PG1-BrdU values were plotted over time and after linear curve fitting, the time where PG1-BrdU = 0 (i.e. length of G2/M phase) was determined. The cell cycle time was determined by first calculating the RM of the BrdU labeled cells that had reentered S-phase (RMdivided) at 17 h. By using the slope of the increase in RM over time (determined in the S-phase calculation), the time where RMdivided would again reach the RM measured at the beginning of the time course experiment (RMt=0h), i.e. the cell cycle time, was determined. G1 length was calculated by subtracting S-phase and G2/M lengths from the cell cycle time.
Statistics
Curve fitting and statistical analysis (two tailed t-tests and ANOVA) was performed in GraphPad Prism (version 6.0d). A p-value of < 0.05 was considered significant.
Radiation survival data was fitted using non-linear regression with the linear quadratic equation: S = exp – (α D + β D2), S denotes survival probability, D (Gy) is radiation dose and α (Gy-1) and β (Gy-2) are parameter constants. The sensitization enhancement ratio at 10% surviving fraction (SER10) was calculated: SER10: Duntreated/Dtreated, where Duntreated and Dtreated are the radiation doses yielding 10% survival as calculated using the derived α and β values. To assess statistical difference between the two curves, a factorial 2-way ANOVA was performed with survival as the dependent variable and dose levels (2, 4 and 6 Gy) and treatment (RO-3306) as the two factors. Single agent IC50 values for RO-3306 were determined by four-parameter non-linear regression on survival fractions versus log-transformed compound concentrations.
Funding Statement
G.S. Higgins is supported by a Cancer Research UK Clinician Scientist Award (Grant numbers C34326/A13092 and C34326/A19590). Additional support was provided by grants from Cancer Research UK and the Medical Research Council.
Disclosure statement
No potential conflict of interest was reported by the authors.
Supplementary material
Supplemental data for this article can be accessed here
References
- [1].Malumbres M. Cyclin-dependent kinases. Genome Biol. 2014;15(6): 122 PubMed PMID: 25180339. [DOI] [PMC free article] [PubMed] [Google Scholar]
- [2].Nigg EA. Mitotic kinases as regulators of cell division and its checkpoints. Nat Rev Mol Cell Biol. 2001. January;2(1):21–32. PubMed PMID: 11413462. [DOI] [PubMed] [Google Scholar]
- [3].London N, Biggins S. Signalling dynamics in the spindle checkpoint response. Nat Rev Mol Cell Biol. 2014. November;15(11):736–747. PubMed PMID: 25303117. [DOI] [PMC free article] [PubMed] [Google Scholar]
- [4].Perez de Castro I, de Carcer G, Malumbres M. A census of mitotic cancer genes: new insights into tumor cell biology and cancer therapy. Carcinogenesis. 2007. May;28(5):899–912. PubMed PMID: 17259655. [DOI] [PubMed] [Google Scholar]
- [5].Vassilev LT, Tovar C, Chen S, et al. Selective small-molecule inhibitor reveals critical mitotic functions of human CDK1. Proc Natl Acad Sci U S A. 2006. July 11;103(28):10660–10665. PubMed PMID: 16818887. [DOI] [PMC free article] [PubMed] [Google Scholar]
- [6].Johnson N, Cai D, Kennedy RD, et al. Cdk1 participates in BRCA1-dependent S phase checkpoint control in response to DNA damage. Mol Cell. 2009. August 14;35(3):327–339. PubMed PMID: 19683496. [DOI] [PMC free article] [PubMed] [Google Scholar]
- [7].Johnson N, Li YC, Walton ZE, et al. Compromised CDK1 activity sensitizes BRCA-proficient cancers to PARP inhibition. Nat Med. 2011. July;17(7):875–882. PubMed PMID: 21706030. [DOI] [PMC free article] [PubMed] [Google Scholar]
- [8].Costa-Cabral S, Brough R, Konde A, et al. CDK1 is a synthetic lethal target for KRAS mutant tumours. PLoS One. 2016;11(2):e0149099 PubMed PMID: 26881434. [DOI] [PMC free article] [PubMed] [Google Scholar]
- [9].Tiwana GS, Prevo R, Buffa FM, et al. Identification of vitamin B1 metabolism as a tumor-specific radiosensitizing pathway using a high-throughput colony formation screen. Oncotarget. 2015. March 20;6(8):5978–5989. PubMed PMID: 25788274. [DOI] [PMC free article] [PubMed] [Google Scholar]
- [10].Raghavan P, Tumati V, Yu L, et al. AZD5438, an inhibitor of Cdk1, 2, and 9, enhances the radiosensitivity of non-small cell lung carcinoma cells. Int J Radiat Oncol Biol Phys. 2012. November 15;84(4):e507–e514. PubMed PMID: 22795803. [DOI] [PMC free article] [PubMed] [Google Scholar]
- [11].Zwicker F, Ebert M, Huber PE, et al. A specific inhibitor of protein kinase CK2 delays gamma-H2Ax foci removal and reduces clonogenic survival of irradiated mammalian cells. Radiat Oncol. 2011. February 10;6:15 PubMed PMID: 21310046. [DOI] [PMC free article] [PubMed] [Google Scholar]
- [12].Prevo R, Tiwana GS, Maughan TS, et al. Depletion of signal recognition particle 72kDa increases radiosensitivity. Cancer Biol Ther. 2017. June 3;18(6):425–432. PubMed PMID: 28494188. [DOI] [PMC free article] [PubMed] [Google Scholar]
- [13].Enserink JM, Kolodner RD. An overview of Cdk1-controlled targets and processes. Cell Div. 2010;5:11 PubMed PMID: 20465793. [DOI] [PMC free article] [PubMed] [Google Scholar]
- [14].Asghar U, Witkiewicz AK, Turner NC, et al. The history and future of targeting cyclin-dependent kinases in cancer therapy. Nat Rev Drug Discov. 2015. February;14(2):130–146. PubMed PMID: 25633797. [DOI] [PMC free article] [PubMed] [Google Scholar]
- [15].Kumar SK, LaPlant B, Chng WJ, et al. Dinaciclib, a novel CDK inhibitor, demonstrates encouraging single-agent activity in patients with relapsed multiple myeloma. Blood. 2015. January 15;125(3):443–448. PubMed PMID: 25395429. [DOI] [PMC free article] [PubMed] [Google Scholar]
- [16].Mitri Z, Karakas C, Wei C, et al. A phase 1 study with dose expansion of the CDK inhibitor dinaciclib (SCH 727965) in combination with epirubicin in patients with metastatic triple negative breast cancer. Invest New Drugs. 2015. August;33(4):890–894. PubMed PMID: 25947565. [DOI] [PubMed] [Google Scholar]
- [17].Boss DS, Schwartz GK, Middleton MR, et al. Safety, tolerability, pharmacokinetics and pharmacodynamics of the oral cyclin-dependent kinase inhibitor AZD5438 when administered at intermittent and continuous dosing schedules in patients with advanced solid tumours. Ann Oncol. 2010. April;21(4):884–894. PubMed PMID: 19825886. [DOI] [PMC free article] [PubMed] [Google Scholar]
- [18].Pirovano G, Ashton TM, Herbert KJ, et al. TOPK modulates tumour-specific radiosensitivity and correlates with recurrence after prostate radiotherapy. Br J Cancer. 2017. August 8;117(4):503–512. PubMed PMID: 28677687. [DOI] [PMC free article] [PubMed] [Google Scholar]
- [19].Baron C, Penit C. Study of the thymocyte cell cycle by bivariate analysis of incorporated bromodeoxyuridine and DNA content. Eur J Immunol. 1990. June;20(6):1231–1236. PubMed PMID: 2369916. [DOI] [PubMed] [Google Scholar]
Associated Data
This section collects any data citations, data availability statements, or supplementary materials included in this article.