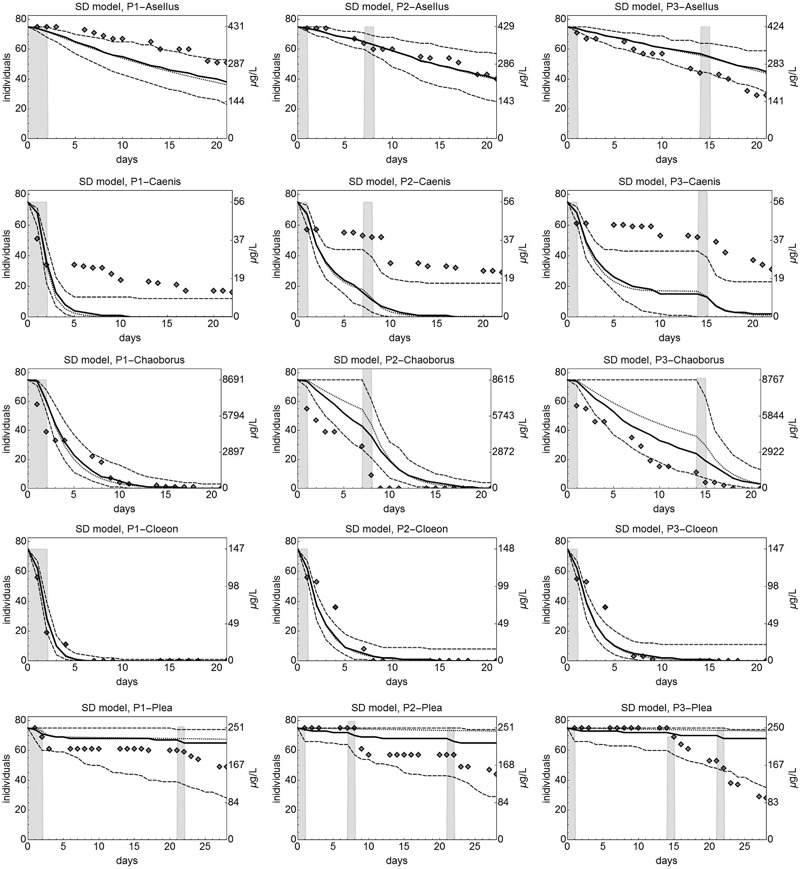
Fig. 3.

Observed and predicted survival of individuals of 5 macroinvertebrate species under 3 pulsed exposure profiles for imidacloprid, predicted by the stochastic death (SD) model calibrated to data from on acute testing (exp. MS_C). Diamonds indicate observed numbers of living organisms (exp. MS_V). The dashed lines show the 5 and 95 percentile of 10.000 probabilistic simulations of the time course of survival (see ESM2.2.4), the solid line is the respective median. Black dotted lines show the predicted deterministic rate of survivors. Grey bars show the exposure levels over time, measured concentrations as indicated in the axes labels on the right hand side of the single panels. For C.dipterum, in the P2 and P3 teratment no second pulse was applied becauyse almost all individuals were already dead
