

Abstract
Background:
Both the lateral center-edge angle and acetabular roof obliquity on anteroposterior radiographs are well-known prognostic predictors of osteoarthritis progression in patients with acetabular dysplasia. However, few studies have evaluated osteoarthritis progression on false-profile radiographs. In the present study, osteoarthritis progression was evaluated on anteroposterior and false-profile radiographs.
Methods:
We retrospectively evaluated 76 patients with acetabular dysplasia with Tönnis grade-0 or 1 osteoarthritis, from a group of 179 patients (209 hips), who had undergone unilateral periacetabular osteotomy from 1995 to 2005. We evaluated the hip joint of the contralateral, untreated side. All patients were followed for ≥10 years. Of the 76 patients, 52 patients with Tönnis grade-0 or 1 osteoarthritis at the latest follow-up were categorized into the non-progression group and the remaining 24 patients with Tönnis grade-2 or 3 osteoarthritis were categorized into the progression group. We evaluated patient characteristics as well as radiographic parameters, including the preoperative lateral center-edge angle, acetabular roof obliquity, and anterior center-edge angle.
Results:
The mean duration of follow-up was 12.6 years (range, 10 to 19 years). On univariate analysis, body weight, body mass index, and all radiographic parameters indicating the severity of acetabular dysplasia significantly differed between the 2 groups. On multivariate analysis, both the anterior center-edge angle and acetabular roof obliquity were considered to be significant predictive factors for osteoarthritis progression. On receiver operating characteristic curve analysis, the cutoff values for the lateral center-edge angle, acetabular roof obliquity, and anterior center-edge angle were 15.5°, 15.5°, and 12.5°, respectively.
Conclusions:
In addition to the lateral center-edge angle and acetabular roof obliquity, we showed that the anterior center-edge angle is a possible prognostic predictor of osteoarthritis progression. These findings indicate that radiographic parameters based on the false-profile view are relevant. Additionally, patients with an anterior center-edge angle of ≤12.5° and a lateral center-edge angle of ≤15.5° seem to be at higher risk of osteoarthritis progression over a 10-year period.
Level of Evidence:
Prognostic Level IV. See Instructions for Authors for a complete description of levels of evidence.
Acetabular dysplasia is one of the main causes of hip pain and secondary osteoarthritis1,2. It is characterized by morphological abnormalities, including a shallow acetabulum and reduced acetabular coverage of the femoral head, which result in chronic mechanical overload of the acetabular rim and structural instability3,4. The identification of the prognostic predictors of disease progression is clinically beneficial.
Several studies have investigated the relationship between acetabular dysplasia and osteoarthritis1,5-9. Both the lateral center-edge angle and acetabular roof obliquity are well-known prognostic predictors of osteoarthritis progression in patients with acetabular dysplasia. The anterior center-edge angle quantifies the amount of anterior coverage of the femoral head by the acetabular roof. To our knowledge, no long-term analyses of the anterior center-edge angle have been performed. Moreover, although many researchers have assessed osteoarthritis progression on anteroposterior radiographs10,11, few reports have described the evaluation of osteoarthritis progression on false-profile radiographs.
In the present retrospective study, we evaluated the progression of osteoarthritis in the hip joints of patients with untreated acetabular dysplasia with use of false-profile radiographs. Our primary aim was to determine the utility of false-profile radiographs for the detection of osteoarthritis progression in hips with acetabular dysplasia. Our secondary aim was to identify sensitive prognostic predictors of hip osteoarthritis.
Materials and Methods
We performed a retrospective review of 209 consecutive hips in 179 patients who had undergone periacetabular osteotomy12-15 for the treatment of symptomatic acetabular dysplasia from 1995 to 2005. The contralateral, untreated hips of patients who had undergone periacetabular osteotomy were reviewed. We excluded 30 patients who had undergone bilateral periacetabular osteotomy, 11 hips in 11 patients who had undergone other surgical treatments before or after periacetabular osteotomy, 19 hips in 19 patients with acetabular dysplasia with Tönnis grade-2 or 3 osteoarthritis in the contralateral hip at the time of periacetabular osteotomy, 11 hips in 11 patients with Legg-Calvé-Perthes-like deformity of the femoral head in the contralateral hip, and 2 hips in 2 patients with psychological depression. Of the remaining 106 contralateral hips with Tönnis grade-0 or 1 osteoarthritis, 30 hips were excluded because the patients were followed for <10 years. Finally, 76 hips in 76 patients (6 male and 70 female) were included in this study; of these, 52 hips had Tönnis grade-0 osteoarthritis and 24 hips had Tönnis grade-1 osteoarthritis. The follow-up rate was 72%.
In our department, the indications for periacetabular osteotomy included pain and limitation of daily activities for >5 months, a lateral center-edge angle of <25° on anteroposterior radiographs with improvement in the congruency of the hip in abduction, an age of <65 years at the time of surgery, and an intention to undergo surgery16,17. We routinely made false-profile radiographs of the contralateral hips if these untreated hips showed acetabular dysplasia (a lateral center-edge angle of <25°) on anteroposterior radiographs.
The patients were classified into non-progression and progression groups on the basis of the presence or absence of osteoarthritis progression, respectively. At the time of the latest follow-up, 52 patients with acetabular dysplasia (3 male and 49 female) with Tönnis grade-0 or 1 osteoarthritis constituted the non-progression group, and 24 patients (3 male and 21 female) with Tönnis grade-2 or 3 osteoarthritis constituted the progression group. The mean duration of follow-up was 12.6 years (range, 10 to 19 years). We evaluated clinical data for each patient (including sex, age at the time of surgery, duration of follow-up, and postoperative Harris hip score18 on the operatively treated side) in relation to hip osteoarthritis. Additionally, for each patient, we evaluated patient demographic information and clinical characteristics, including height, weight, body mass index (BMI), smoking status, and daily alcohol consumption.
Radiographic Evaluations
We evaluated the radiographic parameters of the hip joint on the contralateral, untreated side. The severity of acetabular dysplasia was assessed on standardized radiographs of the pelvis and hip, including anteroposterior and false-profile views. Radiographic evaluations included preoperative acetabular measurements of the lateral center-edge angle19, acetabular roof obliquity20, acetabular head index21, peak-to-edge distance9, lateral subluxation9, superior (vertical) subluxation9, and minimum hip joint space on anteroposterior pelvic radiographs. The crossover sign was recorded as an index of acetabular retroversion. The anterior center-edge angle as described by Lequesne and de Seze22, which quantifies the amount of anterior coverage of the femoral head by the acetabular roof, also was assessed on false-profile radiographs. False-profile radiographs were made with the patient in the standing position and with an angle of 65° between the pelvis and the film as described by Lequesne and de Seze22. The ipsilateral second metatarsal axis was parallel to the surface of the film, and the tube was at a right angle to the film. The tube-film distance was 100 cm, with the femoral head positioned at the center (Fig. 1)23.
Fig. 1.
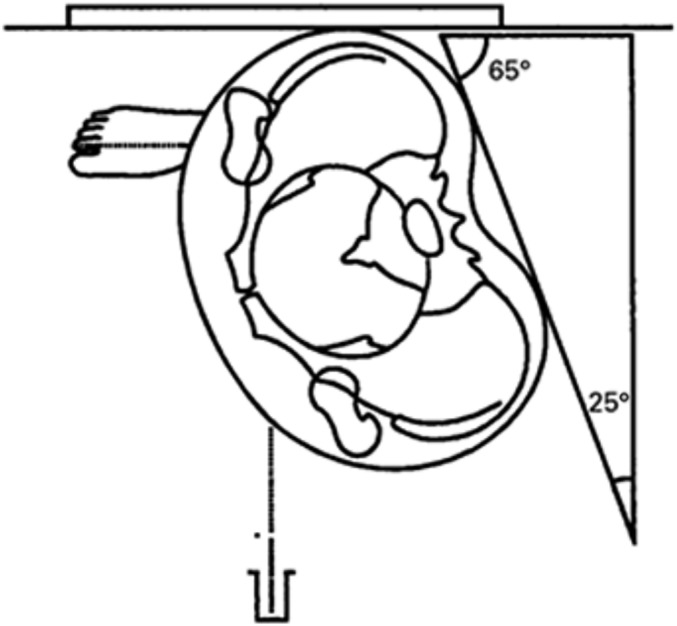
Illustration depicting the method used to make false-profile radiographs.
The severity of osteoarthritis was classified both preoperatively and postoperatively according to the Tönnis system24 as grade 0 (no signs of osteoarthritis), grade 1 (slight narrowing of the joint space, slight lipping at the joint margin, and slight sclerosis of the femoral head or acetabulum), grade 2 (small cysts in the femoral head or acetabulum, increased narrowing of the joint space, and moderate loss of sphericity of the femoral head), or grade 3 (large cysts, severe narrowing or obliteration of the joint space, severe deformity of the femoral head, and osteonecrosis).
The measurements were performed by 2 authors (S.A. and A.M.) who were blinded to the clinical results. The same observers reviewed the radiographs 3 times on different days, and the mean values were calculated. The measurements were analyzed for intraobserver and interobserver reliability. The intraclass correlation coefficients for these measurements were 0.89 to 0.96 (intraobserver variance) and 0.81 to 0.91 (interobserver variance).
Statistical Analysis
The Student t test and the chi-square test were used to compare patient data and radiographic parameters between the 2 groups. Multiple logistic regression analysis was applied to determine independent predictors of osteoarthritis progression in patients with acetabular dysplasia. We confirmed multicollinearity with use of the variance inflation factor (VIF). As a result, the weight was excluded. All other parameters had a VIF of <5. The cutoff values of the lateral center-edge angle, acetabular roof obliquity, and anterior center-edge angle that optimized sensitivity and specificity were identified with use of a receiver operating characteristic curve. The Pearson correlation coefficient (r) was used to evaluate correlations between the lateral center-edge angle and the anterior center-edge angle. The level of significance was defined as p < 0.05. Statistical analyses were performed with use of SPSS software (version 23.0, IBM).
Results
The clinical data for the 2 groups are shown in Table I. There were no significant differences in terms of age at the time of surgery, sex, duration of follow-up, or Harris hip score on the operatively treated side.
TABLE I.
Clinical and Disease Characteristics of Patients in the Non-Progression and Progression Groups
| Non-Progression Group | Progression Group | P Value | |
| Male:female ratio (no. of hips) | 3:49 | 3:21 | 0.32 |
| Age at surgery* (yr) | 38.7 (13 to 62) | 44.0 (31 to 57) | 0.07 |
| Duration of follow-up* (yr) | 12.4 (10.0 to 18.3) | 13.0 (10.5 to 18.5) | 0.34 |
| Harris hip score on operatively treated side* | |||
| Preop. | 75.1 (41 to 96) | 73.4 (39 to 98) | 0.64 |
| Postop. | 95.7 (61 to 100) | 93.8 (77 to 100) | 0.34 |
The data are given as the mean, with the range in parentheses.
The patient characteristics and radiographic findings are shown in Table II. Body weight (p = 0.017), BMI (p = 0.021), and all radiographic parameters other than the crossover sign (p = 0.131) were significantly different between the 2 groups. There were no significant differences in height, smoking status, or daily alcohol consumption between the 2 groups.
TABLE II.
Univariate Analysis of Patient Characteristics and Radiographic Parameters
| Non-Progression Group (N = 52) | Progression Group (N = 24) | P Value | |
| Patient characteristics | |||
| Height* (cm) | 154.9 ± 4.8 | 155.5 ± 4.9 | 0.597 |
| Weight* (kg) | 53.8 ± 8.2 | 60.0 ± 10.7 | 0.017 |
| BMI* (kg/m2) | 22.4 ± 3.0 | 24.8 ± 4.5 | 0.021 |
| Smoker (no. of patients) | 11 (21%) | 7 (29%) | 0.335 |
| Daily alcohol drinker (no. of patients) | 9 (17%) | 8 (33%) | 0.160 |
| Radiographic evaluations | |||
| Lateral center-edge angle* (°) | 19.3 ± 4.2 | 5.8 ± 9.2 | <0.001 |
| Acetabular roof obliquity* (°) | 8.6 ± 4.2 | 21.3 ± 6.9 | <0.001 |
| Acetabular head index* (%) | 72.6 ± 5.1 | 56.9 ± 9.7 | <0.001 |
| Sharp angle* (°) | 44.6 ± 2.2 | 48.0 ± 3.6 | <0.001 |
| Peak-to-edge distance* (mm) | 9.3 ± 3.0 | 3.0 ± 3.1 | <0.001 |
| Vertical subluxation* (mm) | 1.3 ± 2.4 | 4.6 ± 4.1 | 0.001 |
| Lateral subluxation* (mm) | 11.4 ± 2.4 | 15.5 ± 3.0 | <0.001 |
| Anterior center-edge angle* (°) | 24.5 ± 7.3 | 4.2 ± 9.1 | <0.001 |
| Crossover sign (no. of patients) | 4 (7.7%) | 5 (20.8%) | 0.131 |
The data are given as the mean and the standard deviation.
On multivariate analysis, both the anterior center-edge angle and acetabular roof obliquity were identified as significant predictive factors (Table III). The risk of osteoarthritis progression significantly increased as the anterior center-edge angle decreased (odds ratio [OR], 0.74; 95% confidence interval [CI], 0.57 to 0.95) or as the acetabular roof obliquity increased (OR, 1.50; 95% CI, 1.03 to 2.19).
TABLE III.
Multivariate Regression Analysis
| Odds Ratio | 95% CI | P Value | |
| Anterior center-edge angle | 0.74 | 0.57 to 0.95 | 0.019 |
| Acetabular roof obliquity | 1.50 | 1.03 to 2.19 | 0.034 |
Receiver operating characteristic curve analysis showed that the anterior center-edge angle was a fair predictor of osteoarthritis progression in patients with acetabular dysplasia (Table IV). An anterior center-edge angle cutoff value of 12.5° offered the maximum specificity and sensitivity (91% and 91%, respectively). Twenty-three patients (30%) had an anterior center-edge angle of ≤12.5°. Of these, 20 patients (87%) developed progression of osteoarthritis within 10 years. This anterior center-edge angle cutoff value was associated with a significant increase in the risk of osteoarthritis progression (OR, 77; 95% CI, 15.8 to 376).
TABLE IV.
Receiver Operating Characteristic Curve Analysis
| Cutoff | Specificity | Sensitivity | |
| Anterior center-edge angle | 12.5° | 91% | 91% |
| Acetabular roof obliquity | 15.5° | 96% | 88% |
| Weight | 66 kg | 96% | 32% |
| BMI | 27 kg/m2 | 96% | 32% |
The cutoff values of the acetabular roof obliquity and lateral center-edge angle were 15.5° and 15.5°, respectively. The acetabular roof obliquity cutoff value had a specificity and sensitivity of 96% and 88%, respectively, and the lateral center-edge angle cutoff value had a specificity and sensitivity of 90% and 92%, respectively. This lateral center-edge angle cutoff value, which is generically used as an index of acetabular dysplasia, also was associated with a significant increase in the risk of osteoarthritis progression (OR, 103; 95% CI, 18.6 to 575). Among the patient demographic characteristics, BMI was the most sensitive indicator. The cutoff value for BMI was 27 kg/m2 (specificity, 92%; sensitivity, 29%), and that for weight was 66 kg (specificity, 94%; sensitivity, 33%). Eleven patients (14%) had a BMI of >27 kg/m2; of those, 7 patients (64%) were in the progression group (OR, 4.9; 95% CI, 1.3 to 19).
The anterior center-edge angle was found to have a significant correlation with the lateral center-edge angle (r = 0.700; p < 0.001).
Discussion
Few studies have investigated the detection of osteoarthritis progression on the basis of 3-dimensional analysis. In the present study, we evaluated osteoarthritis progression with use of both anteroposterior and false-profile radiographic views. We also evaluated patient characteristics and radiographic parameters to identify potential prognostic predictors of osteoarthritis progression in hips affected by acetabular dysplasia.
We found that the anterior center-edge angle and acetabular roof obliquity were independent predictors of osteoarthritis progression. The anterior center-edge angle cutoff value of 12.5° was found to predict osteoarthritis progression with the greatest sensitivity and specificity (Table IV). Furthermore, this anterior center-edge angle cutoff value and a BMI of 27 kg/m2 were additive risk factors for osteoarthritis progression. When neither of these factors was present, the risk for osteoarthritis progression was low (4%; 2 of 50); if both were present, however, the risk increased to 100% (6 of 6).
Murphy et al.9 evaluated osteoarthritis progression with use of anteroposterior radiographs and reported that none of their patients with well-functioning hips at the age of 65 years had a lateral center-edge angle of <16° or an acetabular roof obliquity of >15°. Omeroğlu et al.10 evaluated the need for secondary surgery in hips with acetabular dysplasia among patients 5 to 7 years of age and concluded that acetabular roof obliquity was the best of 15 examined radiographic parameters on the basis of decisions made by experienced surgeons. Thus, our findings support their conclusion that acetabular roof obliquity may be a useful radiographic parameter during follow-up of patients with acetabular dysplasia.
Jacobsen et al.11 investigated a large cohort of subjects from Denmark (n = 3,859). Although that study was cross-sectional, the lateral center-edge angle and acetabular head index were identified as useful predictive factors of osteoarthritis progression. In concordance with our findings, these parameters were related to the severity of acetabular dysplasia and osteoarthritis progression.
Our study demonstrated a correlation between the lateral center-edge angle and the anterior center-edge angle (r = 0.700; p < 0.001). However, on multivariate analysis, both the anterior center-edge angle and acetabular roof obliquity were identified as significant predictive factors (Table III), indicating that the anterior center-edge angle is a useful parameter in terms of the prediction of osteoarthritis progression. In addition, acetabular dysplasia has been known to have morphological varieties. For example, some patients with acetabular dysplasia showing a normal lateral center-edge angle, despite having clinical symptoms, have an abnormal anterior center-edge angle25. Furthermore, Ganz and Leunig26 reported that making surgical decisions or prognostic predictions on the basis of isolated radiographically recorded parameters is questionable because of the multitude of pathomorphological variations of acetabular dysplasia. Thus, we believe that false-profile radiographs may allow for a more detailed evaluation of acetabular dysplasia that cannot be confirmed only on the basis of anteroposterior radiographs.
Systematic reviews analyzing clinical data and patient characteristics have established an evidence base for several well-recognized risk factors for hip osteoarthritis, such as previous hip injury, occupations involving heavy lifting, and obesity27-29. In the present study, weight and BMI significantly differed between the 2 groups, and obesity was identified as a risk factor for osteoarthritis progression. In our data on Japanese patients with osteoarthritis, the risk of osteoarthritis progression was significantly higher among those with a body weight of >66 kg (OR, 8.2) or a BMI of >27 kg/m2 (OR, 4.9).
The present study had some limitations. First, the false-profile view has some issues related to the method of measurement. The method of measurement can be influenced by the pelvic rotation angle and the position of the foot, which may introduce calculation errors. In addition, the correlation of the anterior center-edge angle with anterior acetabular coverage in the sagittal plane was low; thus, the anterior center-edge angle cannot be transposed onto the sagittal plane. The clinical importance of the anterior center-edge angle therefore must be interpreted with consideration of the natural correlation with osteoarthritis progression30,31. These factors could have led to miscalculations in the present study. Second, we could only evaluate a small number of cases, and we did not achieve an 80% follow-up rate. Loss to follow-up increases bias, and this factor may have affected the study results. Third, we only followed up the contralateral, untreated side. Although there were no significant differences between the 2 groups in terms of the Harris hip score on the operatively treated side, we believe that our results were affected by the operatively treated side to some extent. Fourth, BMI was significantly different between the 2 groups, which strongly affected the postoperative radiographic findings. Therefore, bias was present in this comparison. Fifth, although a recent study showed that a high activity level and severe dysplasia may lead to the development of symptoms of osteoarthritis32, we could not collect data on the activity levels of our patients and thus we did not evaluate this potential factor. Finally, although the Tönnis grade is a traditional classification parameter for osteoarthritis, it is a qualitative rather than a quantitative parameter. Image analysis using magnetic resonance imaging techniques, such as delayed gadolinium-enhanced magnetic resonance imaging of cartilage33 and various other mapping images34, is being developed for the quantitative evaluation of the articular cartilage in patients with osteoarthritis.
In conclusion, we showed that the anterior center-edge angle is a possible prognostic predictor of osteoarthritis progression. Our findings indicate that radiographic parameters based on the false-profile view are relevant. In addition, patients with an anterior center-edge angle of ≤12.5° and a lateral center-edge angle of ≤15.5° seem to be at higher risk of osteoarthritis progression over a period of 10 years.
Disclosure of Potential Conflicts of Interest
Footnotes
Investigation performed at the Department of Orthopaedic Surgery, Fukuoka University Faculty of Medicine, Nanakuma, Jonan-ku, Fukuoka, Japan
Disclosure: No external funding was received for this study. The Disclosure of Potential Conflicts of Interest forms are provided with the online version of the article (http://links.lww.com/JBJSOA/A23).
References
- 1.Harris WH. Etiology of osteoarthritis of the hip. Clin Orthop Relat Res. 1986. December;213:20-33. [PubMed] [Google Scholar]
- 2.Wiberg G. Studies on dysplastic acetabula and congenital subluxation of the hip joint with special reference to the complications of osteoarthritis. Acta Chir Scand. 1939;83(58):5-135. [Google Scholar]
- 3.Maeyama A, Naito M, Moriyama S, Yoshimura I. Evaluation of dynamic instability of the dysplastic hip with use of triaxial accelerometry. J Bone Joint Surg Am. 2008. January;90(1):85-92. [DOI] [PubMed] [Google Scholar]
- 4.Murphy SB, Kijewski PK, Millis MB, Harless A. Acetabular dysplasia in the adolescent and young adult. Clin Orthop Relat Res. 1990 Dec;261:214-23. [PubMed] [Google Scholar]
- 5.Jingushi S, Ohfuji S, Sofue M, Hirota Y, Itoman M, Matsumoto T, Hamada Y, Shindo H, Takatori Y, Yamada H, Yasunaga Y, Ito H, Mori S, Owan I, Fujii G, Ohashi H, Iwamoto Y, Miyanishi K, Iga T, Takahira N, Sugimori T, Sugiyama H, Okano K, Karita T, Ando K, Hamaki T, Hirayama T, Iwata K, Nakasone S, Matsuura M, Mawatari T. Osteoarthritis hip joints in Japan: involvement of acetabular dysplasia. J Orthop Sci. 2011. March;16(2):156-64. Epub 2011 Feb 26. [DOI] [PubMed] [Google Scholar]
- 6.Aronson J. Osteoarthritis of the young adult hip: etiology and treatment. Instr Course Lect. 1986;35:119-28. [PubMed] [Google Scholar]
- 7.Murray RO. The aetiology of primary osteoarthritis of the hip. Br J Radiol. 1965. November;38(455):810-24. [DOI] [PubMed] [Google Scholar]
- 8.Ganz R, Leunig M, Leunig-Ganz K, Harris WH. The etiology of osteoarthritis of the hip: an integrated mechanical concept. Clin Orthop Relat Res. 2008. February;466(2):264-72. Epub 2008 Jan 10. [DOI] [PMC free article] [PubMed] [Google Scholar]
- 9.Murphy SB, Ganz R, Müller ME. The prognosis in untreated dysplasia of the hip. A study of radiographic factors that predict the outcome. J Bone Joint Surg Am. 1995. July;77(7):985-9. [DOI] [PubMed] [Google Scholar]
- 10.Omeroğlu H, Ağuş H, Biçimoğlu A, Tümer Y. Evaluation of experienced surgeons’ decisions regarding the need for secondary surgery in developmental dysplasia of the hip. J Pediatr Orthop. 2012Jan-Feb;32(1):58-63. [DOI] [PubMed] [Google Scholar]
- 11.Jacobsen S, Sonne-Holm S, Søballe K, Gebuhr P, Lund B. Hip dysplasia and osteoarthrosis: a survey of 4151 subjects from the Osteoarthrosis Substudy of the Copenhagen City Heart Study. Acta Orthop. 2005. April;76(2):149-58. [DOI] [PubMed] [Google Scholar]
- 12.Ganz R, Klaue K, Vinh TS, Mast JW. A new periacetabular osteotomy for the treatment of hip dysplasias. Technique and preliminary results. Clin Orthop Relat Res. 1988. July;232:26-36. [PubMed] [Google Scholar]
- 13.Matheney T, Kim YJ, Zurakowski D, Matero C, Millis M. Intermediate to long-term results following the Bernese periacetabular osteotomy and predictors of clinical outcome. J Bone Joint Surg Am. 2009. September;91(9):2113-23. [DOI] [PubMed] [Google Scholar]
- 14.Steppacher SD, Tannast M, Ganz R, Siebenrock KA. Mean 20-year followup of Bernese periacetabular osteotomy. Clin Orthop Relat Res. 2008. July;466(7):1633-44. Epub 2008 May 1. [DOI] [PMC free article] [PubMed] [Google Scholar]
- 15.Gala L, Clohisy JC, Beaulé PE. Hip dysplasia in the young adult. J Bone Joint Surg Am. 2016. January 06;98(1):63-73. [DOI] [PubMed] [Google Scholar]
- 16.Naito M, Shiramizu K, Akiyoshi Y, Ezoe M, Nakamura Y. Curved periacetabular osteotomy for treatment of dysplastic hip. Clin Orthop Relat Res. 2005. April;433:129-35. [DOI] [PubMed] [Google Scholar]
- 17.Murphy S, Deshmukh R. Periacetabular osteotomy: preoperative radiographic predictors of outcome. Clin Orthop Relat Res. 2002. December;405:168-74. [PubMed] [Google Scholar]
- 18.Harris WH. Traumatic arthritis of the hip after dislocation and acetabular fractures: treatment by mold arthroplasty. An end-result study using a new method of result evaluation. J Bone Joint Surg Am. 1969. June;51(4):737-55. [PubMed] [Google Scholar]
- 19.Wiberg G. The anatomy and roentgenographic appearance of a normal hip joint. Acta Chir Scand. 1939;83:7-38. [Google Scholar]
- 20.Massie WK, Howorth MB. Congenital dislocation of the hip. Part I. Method of grading results. J Bone Joint Surg Am. 1950. July;32(3):519-31. [PubMed] [Google Scholar]
- 21.Heyman CH, Herndon CH. Legg-Perthes disease; a method for the measurement of the roentgenographic result. J Bone Joint Surg Am. 1950. October;32(4):767-78. [PubMed] [Google Scholar]
- 22.Lequesne M, de Seze S. [False profile of the pelvis. A new radiographic incidence for the study of the hip. Its use in dysplasias and different coxopathies]. Rev Rhum Mal Osteoartic. 1961. December;28:643-52. French. [PubMed] [Google Scholar]
- 23.Chosa E, Tajima N. Anterior acetabular head index of the hip on false-profile views. New index of anterior acetabular cover. J Bone Joint Surg Br. 2003. August;85(6):826-9. [PubMed] [Google Scholar]
- 24.Tönnis D, Heinecke A. Acetabular and femoral anteversion: relationship with osteoarthritis of the hip. J Bone Joint Surg Am. 1999. December;81(12):1747-70. [DOI] [PubMed] [Google Scholar]
- 25.Chosa E, Tajima N, Nagatsuru Y. Evaluation of acetabular coverage of the femoral head with anteroposterior and false profile radiographs of hip joint. J Orthop Sci. 1997;2(6):378-90. [Google Scholar]
- 26.Ganz R, Leunig M. Morphological variations of residual hip dysplasia in the adult. Hip Int. 2007;17(Suppl 5):S22-8. [PubMed] [Google Scholar]
- 27.Richmond SA, Fukuchi RK, Ezzat A, Schneider K, Schneider G, Emery CA. Are joint injury, sport activity, physical activity, obesity, or occupational activities predictors for osteoarthritis? A systematic review. J Orthop Sports Phys Ther. 2013. August;43(8):515-B19. Epub 2013 Jun 11. [DOI] [PubMed] [Google Scholar]
- 28.Sulsky SI, Carlton L, Bochmann F, Ellegast R, Glitsch U, Hartmann B, Pallapies D, Seidel D, Sun Y. Epidemiological evidence for work load as a risk factor for osteoarthritis of the hip: a systematic review. PLoS One. 2012;7(2):e31521. Epub 2012 Feb 14. [DOI] [PMC free article] [PubMed] [Google Scholar]
- 29.Jackson KA, Glyn-Jones S, Batt ME, Arden NK, Newton JL; Delphi Panel. Assessing risk factors for early hip osteoarthritis in activity-related hip pain: a Delphi study. BMJ Open. 2015. September 29;5(9):e007609. [DOI] [PMC free article] [PubMed] [Google Scholar]
- 30.Zingg PO, Werner CM, Sukthankar A, Zanetti M, Seifert B, Dora C. The anterior center edge angle in Lequesne’s false profile view: interrater correlation, dependence on pelvic tilt and correlation to anterior acetabular coverage in the sagital plane. A cadaver study. Arch Orthop Trauma Surg. 2009. June;129(6):787-91. Epub 2008 Jul 16. [DOI] [PubMed] [Google Scholar]
- 31.Sakai T, Nishii T, Sugamoto K, Yoshikawa H, Sugano N. Is vertical-center-anterior angle equivalent to anterior coverage of the hip? Clin Orthop Relat Res. 2009. November;467(11):2865-71. Epub 2009 Mar 26. [DOI] [PMC free article] [PubMed] [Google Scholar]
- 32.Matheney T, Zaltz I, Kim YJ, Schoenecker P, Millis M, Podeszwa D, Zurakowski D, Beaulé P, Clohisy J; ANCHOR Study Group. Activity level and severity of dysplasia predict age at Bernese periacetabular osteotomy for symptomatic hip dysplasia. J Bone Joint Surg Am. 2016. April 20;98(8):665-71. [DOI] [PubMed] [Google Scholar]
- 33.Cunningham T, Jessel R, Zurakowski D, Millis MB, Kim YJ. Delayed gadolinium-enhanced magnetic resonance imaging of cartilage to predict early failure of Bernese periacetabular osteotomy for hip dysplasia. J Bone Joint Surg Am. 2006. July;88(7):1540-8. [DOI] [PubMed] [Google Scholar]
- 34.Nishii T, Shiomi T, Tanaka H, Yamazaki Y, Murase K, Sugano N. Loaded cartilage T2 mapping in patients with hip dysplasia. Radiology. 2010. September;256(3):955-65. [DOI] [PubMed] [Google Scholar]
Associated Data
This section collects any data citations, data availability statements, or supplementary materials included in this article.