Fig. 5.
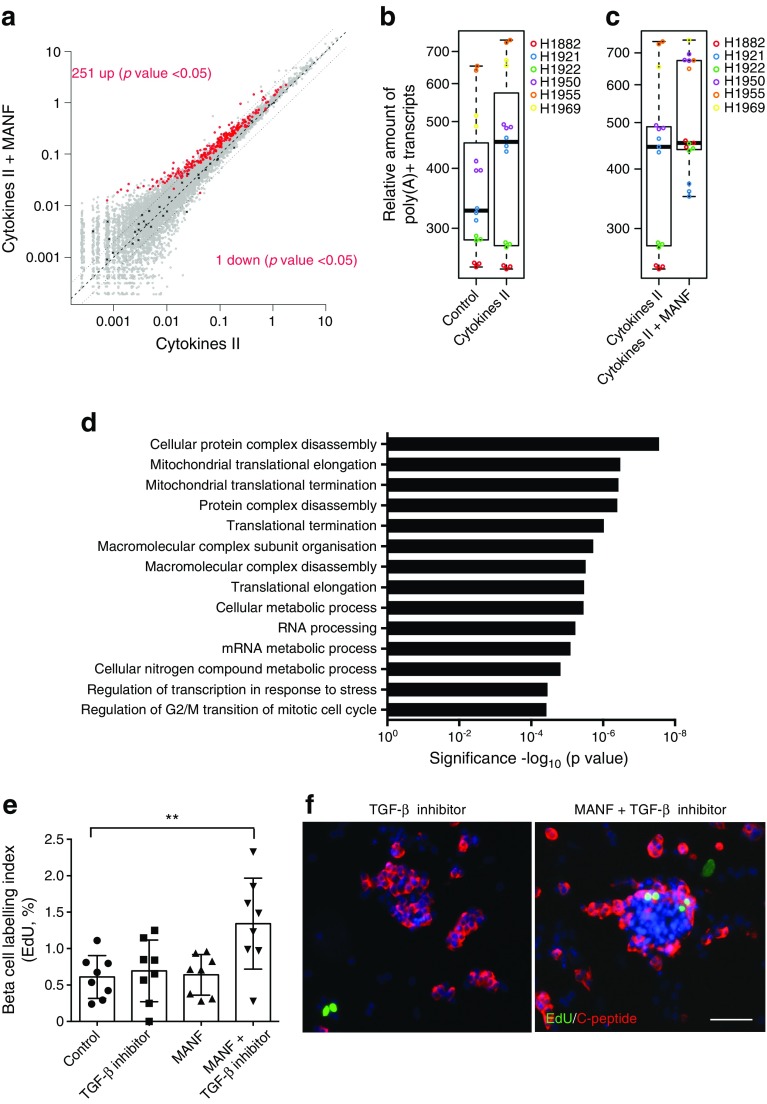
MANF induces a global upregulation of gene expression and induces proliferation of human beta cells with simultaneous TGF-β inhibition. (a) Scatter plot of relative gene expression results based on spike-in normalisation for cytokine cocktail II vs cytokine cocktail II + MANF treatment of human islet cells. The x- and y-axes depict relative expression levels, plotted on a log scale. The central dashed line marks equal gene expression. The two dotted lines mark the ± twofold boundaries. Grey dots represent all the genes detected in the expression profiling experiment. Red dots mark the significantly differentially expressed genes, and black crosses mark the spike-in molecules. (b, c) Tukey box plots showing the relative amount of poly(A)+ transcripts. The thick centre line represents the statistical median. The lower and upper lines of the boxes represent the 1st and 3rd quartiles. The upper and lower whiskers denote the furthest points that are not outliers. (b) Comparison between control and cytokine-treated islets. (c) Comparison between cytokine and cytokine + MANF-treated samples. Individual donors are represented by different colours. (d) GO enrichment analysis of upregulated genes (FDR <0.05) for cytokines + MANF compared with cytokines alone. (e, f) Human islets from eight organ donors were cultured for 96 h with MANF (100 ng/ml), TGF-β inhibitor SB431542 (2 μmol/l) or both. EdU was added to the culture medium at the start of the experiment. (e) Quantification of proliferating beta cells analysed by EdU and C-peptide double-positive cells relative to the total number of C-peptide-positive cells. **p < 0.01 (one-way ANOVA followed by Tukey’s test). (f) Representative C-peptide (red) and EdU (green) double immunofluorescence in islets stimulated by SB431542 or SB431542 + MANF. Scale bar, 50 μm

