

SUMMARY
In this study, we show that evolutionarily conserved chromosome loop anchors bound by CTCF and cohesin are vulnerable to DNA double strand breaks (DSBs) mediated by topoisomerase 2B (TOP2B). Polymorphisms in the genome that redistribute CTCF/cohesin occupancy rewire DNA cleavage sites to novel loop anchors. While transcription- and replication-coupled genomic rearrangements have been well documented, we demonstrate that DSBs formed at loop anchors are largely transcription-, replication-, and cell type- independent. DSBs are continuously formed throughout interphase, are enriched on both sides of strong topological domain borders, and frequently occur at breakpoint clusters commonly translocated in cancer. Thus, loop anchors serve as fragile sites that generate DSBs and chromosomal rearrangements.
eTOC
Chromatin assembly into higher-order structures generates torsional stress that makes chromosome loop anchor regions more vulnerable to Topo2-mediated DNA breaks.
INTRODUCTION
Transcription, replication and DNA compaction generate torsional stress that can entangle DNA unless dissipated by topoisomerases (Pommier et al., 2016). Type I topoisomerases (eg. TOP1) relax DNA by transiently nicking and rejoining one strand of the double helix, whereas type II topoisomerases (eg. TOP2) transiently break and rejoin both strands simultaneously (Pommier et al., 2016). At an unknown frequency, the topoisomerase reaction cycle can fail, resulting in protein-linked complexes that are resolved by the cellular DNA damage response (McKinnon, 2016).
Mammalian TOP2 is present in two related isoforms, TOP2A and TOB2B. TOP2A is almost exclusively expressed in proliferating cells and is needed to support DNA replication, sister chromatid segregation and transcription. In contrast, TOP2B is expressed throughout the cell cycle, but appears to be required to release torsional stress at sites of transcription (Calderwood, 2016). When TOP2-induced DSBs are not faithfully re-ligated, they are susceptible to mutation and genome rearrangements. Indeed, the widely used anti-cancer agent etoposide (ETO), which traps TOP2 in the double-strand cleavage form and thereby prevents ligation, is frequently associated with therapy-related myeloid leukemias (t-AML) following a primary malignancy (Wright and Vaughan, 2014).
Approximately 1/3 of ETO induced t-AML harbor translocations involving the mixed lineage leukemia locus (MLL, Kmt2a) fused to a variety of partner genes (eg. AF9, AF4, and ENL) (Cowell et al., 2012). Translocation breakpoints occur at breakpoint cluster regions (BCRs) within both oncogenic fusion partner genes. These breakpoint hotspots have been associated with nuclear scaffold attachment regions, sites of DNase I hypersensitivity, and CTCF binding (Cowell et al., 2012; Zhang and Rowley, 2006).
It has been suggested that leukemia-associated translocation breakpoints could result from direct TOP2B-mediated DNA cleavage of susceptible regions (Cowell et al., 2012). BCRs tend to cluster within gene bodies, suggesting that in addition to promoters, topoisomerase activity may be needed to relieve positive supercoiling during transcriptional elongation (Pommier et al., 2016). Such a function has been recently ascribed to TOP1 (Baranello et al., 2016). In contrast, TOP2 activity has been reported to be restricted mainly to promoters of active genes (Baranello et al., 2014; Yang et al., 2015). Thus, it remains unclear how ETO, which specifically poisons TOP2, is linked to oncogenic translocation.
While TOP2B-induced breaks are enriched at transcriptional start sites (TSS) proportional to the extent of transcription (Baranello et al., 2014; Yang et al., 2015), only a small fraction of genes are affected in TOP2B knockout embryos (McKinnon, 2016). Recent ChIP-seq analysis indicates that TOP2B binding is not confined to promoters, but is generally associated with open chromatin (Uuskula-Reimand et al., 2016). TOP2B has been shown to physically interact with CTCF and cohesin (Uuskula-Reimand et al., 2016; Witcher and Emerson, 2009), and to be enriched in CTCF/cohesin-bound regions (Madabhushi et al., 2015; Manville et al., 2015; Uuskula-Reimand et al., 2016). Thus, it has been hypothesized that TOP2B may play a role in solving topological constraints associated with chromosome architecture in a tissue- and transcriptional dependent manner (Uuskula-Reimand et al., 2016).
Little is known about the topological strains associated with higher order chromosome organization. Long-range loops between promoters and enhancers are mediated by cohesin (a ring-shaped protein complex consisting of SMC1, SMC3, and RAD21) (Dixon et al., 2016; Rao et al., 2014). In addition, cohesin is thought to act together with the insulator protein CTCF to form domains that isolate enhancers from interacting with inappropriate gene promoters (Dixon et al., 2016). The mechanism underlying these structures is unknown. One proposal is that cohesin is the central component in an extrusion complex comprising two tethered subunits which bind DNA at adjacent positions and slide in opposite directions until they encounter an inward-pointing CTCF motif (Fudenberg et al., 2016; Nichols and Corces, 2015; Sanborn et al., 2015). The rapid traversal of such a motor across hundreds of kilobases of chromatin may generate significant torsional stress (Dixon et al., 2016), whose dissipation would facilitate the maintenance of chromosome architecture.
Here we show that TOP2B generates DSBs continuously throughout interphase within promoters, genes and intergenic regions. Unlike TOP1, TOP2B enzymatic activity is largely transcription independent. Instead, DSB formation is concentrated at loop anchors. The probability of DSB formation is directly proportional to TOP2B binding, is preserved across different cell types, and can be predicted based on CTCF and RAD21 occupancy at chromosomal loop anchors. These loop anchors are associated with translocation BCRs dysregulated in various cancers. We propose that in addition to transcription and replication, which drive cell type- and tumor-specific chromosomal translocations, chromatin loop anchors may pose a threat to genome integrity.
RESULTS
DSBs at Break Point Cluster Regions in Acute Leukemias and Prostate Cancer
While MLL (Kmt2a) and its translocation partners are expressed in a variety of tissues, MLL fusion proteins can induce AMLs only from hematopoetic cells or progenitor subsets (Krivtsov et al., 2013). To determine whether these fusions are linked to endogenous TOP2 cleavage sites, we measured the repertoire of ETO induced DNA breaks in multiple cell types by END-seq, a method which maps DSBs genome wide at nucleotide resolution (Canela et al., 2016). We initially examined the effect of ETO treatment on purified primary B cells derived from mouse spleen. B cells were activated for 12 hours with LPS/IL4, which induced robust transcriptional activity without significant DNA replication (Figure S1A), prior to ETO treatment (50 µM for 30 min). ETO induced a small broad DSB peak in MLL near exon 10 and a larger sharp peak at exon 12, both sites overlapping with the highly conserved breakpoint cluster region (BCR) (Figure 1A). A previous study revealed that the translocation breakpoint in exon 12 of human MLL co-localized with DNase I hypersensitive sites associated with CTCF occupancy (Cowell et al., 2012). Consistent with this, both break peaks overlapped with binding sites of CTCF (Figure 1A). These sites were also occupied with TOP2B, the major TOP2 isoform present in G1 cells (See Figure 2D). The finding that mature B cells harbor site specific cleavage within MLL demonstrate that DSBs in the BCR can occur outside the window of early stem cell differentiation.
Figure 1. Genome-wide mapping of ETO induced DSBs.

(A) From top to bottom: END-seq DSBs profiles of normalized read densities without treatment and upon ETO treatment (50µM, 30 minutes) in activated B-cells; TOP2B and CTCF occupancy measured by ChIP-seq in activated B-cells (without ETO treatment). Exons are shown as numbered blue squares, BCR is represented as a black rectangle and was calculated by lift-over of human BCRs. Arrow represents direction of transcription. (B) Estimated frequency of cells carrying a specific DSB, calculated by comparison with the frequency of a zinc finger nuclease break present only in spike-in cells that were mixed with sample cells at 1:100 dilution. Oncogenic BCRs are highlighted in red (ETO treatment) and in blue (without treatment). Continuous and dashed lines represent ETO treatment and no treatment respectively. Quantification was done using END-seq peak coordinates (n=25,512). (C) Spontaneous DSBs at oncogenic driver ABL1 at the same position (arrow) as upon ETO treatment (track below); TOP2B and CTCF occupancy are shown below.
Figure 2. ETO induced DSBs are dependent on TOP2B.

(A) Western blot analysis of TOP2B and TOP2A expression in WT and TOP2B−/− MEFs. (B) Example of TOP2B dependency of ETO DSBs in a site located at chr10. From top to bottom, DSBs profile upon ETO treatment, TOP2B and TOP2A occupancy measured by ChIP-seq in WT and TOP2B−/− MEFs, and CTCF occupancy in WT MEFs. (C) Heat-map of DSB coverage, and TOP2B and TOP2A binding (from left to right) in WT and TOP2B−/− MEFs, sorted by cleavage density in WT MEFs (1,000 top most broken sites). Breaks and binding are measured with respect to the center of the CTCF binding motif (−150bp to +50bp for breaks, and −1kb to +1kb for binding, summing up 50bp non-overlapping windows; WT vs TOP2B−/− DSB intensity; paired-T test, p<1×10⁻¹⁵). (D) Western blot analysis of TOP2B and TOP2A expression in 12 hour- (G1 cells) and 24 hour- (dividing cells) stimulated B cells. (E) MLL BCR showing DSBs profile upon ETO treatment (50µM, 30 minutes) and TOP2B and TOP2A occupancy in 12- and 24- hour stimulated B cells. Bottom track shows CTCF occupancy in 12 hour stimulated B cells. ChIP-seq was performed without ETO treatment. (F) Heat-map of DSB coverage, and TOP2B and TOP2A (from left to right) binding in 12- and 24- hour stimulated B cells, sorted by cleavage density in 12 hour stimulated B cells (1,000 top most broken sites). Breaks and binding are measured with respect to the center of the CTCF binding motif (−150bp to +50bp for breaks and −1kb to +1kb for binding).
The most common MLL fusion partners AF4 (AFF1), AF9 (MLLT3) and ENL(MLLT1) also harbored ETO induced DSBs co-localizing with CTCF/TOP2B binding within their respective BCRs (Figure 1A). In addition to MLL translocations, NUP98 translocations in pediatric AML patients are not uncommon, and are reproducibly associated with t-AML after ETO treatment (Gough et al., 2011). NUP98 rearrangements cluster near exon 12 (Gough et al., 2011), within which we detected a CTCF/TOP2B binding site and a prominent DSB peak in primary B cells (Figure 1A).
TOP2B has been implicated in the genesis of the common TMPRSS2-partner translocation, which occurs in 50% of prostate cancers (Haffner et al., 2010). It is believed that TMPRSS2 fusions are restricted to prostate cancer because of the dependence of the prostate tissue on androgen-induced transcription. Even though TMPRSS2 is not expressed in B cells (Figure S1B), ETO induced DSBs occur within the common BCR of TMPRSS2, precisely at sites at which CTCF/TOP2B were co-bound (Figure 1A). DNA breaks at MLL and TMPRSS2 were also observed in human breast cancer and human pre-B cell lines at CTCF bound sites (Figure S1C). Thus, DNA breaks at many common BCRs arise as a direct result of exposure to ETO.
Frequency of Spontaneous and ETO-induce DSBs Genome Wide
We next estimated the frequency of cells harboring DNA breaks at individual sites across the genome (Figure 1B). To this end, we mixed 15 million splenic B cells treated with ETO with 150,000 pre-B cells carrying a doxocycline inducible zinc finger nuclease targeting the T cell receptor (TCRβ) locus (Canela et al., 2016). Assuming 100% efficiency in introducing DSBs (Canela et al., 2016), we normalized each ETO induced break by the TCRβ locus DSB intensity. From this, we estimated that DSBs at the BCRs of MLL, AF4, AF9, and ENL occurred in ~0.8–1.6% of cells (Figure 1B). DSBs at the oncogenic driver ABL1, which is translocated in chronic myelogenous leukemia, as well as other hotspots (eg. Nkx2-2) occurred at an even higher frequency (Figures 1B–C and 3A).
Figure 3. TOP2B activity is largely transcription independent.

(A) Example of a DSB hotspot within exon 1 of Nkx2-2, a gene that is not transcribed in B cells. From top to bottom: DSB profile upon ETO treatment, nascent RNA-seq, and CTCF and RAD21 occupancy. The neighboring gene Xrn2 is actively transcribed but minimally broken. (B) 12 hour activated B cells were assessed for nascent RNA synthesis (red, pulse labeled with EU for 30 minutes) and γ–H2AX induction (green) with or without pre-incubation with the transcriptional inhibitor DRB (150 uM for 90 minutes). Cells were left untreated or treated with ETO (50 uM for 30 minutes) during the EU pulse. Right panel: Quantification of the γ–H2AX and EU-RNA nuclear signal intensity (mean for γ–H2AX: ETO 73.27, DRB+ETO 64.93, p<0.0001 Mann Whitney test; mean for EU-RNA: ETO 25.99, DRB+ETO 7.59, p<0.0001 Mann Whitney test). Number of nuclei (n) indicated on the top. Scale bar in white is 50 µm. (C) ETO-induced DSBs levels quantified by END-seq with (y-axis) or without (x-axis) DRB pre-incubation. DSBs sites are either insensitive to DRB (black), or decrease greater than 2-fold (light red) or 3- fold (dark red) upon DRB pre-incubation. DSB sites (shown in blue) overlap with CTCF binding. The internal graph compares the overlap with CTCF for each DRB sensitive category (Fisher’s exact test, p<5×10⁻⁵). (D) Example of two ETO DSB sites insensitive to transcriptional inhibition, the BCR of MLL (left panel) and intron 1 of Rapgap1l on the right. Top to bottom: Nascent RNA-seq and DSBs profiles upon ETO treatment with or without DRB pre-treatment.
We noticed that several of the regions exhibiting high-level DNA breakage upon ETO exposure also showed spontaneous DNA damage in the absence of treatment (Figures 1B and C). Although the frequency of breakage per cell was significantly lower (paired T-test, p<10−15), and there were fewer spontaneous DSBs (Figure S1D), 61% of the endogenous lesions overlapped with ETO induced DSBs (Figure S1D). The similar localization of spontaneous- and ETO-induced DSBs might explain why translocations in t-AML and de-novo AML frequently occur within the same BCR (Gough et al., 2011; Zhang and Rowley, 2006).
TOP2B is Required for ETO Induced DSBs
Since ETO induced DSBs co-localized with TOP2B occupancy, we wanted to determine whether TOP2B was required for producing these breaks. Mice lacking TOP2B exhibit perinatal lethality (McKinnon, 2016; Yang et al., 2000), and therefore we generated primary WT and TOP2B−/− mouse embryonic fibroblasts (MEFs) (Figure 2A). ETO induced robust cleavage in WT MEFs, whereas DSBs were reduced in TOP2B−/− MEFs (Figures 2B and 2C, paired T-test, p<1× 10⁻¹⁵). Relative to the core consensus CTCF binding site, DSBs accumulated approximately 50 nucleotides from the center of the motif, indicating that TOP2B activity is sharply focused on the boundaries of CTCF binding sites (Figure 2C; see also Figure 4G below) (Uuskula-Reimand et al., 2016).
Figure 4. DSBs at loop boundaries.

(A) DSBs upon ETO treatment localize to binding sites of CTCF and cohesin at the borders of chromatin loop interactions measured by PolII ChIA-PET. From top to bottom: DSBs profiles upon ETO treatment, RAD21, CTCF and H3K27Ac occupancy by ChIP-seq. PolII ChIA-PET (bottom) reveals multiple RNA polymerase II -mediated loop interactions between the promoter of Scd2 and its upstream enhancers (number of lines proportional to interaction strength). Loop borders show overlap with ETO DSBs, RAD21, CTCF and H3K27Ac. (B) Comparison of the fraction of PolII-mediated loop- borders between promoters or enhancers containing at least one DSB and corresponding sites that are negative for DSBs (Fisher’s exact test, p<1×10−187 for both). (C) Venn diagram shows the overlap between ETO-induced DSBs and CTCF binding in 12 hour activated B cells (Left); the overlap between ETO-induced DSBs with the co-binding of CTCF and RAD21 (green, middle), and the overlap between ETO induced DSBs with CTCF, RAD21 and TOP2B (blue, right). (D) Comparison of the enrichment for DSBs with incremental co-binding (CTCF, CTCF/RAD21 and CTCF/RAD21/TOP2B relative to randomly located regions with identical size. Enrichment of DSBs for ATAC-seq positive sites is shown for comparison. (E) Conservation of DSBs (black) co-bound by CTCF, RAD21 and TOP2B in activated B-cells among different cell types (pre-B cell line, T cells, neurons and MEFs) as measured by END-seq. Conservation in H3K27Ac between activated B-cells and each cell type is shown (gray) as a comparison. H3K27Ac peak subsets were picked to have the same number of peaks and size distribution as their corresponding DSBs peak sets. Inset compares DSB levels in activated B cells that are shared to different degrees among unstimulated B cells, pre-B cells, T cells, neurons and MEFs (Two-sided t-test, p<1×10−130). (F) MLL BCR showing ETO-induced DSBs (left) and CTCF binding (right) conservation between different cell types. (G) Left panel: aggregate plot of ETO-induced DSBs (solid black) and CTCF binding (orange) +/− 500 bp from the CTCF motif (dashed line). Right panel: MNase-seq signal (purple) superimposed on the DSB profile.
The residual DSB activity in TOP2B−/− cells could reflect the redundant activity of TOP2A, which is expressed in proliferating MEFs (Figure 2A). Consistent with this, we found that TOP2A largely co-localized with TOP2B in WT MEFs (Figure 2C), and exhibited a similar distribution in TOP2B−/− MEFs as measured by ChIP-seq (Figure 2C). Likewise, the genome occupancy of TOP2B in interphase B cells (12 hour stimulated) in which TOP2A levels are severely reduced (Figures 2D–F), largely coincided with TOP2B and TOP2A binding in dividing (24 hour stimulated) B cells in which both isoforms are present (Figures 2D–F and S1A). In both conditions, TOP2 activity focused near CTCF sites, although in replicating cells the levels of ETO-induced DSBs relative to background appeared lower (Figures 2E and 2F). This could be because TOP2B and TOP2A also associate with newly synthesized DNA at the replication fork (Dungrawala et al., 2015), which maybe important to remove topological links between replicated chromatids prior to anaphase.
TOP2B Activity is Independent of Transcription
Given that TMPRSS2 as well as other highly broken genes (Figures 1A–B, S1B and 3A) are not expressed in B cells, we wondered whether transcription was a prerequisite for TOP2B activity. We found that transcript levels measured by nascent RNA sequencing did not correlate with DSB frequency in activated B cells (Figure S2A). Relative to activated B cells, resting B cells show a global decrease in transcription (Figure S1A) (Kouzine et al., 2013), but these changes in transcription did not have a major effect on DNA breakage (Figure S2B). Indeed, DSBs were found at translocation BCRs in both resting and activated B cells (Figure S2C). Overall, 70% of the TOP2B induced breakage sites were conserved between resting and activated B cells (Figure S2D), and the frequency of DNA breakage at these common sites was similar (Figure S2E; median activated/resting ratio=1.06).
To further understand the relationship between TOP2B activity and transcription, we blocked transcription initiation (with triptolide) or elongation (with 5,6-Dichloro-1-beta-D-ribofuranosylbenzimidazole (DRB)) prior to ETO treatment (Figures S2F and 3B). Despite a decrease in nascent RNA synthesis in samples treated with either triptolide or DRB, there were only small changes in γ-H2AX induction upon ETO treatment (Figures 3B and S2F). Thus, even in the absence of transcriptional activity, there is a robust cellular DSB response.
To directly monitor DNA breakage genome wide under transcriptionally active vs. inactive conditions, we performed END-seq. We observed that fewer than 5% of the breaks decreased in intensity by greater than 2-fold in DRB- or triptolide-treated samples (Figures 3C and S2G). Rather, breakage at over 95% of regions, including the BCR of MLL and other hotspots (Figure 3D), was insensitive to transcription inhibition. Moreover, DRB- and triptolide-insensitive sites showed a higher frequency of colocalization with CTCF relative to sensitive sites (Figures 3C and S2G). Thus, in contrast to TOP1 enzymatic activity, which depends on ongoing transcription (Katyal et al., 2014; Sordet et al., 2009), TOP2B cleavage is largely independent of transcription.
TOP2B Activity at Promoter and Enhancers
Most of the 25,512 END-seq positive peaks (69%) overlapped with CTCF occupancy measured by ChIP-seq in activated B cells, while less than one half of the 48,996 CTCF peaks (42%) overlapped with DSBs (Figure S3A; Fisher’s exact test, p<1×10⁻¹⁵ compared to random accessible regions). We observed that DSBs detected upon ETO were more similar in GC content to randomly picked accessible regions relative to CTCF sites, indicating that the strong overlap with CTCF is not influenced by GC bias (Figure S3A). 29% of the DSBs were localized within 1 kb of transcription start sites (TSS) (Figure S3B), suggesting that TOB2B activity, while being largely independent of transcription (Figure 3), might nevertheless function upstream of it.
Among the TSS carrying DSBs, 90% were associated with active promoters (H3K4me3+), and 53% of genic/intergenic regions showed enrichment of DNA breaks at active enhancers (H3K27ac+; Figure S3B). Relative to active promoters or enhancers that did not harbor DSBs, there was an enrichment of enhancer-promoter loops at DSB sites, as measured by RNA PolII interaction analysis (ChIA-PET) (Figures 4A and 4B; (Fisher’s exact test, p<5×10−324 for both)) (Kieffer-Kwon et al., 2013). DSBs tended to flank PolII-mediated loop boundaries, and to occur preferentially on both sides of the loop boundaries (Figures 4A and S3C (Fisher’s exact test, p<1×10−37)). Broken promoters and enhancers were also enriched for binding of CTCF and cohesin (Figures 4A and S3D; Fisher’s exact test, p<1×10−120), which engage in DNA-looping interactions (Dixon et al., 2016). These results are consistent with the notion that TOP2B is necessary to resolve topological stress, thereby stimulating promoter-enhancer looping that initiates transcription (Bunch et al., 2015; Ju et al., 2006; Madabhushi et al., 2015). Given that DSBs were found in approximately 54% of active promoters (Figure S3E), we suggest that TOP2B activity might also contribute to the marked preference for translocations at TSSs (Chiarle et al., 2011).
DSBs Localize to Loop Anchors
Chromosomes are thought to be organized into hierarchical loop structures, ranging from promoter-enhancer contacts to larger topological domains (Dixon et al., 2016). Long distance loops establish domains, provide insulation from neighboring domains, and are frequently anchored by a pair of convergent CTCF binding motifs (“loop anchors”) that recruit both CTCF and cohesin subunits (Rao et al., 2014). Given the strong colocalization of DSBs and CTCF binding, and the association of DSBs with promoter-enhancer loops (Figure 4A), we wanted to see if DSBs are generally associated with loop anchors. Relative to sites occupied by CTCF alone, those regions that were also bound by RAD21 and TOP2B were more likely to form DSBs (Figures 4C and 4D). These included the translocation BCRs (Figures 1A and S3F) and other hotspots (Figure 3A). Overall, sites that were co-occupied by both CTCF and RAD21 were 48-fold enriched in DSBs relative to a similar number of randomly located regions. This effect was even stronger when TOPB was present (62-fold enrichment) (Figure 4D).
DSB sites also tended to be conserved amongst different cell types and lineages. Overall, 30%–80% of the ETO-induced DSBs found in activated B cells were preserved in MEFs, neurons, activated T cells, and pre-B cell lines (Figure 4E). For example, all these cell types harbored the same DSB sites within the BCR of MLL, which co-localized with CTCF occupancy (Figure 4F). The levels of overlap in DSB sites was higher than the overlap expected by the similarity in chromatin state (indicated by H3K27ac) (p<1×10⁻⁶) (Figure 4E). Moreover, those DSBs that were common amongst cell types exhibited higher peak intensities than DSBs that were unique, indicating that conserved sites were also more frequent (Figure 4E, inset, p<1×10−130 for both). Global analyses of RNA levels measured in resting B cells, activated B cells or activated T cells indicated that RNA synthesis did not correlate with DNA breakage (Figures S2A and S3G).
ChIP-exonuclease mapping revealed that TOP2B/CTCF/cohesin- bound sites flanked the boundaries of topologically associated domains (Uuskula-Reimand et al., 2016). An aggregate plot of ETO-induced DSB sites relative to the center of the G-rich oriented CTCF binding motif revealed a major END-seq peak at a mean distance of 45 nucleotides 5’ of the motif (Figure 4G, left panel), consistent with our finding in MEFs (Figure 2C). This was true both for promoter-associated DSBs as well as non-TSS associated DSBs (Figure S3H). Thus, the major DSB peak localizes to a position adjacent to the CTCF loop anchor, just outside the loop.
In addition, we observed periodic “shadow” DSBs emanating from the major peak (Figure 4G). CTCF binding generates an array of strongly positioned nucleosomes surrounding its binding sites (Fu et al., 2008). We found that the periodic DSB peaks were the least protected from micrococcal nuclease digestion, indicating that DSBs occurred within nucleosome free regions surrounding CTCF binding sites (Figure 4G, right panel). Nucleosome occupancy was asymmetric, with the most accessibly region present just outside of the loop, coinciding with the major DSB peak (Figure 4G, right panel). In conclusion, TOP2B activity spreads to nucleosome free regions surrounding its major break site outside of loop anchors.
TOP2B associated DSBs are predictive of loop anchor positions
To study the relationship between DNA breakage at CTCF/cohesin bound sites and chromosome architecture, we generated high resolution in situ Hi-C DNA chromosome contact maps in activated B cells (Rao et al., 2014). When we compared the position of the loop anchors derived from Hi-C maps with ETO-induced DSBs measured by END-seq, it became apparent that DSBs within translocation BCRs were associated with loop anchors (Figures 5A–B and S4). Overall, the level of overlap between Hi-C defined loop anchors and DSBs was greater than the overlap between loop anchors and CTCF/RAD21 co-occupancy (Figure 5C, Hypergeometric test, p<1×10⁻¹⁵). In addition to TOP2B activity at loop anchors, low-level DSBs, which tended to colocalize with internal CTCF/RAD21 binding sites, were also detected within loop domains (Figures 5A and 5B; Figure S4).
Figure 5. Loop anchor location and strength are associated with DSBs.

(A) Top to bottom: DSBs profiles upon ETO treatment, CTCF and RAD21 occupancy measured by ChIP-seq; RNA synthesis by GRO-seq; and Hi-C contact matrices (position chr4:107,602,396–107,997,395, mm10) showing a loop near the Lrp8 gene. DSBs colocalize to loop anchor positions (dashed lines). (B) Oncogenic breakpoint cluster region (BCR) within the MLL translocation partner AF9 overlaps with loop anchor position, CTCF/cohesin binding and DSBs (See also Figure S4). From top to bottom: DSBs profiles upon ETO treatment, CTCF and Rad21 occupancy measured by ChIP-seq; and Hi-C contact matrices for chr4 (positions 87,052,046 to 88,637,448, mm10), which reveals multiple chromatin loop interactions (resolution 5kb). G-rich and C-rich orientation of the CTCF motifs, are shown as blue, respectively. BCR position is indicated in red. (C) Overlap between loop anchors and DSBs. Loop anchors were defined as regions within 5kb from the Hi-C loop boundary (see Methods) with CTCF and RAD21 co-binding. Loop anchor regions, identified by Hi-C, were considered overlapping with DSBs if intersecting with at least one END-seq peak. The level of overlap between loop anchors and DSBs was greater than the overlap between loop anchors and randomly generated CTCF/RAD21 double peaks (Hypergeometric test, p<1×10⁻¹⁵). (D) Aggregate peak analysis (APA) plots display the average Hi-C signal at anchor loop positions (RAD21+) that are either associated or not with DSBs. Left panel, whisker plot representation of the normalized signal between anchor loops associated or not with DSBs (two-sided t-test, p<1×10⁻²⁵); right panel, aggregate signal at loop anchor positions. Aggregate peak signal shown in red indicates that DSB-associated anchors have stronger loop interactions. (E) Percentage of loop borders positive for DSBs that either have DSBs on both sides (see for example Figure 5A) or only on one side (observed), compared to randomly paired anchors (expected) (Fisher’s exact test, p<1×10−133). Left and right panels quantify ETO-induced and spontaneous breaks respectively.
CTCF-CTCF loops vary in the extent to which they stabilize enhancer-promoter interaction domains (Dixon et al., 2016). We calculated the chromatin-looping interaction strengths at CTCF-anchored loops (Rao et al., 2014), and found that those loops that harbored DSBs (TOP2B+DSB+) had significantly increased interactions relative to loops that did not have DSBs (TOP2B−DSB−) (Figure 5D, T-test, p=1×10⁻²⁵). Thus, stronger loop boundaries are more likely to harbor DNA breaks.
Topological stress is distributed on both sides of loop anchor boundaries
Among those anchors positions that were END-seq+ in ETO treated cells, 63% carried DSBs on both sides of the CTCF loop boundary element (Figures 5A, 5B and 5E), suggesting that topological stress tends to occur on both sides of a loop anchor. Similarly, among spontaneous breaks (Figure S1D), 20% (1063) overlapped with loop anchors, and 24% (259) of these harbored DSBs on both side of the loop anchors (Figure 5E; Fisher’s exact test, p<1×10⁻²⁵). Thus, while ETO generates an increased risk of breakage at loop anchors, the conditions for generating large interstitial deletions or insertions at boundary elements appear to exist even without treatment.
Polymorphisms in CTCF/Cohesin binding rewire DSBs to novel sites
To directly determine the effects of CTCF/Cohesin binding on TOP2B activity, we examined the repertoire of DNA breaks in activated B cells from Mus musculus (C57BL/6) and Mus spretus (Spretus), which exhibit approximately 5000 single nucleotide variants within CTCF DNA binding motifs (Nakahashi et al., 2013). Consistent with this, there were many regions with clear differences in CTCF/RAD21 binding affinity including approximately 10% of sites that were unique to each species (Figure 6A). Analysis of ETO induced damage revealed that DSBs followed CTCF/RAD21 binding; that is, sites bound by CTCF/RAD21 in C57BL/6 but not in Spretus were more likely to harbor DSBs in C57BL/6 compared to Spretus (and visa-versa) (Figures 6A–D). Among the CTCF/RAD21 binding sites that were conserved, DSBs were generally present in both species (Figures 6A and 6B; Chi-square test, p<1×10⁻²⁰).
Figure 6. Polymorphisms in CTCF/Cohesin alter DSB position and frequency.

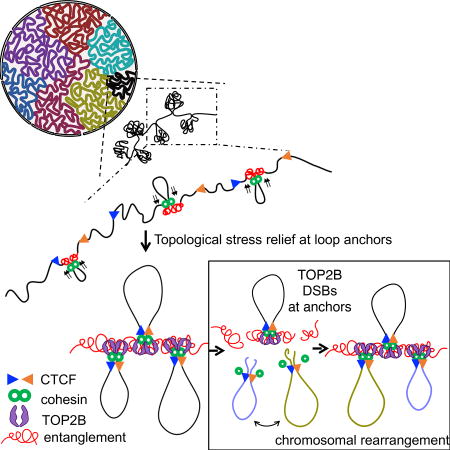
(A) Left panel, Venn diagram of CTCF+RAD21+ sites of Mus spretus (Spretus) and Mus musculus (C57BL/6) in activated B-cells. Right panel, comparison of the fraction of sites that break between shared, C57BL/6 and Spretus CTCF+RAD21+ sites (Chi-square test for independence, p<1×10⁻²⁰). (B–D) Examples of DSB sites that are shared or exclusive between Spretus and C57BL/6. DSB profiles upon ETO treatment and CTCF/RAD21 occupancy measured by ChIP-seq for each species is shown. (E) Ratio of DSB levels and RAD21 occupancy between C57BL/6 and Spretus at shared CTCF+RAD21+ binding sites are compared (Spearman correlation, ρ=0.56; p<1e-15). (F) Comparison between integrated NIPBL binding within the loops (defined by Hi-C) and DSBs located at corresponding loop anchors (Spearman correlation, ρ=0.54; p<1×10⁻¹⁵), as illustrated below. (G) Extruding cohesin rings (green) load (black arrow) and travel through the chromatin fiber until they are trapped by a pair of adjacent CTCF proteins positioned in a convergent orientation (blue and red triangles). As the extrusion complex advances, entanglements or knots build up ahead of the motor. TOP2B (purple) maybe necessary to relieve accumulated topological stress to promote loop formation. DSBs also have the potential to drive mutation and chromosomal rearrangements that promote cancer.
Since DSB positions are a function of CTCF/Cohesin occupancy (Figure 6A–D), we wished to determine whether their binding strength could be used to predict DSB frequency. To determine which parameter(s) correlate with DNA breakage, we compared the levels of ChIP-seq for TOP2B, CTCF, RAD21 vs. DSB signal intensity (Figure S5A). We also considered chromatin features H3K27ac and ATAC-seq, since DSBs were generally located within open chromatin (Figure 4G, right panel). TOP2B recruitment was highly correlated with DSB intensity (Figure S5A, ρ=0.69), indicating that unlike TOP1 (Baranello et al., 2016), TOP2B binding is foretelling of its activity. Interestingly, the most predictive parameter for DNA breakage was RAD21 occupancy (ρ=0.7), which also correlated with TOP2B binding (Figures S5A and S5B). Consistently, the ratio of RAD21 binding in C57BL/6 vs. Spretus correlated with the ratio of breakage at shared sites (Figure 6E). Based on these findings, we generated a linear regression model to predict breakage frequency. We found that the levels of RAD21 alone were sufficient to predict DSB intensity (Figure S5C). Moreover, breakage frequencies in activated B vs. T cells correlated better with cell type specific differences in RAD21 occupancy than differences in transcription (Figure S5D). Thus, RAD21 is a major determinant of both the location and frequency of DSBs, which in turn correlates with TOP2B binding.
Density of cohesin loading within loop domains correlates with DSBs at loop boundaries
The (SCC2/SCC4) complex (also referred to as NIPBL/MAU2) loads cohesin, with its ring-like structure, onto chromatin. According to the loop extrusion model (Fudenberg et al., 2016; Nichols and Corces, 2015; Sanborn et al., 2015), one or more cohesins are loaded in this fashion at adjacent DNA loci as part of an extrusion complex, where they initially entrap a small loop, and subsequently track in a processive manner through the chromatin fiber, leading the loop to be enlarged. Because NIPBL provides the entry point for cohesin loading, loops with more extensive NIPBL binding would result in a greater probability of cohesin reaching the boundary, which in turn should carry higher levels of DNA breakage (Figures 6E). Indeed, we found that the density of cohesin loading sites measured inside of Hi-C loops by NIPBL occupancy correlated with DNA breakage on the loops boundaries (Figure 6F). This supports the idea that distal CTCF sites interact through progressive cohesin-mediated loop enlargement.
DISCUSSION
The integrity of the mammalian genome is constantly challenged by processes which alter DNA topology. For example, replication and transcription have the potential to generate chromosome instability (Barlow et al., 2013; Chiarle et al., 2011). One explanation is that tissue specific transcriptional or replication stress drives the rearrangement and expression of oncogenes in various cancers (Tubbs and Nussenzweig, 2017). Here we have found that several cancer translocation clusters are susceptible to DNA breakage in a transcription- and replication- independent manner across various cell lineages.
Loop Anchors and Chromosome Rearrangements
DSBs localize both to promoter-enhancer anchors and to the boundaries of loop domains. Based on the early observation that leukemia BCRs frequently associate with conserved “scaffold attachment regions,” which were thought to demarcate the boundaries of chromatin domains, Rowley and colleagues speculated that BCRs are “evolutionarily conserved regions essential for transcription, replication, condensation and apoptosis (Zhang and Rowley, 2006).” This is indeed compatible with our identification of BCRs as CTCF loop anchor elements that are fragile sites for DNA breakage. Since TOP2B is generally active on both sides of a CTCF loop boundary, TOP2B could also be responsible for deletions or insertions that disrupt boundary elements.
We speculate that TOP2B breakage at conserved loop anchor positions could promote common rearrangements in various cell types. Although recurrent chromosomal translocations are influenced by proximity between translocating genes (Meaburn et al., 2007; Zhang et al., 2012), high frequency DSBs such as those observed at BCRs dominate the translocation pattern (Hakim et al., 2012; Zhang et al., 2012). In the case of MLL translocations, transformation is thought to occur by the ability of the fusion protein to block stem cell differentiation and promote aberrant self-renewal (Aplan, 2006). We suspect that the same fusion, if formed in other cell types (e.g., mature lymphocytes, neurons or fibroblasts) would not confer a selected growth advantage, likely due to its inability to drive inappropriate expression of developmental genes in that cell type. Thus, oncogenic rearrangements might be more promiscuous than documented, while permissiveness to drive cancer development could involve cell-type specific selection processes.
Hi-C maps derived from cells of different species have shown that the integrity of loop domains are largely preserved during evolution (Rao et al., 2014; Schmidt et al., 2012). Nevertheless, rearrangements at the border between two consecutive chromosome domains have been observed. For example, a comparison between Hi-C maps of orthologous mouse and dog genomes revealed several insertions or deletions in one or the other species between two neighboring CTCF/cohesin anchored loops (Vietri Rudan et al., 2015). These rearrangements are consistent with the presence of DSBs precisely at the loop anchors. Interestingly, our data suggest that TOP2B is active at some of these documented deletions/insertions (Figure S5E), suggesting that it might contribute to evolutionary dynamics.
DNA Breaks During Chromosome Loop Extrusion
Loop extrusion has been implicated in the formation of unknotted loop domains during interphase and in facilitating chromosome segregation and condensation (Alipour and Marko, 2012; Goloborodko et al., 2016; Nasmyth, 2001; Nichols and Corces, 2015; Sanborn et al., 2015). As chromatin is fed through the extrusion complex and loops are enlarged, already entangled (or loosely knotted) DNA segments would be expected to be further torsionally constrained (ie. converted to tighter knots) ahead of the motor driving extrusion (Figure 6G). Whereas a loose knot may be compatible with cellular processes such as transcription, sufficiently tight knots would require resolution by TOP2B. Although DSBs are prominent at loop anchors, we also detect low level DSBs coinciding with CTCF/cohesin binding inside of loop domains (Figures 5A, B and Figure S4). It has been proposed that such internal CTCF sites are pausing sites for cohesin during loop enlargement (Haarhuis et al., 2017). Thus, TOP2 activity may be needed to clear up intertwined DNA that builds up as loops are assembled, with DSBs generated at sites of pausing or arrest. Dissecting the exact role of TOP2 during the establishment or maintenance of chromosome contacts is an important problem but may be challenging since TOP2B and TOP2A are essential for viability and potentially redundant (Figure 2).
Although TOP2 is active at DNA sites that are nucleosome-free (Figure 4G), it is unclear how TOP2 is recruited to unlink tangled DNA. Given that TOP2B physically interacts with CTCF and cohesin (Uuskula-Reimand et al., 2016; Witcher and Emerson, 2009), and that its activity is closely linked to cohesin binding (Figure 6E), we propose that TOP2 may travel together with the extrusion complex (Figure 6G). Once CTCF arrests the translocation of the cohesin ring, nucleosomes become well positioned (Fu et al., 2008), increasing the accessibility of linker DNA to TOP2 (Figure 4G). The TOP2-DNA crystal structure suggests that TOP2 preferentially associates with bent DNA (Dong and Berger, 2007). Interestingly, it has been shown that CTCF sharply bends DNA uni-directionally (MacPherson and Sadowski, 2010), which might also enhance TOP2 cleavage activity and orientate it relative to CTCF (Figure 4G). Finally, CTCF binding is reported to demarcate boundaries of supercoiling domains (Naughton et al., 2013), which could be a substrate for TOP2. Thus, TOP2 may be targeted to entangled or supercoiled DNA segments through association with CTCF and cohesin. Our finding that at a given time, only a fraction of cells exhibit TOP2B activity at a specific CTCF/cohesin loop anchor site (Figures 1B and 5C) supports the view that folding during interphase is a dynamic process (Dixon et al., 2016; Rao et al., 2014). In summary, our results suggest that DNA extrusion and topological stress relief go hand in hand.
Implications for Cancer
Since single nucleotide polymorphisms at CTCF/cohesin anchors alter the frequency of TOP2B induced DSBs (Figures 6A–D), which could impact cancer predisposition as well as chemotherapeutic responses. Recent sequencing of AMLs revealed frequent mutations in genes encoding members of the cohesin complex (Fisher et al., 2017). If such mutations were to lessen cohesin binding at a leukemia BCRs, we predict that they would decrease TOP2B dependent DNA breakage and translocation. It would follow that cohesin mutation and MLL translocations would be antagonistic. Analyses of The Cancer Genome Atlas (TCGA) suggest that these mutations might indeed be mutually exclusive (Figure S6). Polymorphisms in CTCF/cohesin could also explain why only a fraction of cancer patients treated with ETO eventually succumb to therapy associated secondary cancers. Thus, alterations in TOP2B activity could lead to variation in spontaneous or therapy induced translocation.
Evolutionarily conserved anchors for the looping machinery are frequently mutated during cancer development (Katainen et al., 2015). Our study indicates that in multiple cell types these anchors are subject to DSBs, which could thereby be a source of genome instability. These observations provide a mechanism by which the pre-existing three-dimensional folding of chromosomes could be co-opted in cancer.
STAR*METHODS
CONTACT FOR REAGENT AND RESOURCE SHARING
Further information and request for resources and reagents should be directed to the Lead Contact, Andre Nussenzweig (andre_nussenzweig@nih.gov).
Cell Cultures and Mice
Mature resting B cells were isolated from C57BL6/J or SPRET/EiJ mouse spleen with anti-CD43 MicroBeads (Miltenyi Biotech). B cells were activated with LPS (25 µg/ml; Sigma), IL-4 (5 ng/ml; Sigma) and RP105 (0.5 µg/ml; BD) for 12 hours as described (Callen et al., 2013). Abelson-transformed pre-B cell lines were arrested in G1 by treatment with 3 µM imatinib for 48 hours as described (Bredemeyer et al., 2006). Mature T cells were isolated from C57BL6/J mouse lymph nodes and activated for 4 hours with plate-bound anti-TCR beta and anti-CD28 antibodies. Primary MEFs were isolated from WT or TOP2B−/− E12.5 days mouse embryos and expanded for 4 passages. Primary cultured neurons were isolated from C57BL6/J pregnant females at embryonic day 18, as described previously (Roche and Huganir, 1995), and grown in serum-free Neurobasal media (Invitrogen) with glutamine and B-27 supplement for 3 days. MCF7 cells (gift from Shunichi Takeda) were plated in phenol-red free DMEM (GIBCO) with 10% charcoal-stripped FBS (Invitrogen) for 48 hours. Nalm6 cells (gift from Noritaka Adachi) were cultured in 10% of FBS for 48 hours. Etoposide (E1383, Sigma-Aldrich) was directly added to the cultures at 50µM for 30 minutes, and 10–40 million cells were harvested for END-seq. For spike-in experiments with ZFN, Lig4−/− pre-B cells were treated imatinib for 48 hours and 1 µg/ml Doxycycline during the last 24 hours as described (Bredemeyer et al., 2006; Canela et al., 2016). All animal experiments were approved by the NCI Animal Care and Use Committee.
EdU and RNA staining
To measure DNA synthesis, B cell cultures were stimulated for 12 hours or 24 hours, pulsed with 10 µM of EdU (5-ethynyl-2'-deoxyuridine) for 30 min at 37 °C and stained using the Click-IT EdU Alexa Fluor 488 Flow Cytometry Assay Kit according to the manufacturer’s specifications (ThermoFisher C10425). Samples were acquired on a FACSCantoII (BD biosciences). For RNA staining, samples were incubated with pyronin Y (Sigma-Aldrich #P9172, 2µg/ml final concentration) for 20 min at 37C then analyzed by flow cytometry.
Immunoblotting
Cells were washed in cold PBS and pellets were kept at −80°C. Whole cell extract (WCE) was obtained by suspending the cell pellets in Laemmli lysis buffer (4% SDS, 20% glycerol, 125mM TrisHCl pH7.4, 50mM b-Glycerophosphate disodium, 2mM PMSF and 1× Complete Mini EDTA free proteinase inhibitor (Roche)), boiled for 5 minutes, cooled down to RT, sonicated for 15 seconds at amplitude 20% in an Ultrasonic Processor (Cole-Parmer) and centrifuged at 13,000 rmps for 10 minutes. After centrifugation, supernatant was collected and protein measured by the Pierce BCA protein assay (Thermofisher). 30µg of total protein were loaded per well in 4–12% Bis-Tris gels (NuPAGE, Invitrogen) and wet-transferred onto nitrocellulose membranes. Membranes were incubated for 1h in TBST+ 5% membrane blocking reagent (GE Healthcare Lifesciences) at room temperature prior to primary antibody incubation for 2 hours and room temperature in aforementioned blocking buffer, following manufacturer’s recommended dilutions: Anti-TOP2A Abcam (ab-52934) [1:5000], Anti-TOP2B Novus (NB100-10842) [1:2000] and Anti-beta Actin Sigma (a5441) [1:5000]. Membranes were washed 3 times in TBS-1%Tween-20 at room temperature, incubated with secondary antibodies (Anti-Rabbit Li-cor (926-32211) [1:15000] and Anti-mouse Li-cor (926-68070) [1:15000]) for 1 hour at room temperature in aforementioned blocking buffer, and then membranes were visualized using LI-COR Odyssey system (Odyssey; LI-COR Biosciences).
END-seq
Embedding cells in agarose plugs
Single cell suspensions of B-cells (15 million), pre-B cells (40 million), T-cells (15 million), MEFS (4 million), neurons (5 million), MCF7 (5 million) and Nalm6 (15 million) were untreated or treated with transcription inhibitors and/or etoposide as indicated in the ‘Cell Culture’ and ‘Nascent RNA’ sections. Cells were washed twice in cold PBS and resuspended in 53 µl of cold cell suspension buffer (Bio-Rad CHEF Mammalian Genomic DNA plug kit) for a total volume (pellet + suspension buffer) of 62.5 µl, equilibrated for 5 minutes at room temperature, mixed with 37.5 µl of 2% melted CleanCut agarose (Bio-Rad CHEF Mammalian Genomic DNA plug kit) prewarmed at 37°C, and transferred immediately into plug molds (Bio-Rad CHEF Mammalian Genomic DNA plug kit) on a metal block on ice. 1 plug of B cells, pre-B cells T-cells and neurons, 2 plugs of MCF7 and Nalm6 and 4 plugs of MEFs were used with the above indicated number of cells per plug. Plugs were allowed to solidify at 4°C for 20 minutes and were incubated in 2.5 ml of IrysPrep Lysis Buffer (BioNano Genomics) with 170 µl Proteinase K solution (Puregene, Qiagen) in 50 ml conical tubes in a ThermoMixer C (Eppendorf) for 1h at 50°C and 7h at 37°C with intermittent mixing (15 minutes without mixing, 15 seconds 400 rpm mixing). This was followed with 3 consecutive rinses in 10 mM Tris pH 8.0, 50mM EDTA (Wash buffer) and then this solution was kept at room temperature overnight. Etoposide and transcription inhibitors were maintained at the same experimental concentrations in all the steps until digestion with Proteinase K (in PBS, cell suspension and IrysPrep Lysis buffers as well as in the agarose). The next day plugs were rinsed with 10 mM Tris pH 8.0, 1mM EDTA (TE buffer) and washed twice in 15 ml of TE buffer for 15 minutes on a horizontal platform mixer at 180rpm at room temperature.
RNAse treatment of plugs
Above plugs were incubated in 2.5 ml of TE buffer with 50 µl of RNAseA (Puregene, Qiagen) in 50 ml conical tubes in a ThermoMixer C (Eppendorf) for 1h at 37°C with intermittent mixing (15 minutes without mixing, 15 seconds 400 rpm mixing) and was followed by 4 washes with 10 mM Tris pH 8.0, 50mM EDTA for 15 minutes on a horizontal platform mixer at 180rpm at room temperature.
Blunting of DNA ends at double strand breaks
Agarose plugs stored in wash buffer were washed 4 times for 15 minutes in 15ml EB buffer (10 mM Tris pH 8.0) on a horizontal platform mixer at 180rpm at room temperature. Double strand breaks with covalently associated TOP2 adducts were removed using Exonuclease VII. This was followed by Exonuclease T to blunt the released DNA ends. Before the Exonuclease VII reaction and after EB washes, plugs were transferred to 1.5 ml Eppendorf tubes and equilibrated twice for 15 minutes in 1 ml NEB Exonuclease VII buffer in a rotator at room temperature. These plugs were then treated with 50 units of Exonuclease VII in 100 µl of NEB Exonuclease VII buffer for 1 hour at 37C with continuous mixing. The Exonuclease VII reaction was removed from the Eppendorf tubes and plugs were equilibrated twice for 15 minutes in 1 ml NEBuffer 4 in a rotator and treated with 25 units of Exonuclease T in 100 µl of NEBbuffer 4 for 45 minutes at 25°C with continuous mixing. Plugs were then transferred to 50 ml conical tubes and washed 3 times for 15 minutes in 15ml EB buffer (10 mM Tris pH 8.0) on horizontal platform mixer at 180rpm at room temperature.
A-tailing and ligation of END-seq adapter 1
After washes following Exonuclease T treatment, plugs were transferred to 1.5 ml Eppendorf tubes and equilibrated 3 times for 15 minutes in 1 ml NEBNext dA-Tailing reaction buffer in a rotator at room temperature. The A-tailing reaction was performed by treating each plug with 30 units of Klenow fragment exo- (NEB) in 100 ul of NEBNext dA-Tailing reaction buffer. Plugs were washed in 1 ml NEBuffer 2 for 15 minutes in a rotator and END-seq adapter 1 ligation was performed in 125 µl NEB Quick Ligation buffer with 8,000 U of NEB Quick ligase and 0.4 µM of END-seq adapter 1 for 1 hour at 25°C with continuous mixing (5'-Phos-GATCGGAAGAGCGTCGTGTAGGGAAAGAGTGUU[Biotin-dT]U[BiotindT] UUACACTCTTTCCCTACACGACGCTCTTCCGATC*T-3' [*phosphorothioate bond])
HPLC purified, 10 µM oligo dissolved in NEB T4 DNA ligase reaction buffer was self-annealed by incubating it on a floater on 1L of water at 95 °C that was left to cool to room temperature). The ligation reaction was removed and each plug was washed 4 times for 15 minutes in 1 ml of Wash buffer (Tris pH 8.0, 50mM EDTA) in a rotator at room temperature. Each plug was transferred to a 50 ml conical tube with 45 ml of Wash buffer and was equilibrated overnight at 23°C in a ThermoMixer C (Eppendorf) with intermittent mixing (15 minutes without mixing, 15 seconds 400 rpm mixing).
DNA sonication and shearing
Above plugs were washed 4 times for 15 minutes in 15 ml of TE buffer on a horizontal platform mixer at 180rpm at room temperature, transferred to 1.5ml eppendorf tubes, melted at 70°C for 2 minutes and equilibrated for 5 minutes in a water bath at 43°C. The plugs were then digested with 0.4U of GELase (Epicentre) for 45 minutes at 43°C and liberated DNA was cleaned by drop-dialysis (dialysis membranes 0.1µm VCWP04700 Millipore, MA, USA) against 15ml TE buffer for 1 hour. 0.1% of SDS was added to the DNA and treated with 80µg of proteinase K (Ambion) for 15 minutes at 50°C. This DNA was brought to a volume of 130 µl with TE buffer and transferred to a Covaris microTUBE AFA Fiber Pre-Slit Snap-Cap 6×16mm and sheared on a Covaris S220 sonicator for 4 min at 10% duty cycle, peak incident power 175, 200 cycles per burst in a water bath maintained at 4°C. Sonication under these conditions resulted in DNA fragments with a median shear length of 170bp. At this point, sheared DNA from the same sample in different plugs was combined. DNA was precipitated with 1µl of glycogen (Roche, 20 mg/ml) 0.1 volumes of 3M NaOAc pH5.2 and 2.5 volumes of 100% ethanol in dry ice for 15 minutes, and centrifuged at full speed in a standard microcentrifuge at 4 degrees for 15 minutes. The pellet was washed twice with 70% ethanol and solubilized in 70µl of TE low EDTA (10mM TrisHCl pH 8.0, 0.1mM EDTA).
DNA purification
DNA fragments containing the biotinylated adapter were purified using streptavidin Dynabeads beads (MyOne Streptavin C1 Beads, ThermoFisher #650-01). Briefly, 35 µl of Dynabeads were washed twice with 1 ml Binding and Wash Buffer (1×BWB) (10 mM Tris-HCl pH8.0, 1 mM EDTA, 1 M NaCl, 0.1% Tween20) by pipetting up and down 6 times. Beads were recovered using a DynaMag-2 magnetic separator (12321D, Invitrogen). Supernatants were discarded. Washed beads were resuspended in 70 µl 2× Binding and Wash Buffer (2×BWB) (10 mM Tris-HCl pH8.0, 2 mM EDTA, 2 M NaCl) combined with 70 µl of DNA from the ’Sonication and Shearing’ steps and incubated at 24°C for 30 minutes in a ThermoMixer C at 400 rpm (tubes were vortexed every 10 minutes).
End-Repair, A-Tailing and ligation of END-seq adapter 2
Following the 30 minutes of mixing (above), the supernatant was removed and the bead bound biotinylated DNA was washed 3 times with 1 ml 1×BWB, twice with 1 ml EB buffer, once with 1 ml T4 ligase reaction buffer (NEB) and then resuspended in 50 µl of end-repair reaction with T4 ligase reaction buffer, 0.4 µM of dNTPs, 2.7 U of T4 DNA polymerase (NEB), 9 U of T4 Polynucleotide Kinase (NEB) and 1 U of Klenow fragment (NEB). The end-repair reaction was incubated at 24°C for 30 minutes in a ThermoMixer C at 400 rpm (tubes were vortexed every 10 minutes). The supernatant was removed using a magnetic separator and beads were then washed once with 1 ml 1×BWB, twice with 1 ml EB buffer, once with 1 ml NEBNext dA-Tailing reaction buffer (NEB) and then resuspended in 50 µl of A-tailing reaction with NEBNext dA-Tailing reaction buffer (NEB) and 20 U of Klenow fragment exo- (NEB). The A-tailing reaction was incubated at 37°C for 30 minutes in a ThermoMixer C at 400 rpm (tubes were vortexed every 10 minutes). The supernatant was removed using a magnetic separator and washed once with 1 ml NEBuffer 2 and then resuspended in 115 µl of Ligation reaction with Quick Ligase buffer (NEB), 6,000 U of Quick Ligase (NEB) and 13 nM of END-seq adapter 2 and incubated at 25°C for 30 minutes in a ThermoMixer C at 400 rpm. (ENDseq-adaptor-2, 5’-Phos-GATCGGAAGAGCACACGTCUUUUUUUUAGACGTGTGCTCTTCCGATC*T-3’ [*phosphorothioate bond], HPLC purified, 10 µM oligo dissolved in NEB T4 DNA ligase reaction buffer was self-annealed by incubating it on a floater on 1L of water at 95°C that was left to cool to room temperature, diluted to 0.5 µM and aliquoted).
Hairpin digestion and library amplification
The supernatant from the ligation reaction above was removed using a magnetic separator and beads were then washed 3 times with 1 ml 1×BWB, 3 times with 1 ml EB buffer, resuspended in 8 µl of EB and added to 10 µl of USER reaction (containing 8 µl of 2X Kapa HiFi HotStart Ready mix (Kapa Biosciences) and 2 µl USER enzyme mix 1U/µl (NEB)) to digest hairpins on adapters. The USER reaction was incubated at 37°C for 30 minutes, and mixed with 1.5 µl of 50 µM TruSeq barcoded primer (5'-CAAGCAGAAGACGGCATACGAGATNNNNNN GTGACTGGAGTTCAGACGTGTGCTCTTCCGATC*T-5’, 1.5 µl of 50 µM TruSeq multiplex primer (5'-AATGATACGGCGACCACCGAGATCTACACTCTTTCCCTACACGACGCTCTTCC GATC*T-3' * represents a phosphothiorate bond and NNNNNN a Truseq index sequence, 20 µl of 2X Kapa HiFi HotStart Ready mix (Kapa Biosciences) and 17 ul of H2O. The temperature settings during the PCR amplification were 45 s at 98 C followed by 16 cycles of 15 s at 98°C, 30 s at 63°C, 30 s at 72°C followed by a final 5 min extension at 72°C. Dynabeads were removed with a DynaMag-PCR Magnet, PCR reactions were cleaned with Agencourt AMPure XP beads (Beckman Coulter), run on a 2% agarose gel and a DNA distribution of 200–400bp was cut and gel purified using a QIAquick Gel Extraction Kit (Qiagen). Library concentrations were determined with KAPA Library Quantification Kit for Illumina Platforms (Kapa Biosystems). Sequencing was performed on the Illumina Nextseq500 (75bp single end reads) according to the manufacturer’s specifications.
ChIP-seq
Cells were fixed adding 37% formaldehyde (F1635, Sigma) to a final concentration of 1% and incubating them at 37°C for 10 minutes. Fixation was quenched by addition of 1M glycine (Sigma) in PBS at a final concentration of 125 mM. Twenty million fixed cells were washed twice with cold PBS and pellets were snap frozen in dry ice and stored at −80°C. Fixed cell pellets of 20 million cells were thawed on ice and resuspended in 2 ml of cold RIPA buffer (10 mM TrisHCl pH 7.5, 1 mM EDTA, 0.1% SDS, 0.1% sodium deoxycholate, 1% Triton X-100, 1× Complete Mini EDTA free proteinase inhibitor (Roche)). Sonication was performed using the Covaris S220 sonicator at duty cycle 20%, peak incident power 175, cycle/burst 200 for 30 min or using the Branson sonifier at amplitude 35%, 12 cycles of 20” sonication and 30” of pause. Chromatin were clarified by centrifugation at 21,000 g at 4°C for 10 min and precleared with 80 µl prewashed Dynabeads protein A (ThermoFisher) for 30 minutes at 4°C. 40 µl prewashed Dynabeads protein A were incubated with 10 µg of each respective antibody in 100 µl of PBS for 10 minutes at room temperature in continuous mixing, washed twice in PBS for 5 minutes and added to 1 ml of chromatin followed by overnight incubation at 4°C on a rotator. Beads were then collected in a magnetic separator (DynaMag-2 Invitrogen), washed twice with cold RIPA buffer, twice with RIPA buffer containing 0.3M NaCl, twice with LiCl buffer (0.25 M LiCl, 0.5% Igepal-630, 0.5% sodium deoxycholate), once with TE (10 mM Tris pH 8.0, 1mM EDTA) plus 0.2% Triton X-100, and once with TE. Crosslinking was reversed by incubating the beads at 65°C for 4 hours in the presence of 0.3% SDS and 1mg/ml of Proteinase K (Ambion). DNA was purified using Zymo ChIP DNA clean and concentrator kit (Zymo Research) and eluted in 20 µl. The entire ChIP DNA was used to prepare Illumina sequencing libraries. End-repair was performed in 75 µl of T4 ligase reaction buffer, 0.4 µM of dNTPs, 4 U of T4 DNA polymerase (NEB), 13.5 U of T4 Polynucleotide Kinase (NEB) and 1.5 U of Klenow fragment (NEB) at 24°C for 30 minutes in a ThermoMixer C at 400 rpm. End-repair reaction was cleaned using 2X Agencourt AMPure XP beads and eluted in 15 µl of EB that was used for A-tailing reaction in 30 µl of NEBNext dA-Tailing reaction buffer (NEB) with 7.5 U of Klenow fragment exo- (NEB) at 37°C for 30 minutes. The 30 µl of the A-tailing reaction were mixed with Quick Ligase buffer 2X (NEB), 3,000 U of Quick ligase and 5 nM of annealed adapter (Illumina truncated adapter) in a volume of 75 µl and incubated at 25°C for 20 minutes. Adapter was prepared by annealing the following HPLC oligos: 5’-Phos/GATCGGAAGAGCACACGTCT-3’and 5’-ACACTCTTTCCCTACACGACGCTCTTCCGATC*T-3’ (*phosphorothioate bond). Ligation was stopped adding 50mM of EDTA and cleaned with 1.8X Agencourt AMPure XP beads and eluted in 15ul of EB that was used for PCR amplification in a 50 15 µl reaction with 10 µM primers 5'-CAAGCAGAAGACGGCATACGAGATXXXXXXGTGACTGGAGTTCAGACGTGT GCTCTTCCGATC*T-3' and 5'-AATGATACGGCGACCACCGAGATCTACACTCTTTCCCTACACGACGCTCTTCC GATC*T-3' * represents a phosphothiorate bond and NNNNNN a Truseq index sequence, and 2X Kapa HiFi HotStart Ready mix (Kapa Biosciences). The temperature settings during the PCR amplification were 45 s at 98 C followed by 15 cycles of 15 s at 98°C, 30 s at 63°C, 30 s at 72°C and a final 5 min extension at 72°C. PCR reactions were cleaned with Agencourt AMPure XP beads (Beckman Coulter), run on a 2% agarose gel and a smear 200–500bp was cut and gel purify using QIAquick Gel Extraction Kit (Qiagen). Library concentration was determined with KAPA Library Quantification Kit for Illumina Platforms (Kapa Biosystems). Sequencing was performed on the Illumina Nextseq500 (75bp single end reads). Antibodies for ChiP-seq were: anti-Rad21 (ab992, Abcam), anti-CTCF (07-729, Millipore) and Topo IIβ Antibody (H-286) (sc13059, SantaCruz) and Anti-Topoisomerase II alpha (ab-52934, Abcam).
Nascent RNA
To label RNA synthesis B cell cultures stimulated for 12 hours, labeled with 1 mM 5-ethynyl uridine (EU) for 30 minutes at 37°C, washed once in cold PBS and attached to glass slides coated with Cell-Tak (BD Biosciences) and fixed with 4% formaldehyde in PBS for 15 minutes. Permeabilization was carried out in 0.5% Triton X-100 in PBS for 15 minutes at RT and staining was done with the Click-iT RNA Alexa Fluor 594 Imaging kit according with the manufacturer's specifications. After Click-it, immunofluorescent staining was performed against γ-H2AX; after 30 minutes in blocking solution of 1% bovine serum albumin (BSA) in PBS with 0.05% Tween-20, slides were incubated with anti-phospho-Histone H2A.X (Ser139) at 1/10,000 in blocking solution for 1 hour at RT, followed by 3 washes in PBS with 0.05% Tween-20 for 5 minutes, secondary antibody goat anti-mouse IgG1 Alexa 488 at 1/10,000 in blocking solution of 1% bovine serum albumin (BSA) in PBS with 0.05% Tween-20 1 hour at RT and 3 washes in PBS with 0.05% Tween-20 for 5 minutes. DNA was counterstained with DAPI and slides were mounted using Vectashield (Vectorlabs). Imaging of γ-H2AX and EU-RNA intensity was performed using a wide-field epi-fluorescence Zeiss Axio Observer Z1 microscope equipped with a plan-apochromat ×63 (numerical aperture 1.4), motorized stage and Zeiss AxioCam CCD (charge-coupled device) camera. Images were acquired and processed using Zeiss Zen imaging software with the same acquisition parameters and imaging analyses were performed in 4 images per condition using ImageJ, (version 1.51m9, Analyze particle utility (Schneider et al., 2012). Data was analyzed using Prism (v.7 GraphPad). DRB (D-ribofuranosylbenzimidazole) (150 µM) or Triptolide (3 µM) was added to 90 minutes prior to EU labeling, and etoposide was present in the medium 5 minutes before and during the EU labeling (30 minutes).
For Nascent RNA-seq, B cell cultures stimulated for 12 hours and 4 million were labeled with 0.5 mM 5-ethynyl uridine (EU) for 30 minutes. Etoposide and DRB or Triptolide was added as indicated above. Total RNA extraction was performed using TRIzol (Ambion) and 1 µg was rRNA depleted using the NEBNext rRNA Depletion kit (human/mouse/rat) (New England Biosciences), prior to biotinylation by the Click-it reaction (Click-iT Nascent RNA Capture Kit, ThermoFisher C10365) using manofacture’s specification. First-strand cDNA synthesis of the captured nascent RNA was done using SuperScript VILO cDNA synthesis kit (Invitrogen), following AMPure XP purification (1.8X) and elution in 20 µl second-strand cDNA was synthesized with 0.6 mM dNTPs in the presence of 2 units of RNase H (Invitrogen) and 20 units of E. coli DNA polymerase I (Invitrogen) in a total volume of 30 µl for 2.5 hours at 16°C. Double stranded cDNA was cleaned using 1.8X Agencourt AMPure XP beads and eluted in 20 µl of EB that was used for end-repair. End-repair was performed in 50 µl of T4 ligase reaction buffer, 0.4 µM of dNTPs, 3 units of T4 DNA polymerase (NEB), 9 units of T4 Polynucleotide Kinase (NEB) units 1 U of Klenow fragment (NEB) at 24°C for 30 minutes in a ThermoMixer C at 400 rpm. End-repair reaction was cleaned using 1.8X Agencourt AMPure XP beads and eluted in 15 µl of EB that was used for A-tailing reaction in 30 µl of NEBNext dA-Tailing reaction buffer (NEB) with 7.5 U of Klenow fragment exo- (NEB) at 37°C for 30 minutes. The 30 µl of the A-tailing reaction were mixed with Quick Ligase buffer 2X (NEB), 3,000 U of Quick ligase and 5 nM of annealed adapter (Illumina truncated adapter) in a volume of 75 µl and incubated at 25°C for 20 minutes. The adapter was prepared by annealing the following HPLC oligos: 5’-Phos/GATCGGAAGAGCACACGTCT-3’and 5’-ACACTCTTTCCCTACACGACGCTCTTCCGATC*T-3’ (*phosphorothioate bond). Ligation was stopped adding 50mM of EDTA and cleaned with 1.8X Agencourt AMPure XP beads and eluted in 15ul of EB that was used for PCR amplification in a 50 15 µl reaction with 10 µM primers 5'-CAAGCAGAAGACGGCATACGAGATXXXXXXGTGACTGGAGTTCAGACGTGT GCTCTTCCGATC*T-3' and 5'-AATGATACGGCGACCACCGAGATCTACACTCTTTCCCTACACGACGCTCTTCC GATC*T-3' * represents a phosphothiorate bond and NNNNNN a Truseq index sequence, and 2X Kapa HiFi HotStart Ready mix (Kapa Biosciences). The temperature settings during the PCR amplification were 45 s at 98 C followed by 15 cycles of 15 s at 98°C, 30 s at 63°C, 30 s at 72°C and a final 5 min extension at 72°C. PCR reactions were cleaned with Agencourt AMPure XP beads (Beckman Coulter), run on a 2% agarose gel and a smear 200–500bp was cut and gel purify using QIAquick Gel Extraction Kit (Qiagen). Library concentration was determined with KAPA Library Quantification Kit for Illumina Platforms (Kapa Biosystems). Sequencing was performed on the Illumina Nextseq500 (75bp single end reads). Alternatively, for the triptolide experiment strand specific nascent-RNA libraries were generated by using in the second-strand synthesis reaction 1.2 mM of dUTP instead of 0.6 mM of dTTP, and the elution of the ligation reaction was treated with 0.5 units of Uracil-DNA glycosylase (Thermofisher) for 15 minutes at 37°C before the PCR.
In Situ HiC
A detailed protocol to generate in situ Hi-C libraries including sequence alignment and Aggregate Peak Analysis can be obtained from (Rao et al., 2014). Hi-C data analysis is described in the Bioinformatics section.
Quantification and Statistical Analysis
Genome Alignment
Tags were aligned to the mouse (GRCm38p2/mm10) genome or human (hg19) genome using Bowtie (version 1.1.2) (Langmead et al., 2009) with the options --best --all –strata –l 50. For ChIP-seq and ATAC-seq– we allow 2 mismatches and discarded tags with multiple alignments (-n 2 –m 1). For GRO-seq and nascent RNA-seq, we allow 3 mismatches (–n 3 –m1). For END-seq – we allowed 3 mismatches and kept the best strata for tags with multiple alignments (-n 3 –k 1). The alignment output sam files were converted into bam files using Samtools (Li et al., 2009).
Peak Calling
Peaks were called using MACS 1.4.3 (Zhang et al., 2008). For CTCF, RAD21, TOP2B, NIPBL and H3K4me3 ChIP-seq peaks, we used the default parameters (P-value cutoff for peak detection=1×10⁻⁵;--keep-dup=auto). For H3K27Ac ChIP-seq and ATAC-seq peaks, we used parameters suitable for broader peaks (--nolambda,-- nomodel) (Feng et al., 2011). All ChIP-seq peak lists were filtered against the corresponding DNA input as a control. END-seq peaks were called using the parameters: --nolambda,-- nomodel and – keep-dup=all (keep all redundant reads). For Etoposide-treated END-seq data peak calling, we used the corresponding non-treated samples as control, keeping >10 fold-enriched peaks.
CTCF Site Detection
Position Weight Matrix (PWM) of CTCF was taken from JASPAR data-base (Mathelier et al., 2014). With this PWM, we scanned the mouse genome using the FIMO tool (Grant et al., 2011) for significant CTCF sites (p<1×10⁻⁴).
Genome Annotations
Transcription start sites and gene body coordinated were defined using RefSeq genes annotations taken from UCSC database (Karolchik et al., 2004). Active promoters were defined as the regions +/− 1kb from TSS, that overlap with H3K4me3 ChIP-seq peaks. Enhancers were defined as H3K27Ac peaks that are not promoters.
END-seq and ChIP-seq Analysis
Comparison between etoposide treated vs non-treated, as well as WT vs TOP2B−/− DSB levels at the END-seq peaks coordinates (Figure 2C) was performed by the Paired T-test. To test the enrichment for breaks at CTCF sites (#(END-seq peaks)=25,512;#(CTCF peaks=50,926); Figures 4C and S3A), we used two-sided Fisher’s exact test.
To measure the fold-enrichment of DSBs at CTCF+, CTCF+RAD21+ (n=44,580) and CTCF+RAD21+TOP2B+ (n=24,843) sites, we took the percentage of base-pairs at these regions that harbor DSBs and divided it by the fraction of the whole mouse genome that contains DSBs (Figure 4D). To assess the overlap between END-seq sites among cell types, we measured the fraction of DSBs from B cells that overlap with either pre-B cells, T cells, neurons or MEFs (Figure 4E). As a benchmark for cell-type similarity – we counted the H3K27Ac peak subset with same number of peaks and size distribution as the corresponding DSBs peak set. Two-sided Fisher’s exact test was applied to compare DSBs and H3K27Ac overlap.Two-sided T-test was used to compare the level of breaks between conserved and non-conserved DSB sites; Figure 4E;inset). Chi-square test for independence was used to test the relation between polymorphism at CTCF+cohesin sites and DSBs sites (Figure 6A). Spearman correlation coefficient was used to test the correlation between DSBs and CTCF, RAD21, TOP2B, NIPBL, ATAC-seq and H3K27Ac binding. P-value for Spearman correlation was calculated by asymptotic t approximation. The above features were used to predict DSBs intensity (from END-seq) using a linear regression model, carried-out using R function ‘lm’ using the log RPKM value.
ChIA-PET Analysis
ChIA-PET loop anchors were determined as described earlier (Kieffer-Kwon et al., 2013). Looped promoter/enhancer was defined as promoter/enhancers (see definition above) that overlap with ChIA-PET loops. To test the enrichment of breaks in looped promoters/enhancers compared to non-looped corresponding regions, we used the two-sided Fisher’s exact test (Figure 4A and 4B). As a support for looping characteristics of broken promoters/enhancers – we compared broken and unbroken promoters/enhancers for CTCF and Cohesin (two-sided Fisher’s exact test; Figures 4B and S3D). To test the enrichment of two-anchored ChIA-PET loop breaks, we compared the observed fraction of loops where two anchors contained DSBs to an expected distribution, given by shuffling the coordinates of one of the anchors for each loop (Two-sided Fisher’s exact test; Figure 4B, Figure S3C).
Hi-C Analysis
Pre-processing and normalization
We used juicer software to filter reads and subsequently normalize the ligation frequency matrices as previously published (Rao et al., 2014). All the normalized data corresponds to matrices balanced using the Knight-Ruiz algorithm as published (Rao et al., 2014). We next used the juicebox dump function to extract the normalized matrices from the inter_30.hic file (Durand et al., 2016). For this analysis, we used the 5kb resolution matrices.
Loop calling
We used juicer software to call loops with the default parameters. Loop anchors and Loop Hi-C signals: From the loop list (n=8,666), we collected loop anchor positions of each loop, then selected unique list of anchor positions. Loop Hi-C signals was calculated as the mean of the normalized in-situ Hi-C signals in the loop square determined by each loop anchors axis.
Average profile of in situ Hi-C signal at loops
We divided loops in two categories based on the signature of their anchors. If both of loop anchors overlapped a Rad21 peak and did not overlap a DSB nor a peak of Top2B they were considered in the Rad21+DSB-Top2B− group. If both loop anchors overlapped a Rad21, Top2B and DSB sites they were deemed Rad21+DSB+Top2B+. To produce Aggregate Peak Analysis, we isolated the normalized in-situ Hi-C signal in a square matrix of the size of 15×15 pixels, centered at the loop midpoint. We computed a per pixel average of the normalized Hi-C signal. Of note, loops considered in the Aggregate Peak Analysis were larger than 75kb (15×5kb bin). To compare between Rad21+DSB−Top2B− and Rad21+DSB+Top2B+ loops, we considered all the Rad21+DSB−Top2B− and Rad21+DSB+Top2B+ loops. We noticed that loops in the two categories differed (albeit modestly) in sizes. Since loop signal may depend on the loop size, we devised a dedicated strategy to accurately compare loop signal between the two loop classes. First, we summed up the signal in the box of a size 3×3 pixels centered on the loop’ midpoint and computed its logarithm. Next, we considered the distribution of loop sizes (measured in the number of 5kb bins separating loop anchors’ starts) in the Rad21+DSB−Top2B− category as the reference. This gave us the number of loops per distance in the reference set (Nd). Then, for each loop size (d), we sampled (with replacement) N loops from the Rad21+DSB+TopIIb+ set. We used the two-sided t-test to assess significance of the observed difference. The enrichment of two-anchored Hi-C loop breaks (Figures 5E) was assessed similar to the ChIA-PET loop analyses described above. The hypergeometric test was used to test the enrichment of breaks at loop anchors compare to the overlap of loop anchors with CTCF+Rad21 sites. Flow Cytometry and Immunofluorescence Analyses Analysis of flow cytometry (Figure 3B) was done using FlowJo (version 10). Mann Whitney test was used to compare γ–H2AX and EU-RNA signals of etoposide treated cells and cells treated with etoposide and DRB (Figure 3B).
Data Visualization
To make genome tracks, we first used bedtools genomecov (Quinlan and Hall, 2010) to convert the aligned bed files to bedgraph, and then bedGraphToBigWig to make a bigwig file. Values were normalized to show reads per million. Visualization of genomic profiles was done by the UCSC browser (Kent et al., 2002). Heatmaps were produced using the R package ‘pheatmap’. For TOP2B binding, reads non-redundant reads in 50bp non-overlapping window were summed-up. Aggregated plots around CTCF were done as follows: Given CTCF sites (n=35,532; see criteria above), we retained only these that overlap with CTCF and RAD21 (n=19,060). We then aggregated the signal of the tested feature around the CTCF site, while keeping the orientation. For CTCF, the reads coordinates were shifted strand-wise half the fragment size as predicted by MACS (Zhang et al., 2008). The signal was then smoothed using smooth.spline function in R.
Data and Software Availability
The accession number for END-seq, Nascent RNA-seq and ChIP-seq reported in this paper is NCBI GEO: GSE99197.
Supplementary Material
(A) Transcriptional activity measured as total RNA content, stained by pyronin Y, between resting and 12h activated B cells (left panel, resting in red, 12h activated in blue). DNA replication as measured by 5-ethynyl-2'-deoxyuridine (EdU) incorporation in the newly synthesized DNA at 12h (middle panel) and 24h (right panel) activated B cells. Percentage of cells positive for EdU is indicated. (B) Tmprss2 locus showing RNA synthesis (GRO-seq) and DSB profiles in activated B-cells. Tmprss2 is not expressed in B cells but shows DSBs. The actively transcribed MLL locus is shown below as a comparison. Arrow indicates direction of transcription. (C) Close-up view of MLL (upper panel) and Tmprss2 (lower panel) at breakpoint cluster regions showing DSBs in the human cancer cell lines Nalm-6 and MCF-7; below, CTCF occupancy in MCF-7. The breakpoint cluster region is represented as a black rectangle and arrow represents direction of transcription. (D) Venn diagram shows the overlap of spontaneous and ETO induced DSBs measured in 12 hour activated B cells.
(A) Comparison of ETO-induced DSB levels and the transcriptional activity at the break sites quantified by END-seq and nascent RNA-seq respectively for 12 hours activated B cells. (B) Comparison of the ratio of transcription activity, measured by nascent RNA, and DSBs levels in 12 hours activated B-cells vs. resting B-cells (Spearman correlation, ρ=0.35). (C) MLL and Tmprss2 break cluster regions showing normalized DSB profiles in resting (top) and 12 hour activated B cells (bottom). (D) Venn diagram showing number of ETO-induced DSBs in resting and 12 hour activated B cells. (E) Comparison of ETO-induced DSBs levels quantified by END-seq between resting and 12 hour activated B-cells (Spearman correlation, ρ=0.56, p<1×10⁻¹⁵, median activated/resting ratio −1.06). (F) 12 hour activated B cells were assessed for nascent RNA synthesis (red, pulse labeled with EU for 30 minutes) and γ-H2AX induction (green) after either pre-incubation or not with the transcription initiation inhibitor Triptolide (3 uM for 90 minutes) followed or not by ETO treatment (50 uM for 30 minutes). Scale bar in white is 50 µm. (G) ETO-induced DSBs levels quantified by END-seq with (y-axis) or without (x-axis) Triptolide pre-incubation. DSBs sites are either insensitive to Triptolide (black), or decrease greater than 2-fold (light red) or 3- fold (dark red) upon Triptolide pre-incubation. DSB sites (shown in blue) overlap with CTCF binding. The internal graph compares the overlap with CTCF for each Triptolide sensitive category (Fisher’s exact test, p<5×10⁻⁵).
(A) Left panel: Venn diagram shows the overlap between ETO-induced DSBs and CTCF binding in 12h activated B cells (left) compared to the overlap between the same number and length of randomly picked ATAC-seq sites and CTCF binding in 12h activated B cells (right) (Fisher’s exact test; p<1×10⁻¹⁵). Right panel: Whisker plot comparing GC content at END-seq peaks, CTCF and random regions. (B) Genome-wide distribution of ETO-induced DSBs (number in brackets indicate the genome-wide fraction of each region). Transcriptional start sites (TSS) were defined as within 2 kilobases surrounding the TSS. Active promoters were defined as TSS+ H3K4me3+, and active enhancers were defined as H3K27Ac+ regions that were not promoters. (C) Percentage of Pol II-mediated DSB+ loop borders that have either both anchors overlapping with DSBs or only one (observed), compared to randomly paired anchors (expected) (Fisher’s exact test, p<1×10−37). (D) Frequency of overlap between CTCF (left) or RAD21 (right) occupancy and active promoters that are either associated or not with DSBs (Fisher’s exact test, p<1×10−120 for both). (E) Percentage of active promoters with and without DSBs. (F) Close-up view of oncogenic breakpoint cluster regions showing DSB profiles upon ETO treatment (measured by END-seq) and RAD21 occupancy (measured by ChIP-seq) in activated B-cells. (G) Comparison of ETO-induced DSB levels and the transcriptional activity at the break sites quantified by END-seq and nascent RNA-seq respectively for resting B-cells (top) and activated T-cells (bottom). (H) Aggregate plot of DSBs and CTCF binding at TSS-associated and non-TSSs sites. Plot extends +/− 500bp from the CTCF motif (dashed line). See also Figure 4G.
(A) Close-up views of the Hi-C interactions within MLL, AF4, ENL and TRMPSS2 showing (from top to bottom) DSBs profiles upon ETO, CTCF and RAD21 occupancy, and Hi-C chromatin loop interactions with resolution 5kb. The number of Hi-C lines is proportional to interaction strength. G-rich and C-rich orientation of the CTCF motifs are shown as blue and orange arrows, respectively. The position of breakpoint cluster regions (BCR) are indicated by red arrows.
(A) Spearman correlation coefficient between DSBs and either RAD21, TOP2B, CTCF, ATAC-seq, and H3K27Ac tested at CTCF binding sites (and the surrounding 500 bps) that bind CTCF and RAD21. (B) RAD21 and TOP2B binding are correlated. (C) Linear regression model was performed with END-seq levels as the response variable. Predictor variables were added in the order of their correlation with END-seq (as determined in Figure S5A). Right panel shows that RAD21 levels can, by themselves, predict DSB intensity, and there is no increase in prediction quality upon inclusion of additional parameters. (D) Left panel: comparison of the ratio of RAD21 occupancy and DSBs levels in 12 hours activated B-cells vs. activated T-cells (Spearman correlation, ρ=0.79). Right panel: comparison of the ratio of transcription, measured by nascent RNA, and DSBs levels in 12 hour activated B-cells vs. activated T-cells (Spearman correlation, ρ=0.32). (E) Example of a syntenic region in mouse and dog between the genes Ptpn5- Zdhhc13 that gave rise of an insertion in mouse as shown in (Vietri Rudan et al., 2015). Close-up view shows DSBs profiles upon ETO treatment, and CTCF/RAD21 occupancy in activated B cells. Vietri Rudan et al. demonstrated that a cluster of non-orthologous Mrgpr genes (blue) has been inserted in mouse between the orthologous genes Ptpn5 and Zdhhc13 (highlighted in red). The inserted region (in yellow bordered with a dashed line) forms its own nested chromosomal domain structure, probably because of gene duplication events. DSBs upon ETO localize at binding sites of CTCF and RAD21 that flank this duplication event.
cBioPortal OncoPrint graphical representation showing the alteration and co-occurrence/exclusivity of 11 genes across 191 Acute Myeloid Leukemia ((Cancer Genome Atlas Research et al., 2013) samples. There is a tendency (log of the odds ratio <−3) of mutual exclusivity between mutations affecting KMT2A and mutations in CTCF, RAD21, SMC3 and TOP2A.
Chromosome loop anchors bound by CTCF and Cohesin are vulnerable to DNA breaks
Breaks are transcription independent, mediated by TOP2B and correlate with cohesin
Translocation breakpoint regions in various cancers are enriched at loop anchors
Chromosome folding and topological stress relief go hand in hand
Acknowledgments
We thank Barry Sleckman, Shunichi Takeda, and Noritaka Adachi for cell lines and Xuguang Tai for assistance on T cells; Sam John, John Crispino, John Nitiss and James Berger for stimulating discussions and sequencing support from David Goldstein and the CCR Genomics Core. The A.N., P.D.A, Y.P., and R.C. laboratories are supported by the Intramural Research Program of the NIH; P.J.M. is supported by the NIH (NS-37956, CA-21765), the CCSG (P30 CA21765) and St. Jude Children's Research Hospital; E.L.A. is supported by an NIH Encyclopedia of DNA Elements Mapping Center Award (UM1HG009375), and the President’s Early Career Award in Science and Engineering. A.N. is supported by an Ellison Medical Foundation Senior Scholar in Aging Award, the Department of Defense Idea Expansion (W81XWH-15-2-006) and Breakthrough (W81XWH-16-1-0599) Awards, and an Alex Lemonade Stand Foundation Award.
Footnotes
Publisher's Disclaimer: This is a PDF file of an unedited manuscript that has been accepted for publication. As a service to our customers we are providing this early version of the manuscript. The manuscript will undergo copyediting, typesetting, and review of the resulting proof before it is published in its final citable form. Please note that during the production process errors may be discovered which could affect the content, and all legal disclaimers that apply to the journal pertain.
AUTHOR CONTRIBUTIONS
A.N., A.C., and R.C. designed experiments; Y.M., S.J., and A.P. performed bioinformatics analyses; A.C., N.W., A.D., E.C., K-R.K.K., S.S.P.R., S-C. H., and H.Z. performed experiments; E. L. A., P.M., P.D.A., Y.P., supervised and provided expert advice. A.N. wrote the manuscript.
Supplemental Information includes 6 Supplementary Figures.
References
- Alipour E, Marko JF. Self-organization of domain structures by DNA-loop-extruding enzymes. Nucleic acids research. 2012;40:11202–11212. doi: 10.1093/nar/gks925. [DOI] [PMC free article] [PubMed] [Google Scholar]
- Aplan PD. Chromosomal translocations involving the MLL gene: molecular mechanisms. DNA repair. 2006;5:1265–1272. doi: 10.1016/j.dnarep.2006.05.034. [DOI] [PMC free article] [PubMed] [Google Scholar]
- Baranello L, Kouzine F, Wojtowicz D, Cui K, Przytycka TM, Zhao K, Levens D. DNA break mapping reveals topoisomerase II activity genome-wide. Int J Mol Sci. 2014;15:13111–13122. doi: 10.3390/ijms150713111. [DOI] [PMC free article] [PubMed] [Google Scholar]
- Baranello L, Wojtowicz D, Cui K, Devaiah BN, Chung HJ, Chan-Salis KY, Guha R, Wilson K, Zhang X, Zhang H, et al. RNA Polymerase II Regulates Topoisomerase 1 Activity to Favor Efficient Transcription. Cell. 2016;165:357–371. doi: 10.1016/j.cell.2016.02.036. [DOI] [PMC free article] [PubMed] [Google Scholar]
- Barlow JH, Faryabi RB, Callen E, Wong N, Malhowski A, Chen HT, Gutierrez-Cruz G, Sun HW, McKinnon P, Wright G, et al. Identification of early replicating fragile sites that contribute to genome instability. Cell. 2013;152:620–632. doi: 10.1016/j.cell.2013.01.006. [DOI] [PMC free article] [PubMed] [Google Scholar]
- Bredemeyer AL, Sharma GG, Huang CY, Helmink BA, Walker LM, Khor KC, Nuskey B, Sullivan KE, Pandita TK, Bassing CH, et al. ATM stabilizes DNA double-strand-break complexes during V(D)J recombination. Nature. 2006;442:466–470. doi: 10.1038/nature04866. [DOI] [PubMed] [Google Scholar]
- Bunch H, Lawney BP, Lin YF, Asaithamby A, Murshid A, Wang YE, Chen BP, Calderwood SK. Transcriptional elongation requires DNA break-induced signalling. Nature communications. 2015;6:10191. doi: 10.1038/ncomms10191. [DOI] [PMC free article] [PubMed] [Google Scholar]
- Calderwood SK. A critical role for topoisomerase IIb and DNA double strand breaks in transcription. Transcription. 2016;7:75–83. doi: 10.1080/21541264.2016.1181142. [DOI] [PMC free article] [PubMed] [Google Scholar]
- Callen E, Di Virgilio M, Kruhlak MJ, Nieto-Soler M, Wong N, Chen HT, Faryabi RB, Polato F, Santos M, Starnes LM, et al. 53BP1 mediates productive and mutagenic DNA repair through distinct phosphoprotein interactions. Cell. 2013;153:1266–1280. doi: 10.1016/j.cell.2013.05.023. [DOI] [PMC free article] [PubMed] [Google Scholar]
- Cancer Genome Atlas Research, N. Ley TJ, Miller C, Ding L, Raphael BJ, Mungall AJ, Robertson A, Hoadley K, Triche TJ, Jr, Laird PW, et al. Genomic and epigenomic landscapes of adult de novo acute myeloid leukemia. The New England journal of medicine. 2013;368:2059–2074. doi: 10.1056/NEJMoa1301689. [DOI] [PMC free article] [PubMed] [Google Scholar]
- Canela A, Sridharan S, Sciascia N, Tubbs A, Meltzer P, Sleckman BP, Nussenzweig A. DNA Breaks and End Resection Measured Genome-wide by End Sequencing. Molecular cell. 2016;63:898–911. doi: 10.1016/j.molcel.2016.06.034. [DOI] [PMC free article] [PubMed] [Google Scholar]
- Chiarle R, Zhang Y, Frock RL, Lewis SM, Molinie B, Ho YJ, Myers DR, Choi VW, Compagno M, Malkin DJ, et al. Genome-wide translocation sequencing reveals mechanisms of chromosome breaks and rearrangements in B cells. Cell. 2011;147:107–119. doi: 10.1016/j.cell.2011.07.049. [DOI] [PMC free article] [PubMed] [Google Scholar]
- Cowell IG, Sondka Z, Smith K, Lee KC, Manville CM, Sidorczuk-Lesthuruge M, Rance HA, Padget K, Jackson GH, Adachi N, et al. Model for MLL translocations in therapy-related leukemia involving topoisomerase IIbeta-mediated DNA strand breaks and gene proximity. Proceedings of the National Academy of Sciences of the United States of America. 2012;109:8989–8994. doi: 10.1073/pnas.1204406109. [DOI] [PMC free article] [PubMed] [Google Scholar]
- Dixon JR, Gorkin DU, Ren B. Chromatin Domains: The Unit of Chromosome Organization. Molecular cell. 2016;62:668–680. doi: 10.1016/j.molcel.2016.05.018. [DOI] [PMC free article] [PubMed] [Google Scholar]
- Dong KC, Berger JM. Structural basis for gate-DNA recognition and bending by type IIA topoisomerases. Nature. 2007;450:1201–1205. doi: 10.1038/nature06396. [DOI] [PubMed] [Google Scholar]
- Dungrawala H, Rose KL, Bhat KP, Mohni KN, Glick GG, Couch FB, Cortez D. The Replication Checkpoint Prevents Two Types of Fork Collapse without Regulating Replisome Stability. Molecular cell. 2015;59:998–1010. doi: 10.1016/j.molcel.2015.07.030. [DOI] [PMC free article] [PubMed] [Google Scholar]
- Durand NC, Shamim MS, Machol I, Rao SS, Huntley MH, Lander ES, Aiden EL. Juicer Provides a One-Click System for Analyzing Loop-Resolution Hi-C Experiments. Cell Syst. 2016;3:95–98. doi: 10.1016/j.cels.2016.07.002. [DOI] [PMC free article] [PubMed] [Google Scholar]
- Feng J, Liu T, Zhang Y. Using MACS to identify peaks from ChIP-Seq data. Current protocols in bioinformatics / editoral board, Andreas D Baxevanis [et al] 2011 doi: 10.1002/0471250953.bi0214s34. Chapter 2, Unit 2 14. [DOI] [PMC free article] [PubMed] [Google Scholar]
- Fisher JB, McNulty M, Burke MJ, Crispino JD, Rao S. Cohesin Mutations in Myeloid Malignancies. Trends in Cancer. 2017;3:282–292. doi: 10.1016/j.trecan.2017.02.006. [DOI] [PMC free article] [PubMed] [Google Scholar]
- Fu Y, Sinha M, Peterson CL, Weng Z. The insulator binding protein CTCF positions 20 nucleosomes around its binding sites across the human genome. PLoS genetics. 2008;4:e1000138. doi: 10.1371/journal.pgen.1000138. [DOI] [PMC free article] [PubMed] [Google Scholar]
- Fudenberg G, Imakaev M, Lu C, Goloborodko A, Abdennur N, Mirny LA. Formation of Chromosomal Domains by Loop Extrusion. Cell Rep. 2016;15:2038–2049. doi: 10.1016/j.celrep.2016.04.085. [DOI] [PMC free article] [PubMed] [Google Scholar]
- Goloborodko A, Imakaev MV, Marko JF, Mirny L. Compaction and segregation of sister chromatids via active loop extrusion. eLife. 2016;5 doi: 10.7554/eLife.14864. [DOI] [PMC free article] [PubMed] [Google Scholar]
- Gough SM, Slape CI, Aplan PD. NUP98 gene fusions and hematopoietic malignancies: common themes and new biologic insights. Blood. 2011;118:6247–6257. doi: 10.1182/blood-2011-07-328880. [DOI] [PMC free article] [PubMed] [Google Scholar]
- Grant CE, Bailey TL, Noble WS. FIMO: scanning for occurrences of a given motif. Bioinformatics. 2011;27:1017–1018. doi: 10.1093/bioinformatics/btr064. [DOI] [PMC free article] [PubMed] [Google Scholar]
- Haarhuis JHI, van der Weide RH, Blomen VA, Yanez-Cuna JO, Amendola M, van Ruiten MS, Krijger PHL, Teunissen H, Medema RH, van Steensel B, et al. The Cohesin Release Factor WAPL Restricts Chromatin Loop Extension. Cell. 2017;169:693–707 e614. doi: 10.1016/j.cell.2017.04.013. [DOI] [PMC free article] [PubMed] [Google Scholar]
- Haffner MC, Aryee MJ, Toubaji A, Esopi DM, Albadine R, Gurel B, Isaacs WB, Bova GS, Liu W, Xu J, et al. Androgen-induced TOP2B-mediated double strand breaks and prostate cancer gene rearrangements. Nature genetics. 2010;42:668–675. doi: 10.1038/ng.613. [DOI] [PMC free article] [PubMed] [Google Scholar]
- Hakim O, Resch W, Yamane A, Klein I, Kieffer-Kwon KR, Jankovic M, Oliveira T, Bothmer A, Voss TC, Ansarah-Sobrinho C, et al. DNA damage defines sites of recurrent chromosomal translocations in B lymphocytes. Nature. 2012;484:69–74. doi: 10.1038/nature10909. [DOI] [PMC free article] [PubMed] [Google Scholar]
- Ju BG, Lunyak VV, Perissi V, Garcia-Bassets I, Rose DW, Glass CK, Rosenfeld MG. A topoisomerase IIbeta-mediated dsDNA break required for regulated transcription. Science. 2006;312:1798–1802. doi: 10.1126/science.1127196. [DOI] [PubMed] [Google Scholar]
- Karolchik D, Hinrichs AS, Furey TS, Roskin KM, Sugnet CW, Haussler D, Kent WJ. The UCSC Table Browser data retrieval tool. Nucleic acids research. 2004;32:D493–496. doi: 10.1093/nar/gkh103. [DOI] [PMC free article] [PubMed] [Google Scholar]
- Katainen R, Dave K, Pitkanen E, Palin K, Kivioja T, Valimaki N, Gylfe AE, Ristolainen H, Hanninen UA, Cajuso T, et al. CTCF/cohesin-binding sites are frequently mutated in cancer. Nature genetics. 2015;47:818–821. doi: 10.1038/ng.3335. [DOI] [PubMed] [Google Scholar]
- Katyal S, Lee Y, Nitiss KC, Downing SM, Li Y, Shimada M, Zhao J, Russell HR, Petrini JH, Nitiss JL, et al. Aberrant topoisomerase-1 DNA lesions are pathogenic in neurodegenerative genome instability syndromes. Nat Neurosci. 2014;17:813–821. doi: 10.1038/nn.3715. [DOI] [PMC free article] [PubMed] [Google Scholar]
- Kent WJ, Sugnet CW, Furey TS, Roskin KM, Pringle TH, Zahler AM, Haussler D. The human genome browser at UCSC. Genome research. 2002;12:996–1006. doi: 10.1101/gr.229102. [DOI] [PMC free article] [PubMed] [Google Scholar]
- Kieffer-Kwon KR, Tang Z, Mathe E, Qian J, Sung MH, Li G, Resch W, Baek S, Pruett N, Grontved L, et al. Interactome maps of mouse gene regulatory domains reveal basic principles of transcriptional regulation. Cell. 2013;155:1507–1520. doi: 10.1016/j.cell.2013.11.039. [DOI] [PMC free article] [PubMed] [Google Scholar]
- Kouzine F, Wojtowicz D, Yamane A, Resch W, Kieffer-Kwon KR, Bandle R, Nelson S, Nakahashi H, Awasthi P, Feigenbaum L, et al. Global regulation of promoter melting in naive lymphocytes. Cell. 2013;153:988–999. doi: 10.1016/j.cell.2013.04.033. [DOI] [PMC free article] [PubMed] [Google Scholar]
- Krivtsov AV, Figueroa ME, Sinha AU, Stubbs MC, Feng Z, Valk PJ, Delwel R, Dohner K, Bullinger L, Kung AL, et al. Cell of origin determines clinically relevant subtypes of MLL-rearranged AML. Leukemia : official journal of the Leukemia Society of America, Leukemia Research Fund, UK. 2013;27:852–860. doi: 10.1038/leu.2012.363. [DOI] [PMC free article] [PubMed] [Google Scholar]
- Langmead B, Trapnell C, Pop M, Salzberg SL. Ultrafast and memory-efficient alignment of short DNA sequences to the human genome. Genome biology. 2009;10:R25. doi: 10.1186/gb-2009-10-3-r25. [DOI] [PMC free article] [PubMed] [Google Scholar]
- Li H, Handsaker B, Wysoker A, Fennell T, Ruan J, Homer N, Marth G, Abecasis G, Durbin R, Genome Project Data Processing, S The Sequence Alignment/Map format and SAMtools. Bioinformatics. 2009;25:2078–2079. doi: 10.1093/bioinformatics/btp352. [DOI] [PMC free article] [PubMed] [Google Scholar]
- MacPherson MJ, Sadowski PD. The CTCF insulator protein forms an unusual DNA structure. BMC Mol Biol. 2010;11:101. doi: 10.1186/1471-2199-11-101. [DOI] [PMC free article] [PubMed] [Google Scholar]
- Madabhushi R, Gao F, Pfenning AR, Pan L, Yamakawa S, Seo J, Rueda R, Phan TX, Yamakawa H, Pao PC, et al. Activity-Induced DNA Breaks Govern the Expression of Neuronal Early-Response Genes. Cell. 2015;161:1592–1605. doi: 10.1016/j.cell.2015.05.032. [DOI] [PMC free article] [PubMed] [Google Scholar]
- Manville CM, Smith K, Sondka Z, Rance H, Cockell S, Cowell IG, Lee KC, Morris NJ, Padget K, Jackson GH, et al. Genome-wide ChIP-seq analysis of human TOP2B occupancy in MCF7 breast cancer epithelial cells. Biol Open. 2015;4:1436–1447. doi: 10.1242/bio.014308. [DOI] [PMC free article] [PubMed] [Google Scholar]
- Mathelier A, Zhao X, Zhang AW, Parcy F, Worsley-Hunt R, Arenillas DJ, Buchman S, Chen CY, Chou A, Ienasescu H, et al. JASPAR 2014: an extensively expanded and updated open-access database of transcription factor binding profiles. Nucleic acids research. 2014;42:D142–147. doi: 10.1093/nar/gkt997. [DOI] [PMC free article] [PubMed] [Google Scholar]
- McKinnon PJ. Topoisomerases and the regulation of neural function. Nat Rev Neurosci. 2016;17:673–679. doi: 10.1038/nrn.2016.101. [DOI] [PMC free article] [PubMed] [Google Scholar]
- Meaburn KJ, Misteli T, Soutoglou E. Spatial genome organization in the formation of chromosomal translocations. Semin Cancer Biol. 2007;17:80–90. doi: 10.1016/j.semcancer.2006.10.008. [DOI] [PMC free article] [PubMed] [Google Scholar]
- Nakahashi H, Kwon KR, Resch W, Vian L, Dose M, Stavreva D, Hakim O, Pruett N, Nelson S, Yamane A, et al. A genome-wide map of CTCF multivalency redefines the CTCF code. Cell Rep. 2013;3:1678–1689. doi: 10.1016/j.celrep.2013.04.024. [DOI] [PMC free article] [PubMed] [Google Scholar]
- Nasmyth K. Disseminating the genome: joining, resolving, and separating sister chromatids during mitosis and meiosis. Annual review of genetics. 2001;35:673–745. doi: 10.1146/annurev.genet.35.102401.091334. [DOI] [PubMed] [Google Scholar]
- Naughton C, Avlonitis N, Corless S, Prendergast JG, Mati IK, Eijk PP, Cockroft SL, Bradley M, Ylstra B, Gilbert N. Transcription forms and remodels supercoiling domains unfolding large-scale chromatin structures. Nature structural & molecular biology. 2013;20:387–395. doi: 10.1038/nsmb.2509. [DOI] [PMC free article] [PubMed] [Google Scholar]
- Nichols MH, Corces VG. A CTCF Code for 3D Genome Architecture. Cell. 2015;162:703–705. doi: 10.1016/j.cell.2015.07.053. [DOI] [PMC free article] [PubMed] [Google Scholar]
- Pommier Y, Sun Y, Huang SN, Nitiss JL. Roles of eukaryotic topoisomerases in transcription, replication and genomic stability. Nature reviews Molecular cell biology. 2016;17:703–721. doi: 10.1038/nrm.2016.111. [DOI] [PMC free article] [PubMed] [Google Scholar]
- Quinlan AR, Hall IM. BEDTools: a flexible suite of utilities for comparing genomic features. Bioinformatics. 2010;26:841–842. doi: 10.1093/bioinformatics/btq033. [DOI] [PMC free article] [PubMed] [Google Scholar]
- Rao SS, Huntley MH, Durand NC, Stamenova EK, Bochkov ID, Robinson JT, Sanborn AL, Machol I, Omer AD, Lander ES, et al. A 3D map of the human genome at kilobase resolution reveals principles of chromatin looping. Cell. 2014;159:1665–1680. doi: 10.1016/j.cell.2014.11.021. [DOI] [PMC free article] [PubMed] [Google Scholar]
- Roche KW, Huganir RL. Synaptic expression of the high-affinity kainate receptor subunit KA2 in hippocampal cultures. Neuroscience. 1995;69:383–393. doi: 10.1016/0306-4522(95)00253-f. [DOI] [PubMed] [Google Scholar]
- Sanborn AL, Rao SS, Huang SC, Durand NC, Huntley MH, Jewett AI, Bochkov ID, Chinnappan D, Cutkosky A, Li J, et al. Chromatin extrusion explains key features of loop and domain formation in wild-type and engineered genomes. Proceedings of the National Academy of Sciences of the United States of America. 2015;112:E6456–6465. doi: 10.1073/pnas.1518552112. [DOI] [PMC free article] [PubMed] [Google Scholar]
- Schmidt D, Schwalie PC, Wilson MD, Ballester B, Goncalves A, Kutter C, Brown GD, Marshall A, Flicek P, Odom DT. Waves of retrotransposon expansion remodel genome organization and CTCF binding in multiple mammalian lineages. Cell. 2012;148:335–348. doi: 10.1016/j.cell.2011.11.058. [DOI] [PMC free article] [PubMed] [Google Scholar]
- Schneider CA, Rasband WS, Eliceiri KW. NIH Image to ImageJ:25 years of image analysis. Nature methods. 2012;9:671–675. doi: 10.1038/nmeth.2089. [DOI] [PMC free article] [PubMed] [Google Scholar]
- Sordet O, Redon CE, Guirouilh-Barbat J, Smith S, Solier S, Douarre C, Conti C, Nakamura AJ, Das BB, Nicolas E, et al. Ataxia telangiectasia mutated activation by transcription- and topoisomerase I-induced DNA double-strand breaks. EMBO reports. 2009;10:887–893. doi: 10.1038/embor.2009.97. [DOI] [PMC free article] [PubMed] [Google Scholar]
- Tubbs A, Nussenzweig A. Endogenous DNA Damage as a Source of Genomic Instability in Cancer. Cell. 2017;168:644–656. doi: 10.1016/j.cell.2017.01.002. [DOI] [PMC free article] [PubMed] [Google Scholar]
- Uuskula-Reimand L, Hou H, Samavarchi-Tehrani P, Rudan MV, Liang M, Medina-Rivera A, Mohammed H, Schmidt D, Schwalie P, Young EJ, et al. Topoisomerase II beta interacts with cohesin and CTCF at topological domain borders. Genome biology. 2016;17:182. doi: 10.1186/s13059-016-1043-8. [DOI] [PMC free article] [PubMed] [Google Scholar]
- Vietri Rudan M, Barrington C, Henderson S, Ernst C, Odom DT, Tanay A, Hadjur S. Comparative Hi-C reveals that CTCF underlies evolution of chromosomal domain architecture. Cell Rep. 2015;10:1297–1309. doi: 10.1016/j.celrep.2015.02.004. [DOI] [PMC free article] [PubMed] [Google Scholar]
- Witcher M, Emerson BM. Epigenetic silencing of the p16(INK4a) tumor suppressor is associated with loss of CTCF binding and a chromatin boundary. Molecular cell. 2009;34:271–284. doi: 10.1016/j.molcel.2009.04.001. [DOI] [PMC free article] [PubMed] [Google Scholar]
- Wright RL, Vaughan AT. A systematic description of MLL fusion gene formation. Crit Rev Oncol Hematol. 2014;91:283–291. doi: 10.1016/j.critrevonc.2014.03.004. [DOI] [PubMed] [Google Scholar]
- Yang F, Kemp CJ, Henikoff S. Anthracyclines induce double-strand DNA breaks at active gene promoters. Mutation research. 2015;773:9–15. doi: 10.1016/j.mrfmmm.2015.01.007. [DOI] [PMC free article] [PubMed] [Google Scholar]
- Yang X, Li W, Prescott ED, Burden SJ, Wang JC. DNA topoisomerase IIbeta and neural development. Science. 2000;287:131–134. doi: 10.1126/science.287.5450.131. [DOI] [PubMed] [Google Scholar]
- Zhang Y, Liu T, Meyer CA, Eeckhoute J, Johnson DS, Bernstein BE, Nusbaum C, Myers RM, Brown M, Li W, et al. Model-based analysis of ChIP-Seq (MACS) Genome biology. 2008;9:R137. doi: 10.1186/gb-2008-9-9-r137. [DOI] [PMC free article] [PubMed] [Google Scholar]
- Zhang Y, McCord RP, Ho YJ, Lajoie BR, Hildebrand DG, Simon AC, Becker MS, Alt FW, Dekker J. Spatial organization of the mouse genome and its role in recurrent chromosomal translocations. Cell. 2012;148:908–921. doi: 10.1016/j.cell.2012.02.002. [DOI] [PMC free article] [PubMed] [Google Scholar]
- Zhang Y, Rowley JD. Chromatin structural elements and chromosomal translocations in leukemia. DNA repair. 2006;5:1282–1297. doi: 10.1016/j.dnarep.2006.05.020. [DOI] [PubMed] [Google Scholar]
Associated Data
This section collects any data citations, data availability statements, or supplementary materials included in this article.
Supplementary Materials
(A) Transcriptional activity measured as total RNA content, stained by pyronin Y, between resting and 12h activated B cells (left panel, resting in red, 12h activated in blue). DNA replication as measured by 5-ethynyl-2'-deoxyuridine (EdU) incorporation in the newly synthesized DNA at 12h (middle panel) and 24h (right panel) activated B cells. Percentage of cells positive for EdU is indicated. (B) Tmprss2 locus showing RNA synthesis (GRO-seq) and DSB profiles in activated B-cells. Tmprss2 is not expressed in B cells but shows DSBs. The actively transcribed MLL locus is shown below as a comparison. Arrow indicates direction of transcription. (C) Close-up view of MLL (upper panel) and Tmprss2 (lower panel) at breakpoint cluster regions showing DSBs in the human cancer cell lines Nalm-6 and MCF-7; below, CTCF occupancy in MCF-7. The breakpoint cluster region is represented as a black rectangle and arrow represents direction of transcription. (D) Venn diagram shows the overlap of spontaneous and ETO induced DSBs measured in 12 hour activated B cells.
(A) Comparison of ETO-induced DSB levels and the transcriptional activity at the break sites quantified by END-seq and nascent RNA-seq respectively for 12 hours activated B cells. (B) Comparison of the ratio of transcription activity, measured by nascent RNA, and DSBs levels in 12 hours activated B-cells vs. resting B-cells (Spearman correlation, ρ=0.35). (C) MLL and Tmprss2 break cluster regions showing normalized DSB profiles in resting (top) and 12 hour activated B cells (bottom). (D) Venn diagram showing number of ETO-induced DSBs in resting and 12 hour activated B cells. (E) Comparison of ETO-induced DSBs levels quantified by END-seq between resting and 12 hour activated B-cells (Spearman correlation, ρ=0.56, p<1×10⁻¹⁵, median activated/resting ratio −1.06). (F) 12 hour activated B cells were assessed for nascent RNA synthesis (red, pulse labeled with EU for 30 minutes) and γ-H2AX induction (green) after either pre-incubation or not with the transcription initiation inhibitor Triptolide (3 uM for 90 minutes) followed or not by ETO treatment (50 uM for 30 minutes). Scale bar in white is 50 µm. (G) ETO-induced DSBs levels quantified by END-seq with (y-axis) or without (x-axis) Triptolide pre-incubation. DSBs sites are either insensitive to Triptolide (black), or decrease greater than 2-fold (light red) or 3- fold (dark red) upon Triptolide pre-incubation. DSB sites (shown in blue) overlap with CTCF binding. The internal graph compares the overlap with CTCF for each Triptolide sensitive category (Fisher’s exact test, p<5×10⁻⁵).
(A) Left panel: Venn diagram shows the overlap between ETO-induced DSBs and CTCF binding in 12h activated B cells (left) compared to the overlap between the same number and length of randomly picked ATAC-seq sites and CTCF binding in 12h activated B cells (right) (Fisher’s exact test; p<1×10⁻¹⁵). Right panel: Whisker plot comparing GC content at END-seq peaks, CTCF and random regions. (B) Genome-wide distribution of ETO-induced DSBs (number in brackets indicate the genome-wide fraction of each region). Transcriptional start sites (TSS) were defined as within 2 kilobases surrounding the TSS. Active promoters were defined as TSS+ H3K4me3+, and active enhancers were defined as H3K27Ac+ regions that were not promoters. (C) Percentage of Pol II-mediated DSB+ loop borders that have either both anchors overlapping with DSBs or only one (observed), compared to randomly paired anchors (expected) (Fisher’s exact test, p<1×10−37). (D) Frequency of overlap between CTCF (left) or RAD21 (right) occupancy and active promoters that are either associated or not with DSBs (Fisher’s exact test, p<1×10−120 for both). (E) Percentage of active promoters with and without DSBs. (F) Close-up view of oncogenic breakpoint cluster regions showing DSB profiles upon ETO treatment (measured by END-seq) and RAD21 occupancy (measured by ChIP-seq) in activated B-cells. (G) Comparison of ETO-induced DSB levels and the transcriptional activity at the break sites quantified by END-seq and nascent RNA-seq respectively for resting B-cells (top) and activated T-cells (bottom). (H) Aggregate plot of DSBs and CTCF binding at TSS-associated and non-TSSs sites. Plot extends +/− 500bp from the CTCF motif (dashed line). See also Figure 4G.
(A) Close-up views of the Hi-C interactions within MLL, AF4, ENL and TRMPSS2 showing (from top to bottom) DSBs profiles upon ETO, CTCF and RAD21 occupancy, and Hi-C chromatin loop interactions with resolution 5kb. The number of Hi-C lines is proportional to interaction strength. G-rich and C-rich orientation of the CTCF motifs are shown as blue and orange arrows, respectively. The position of breakpoint cluster regions (BCR) are indicated by red arrows.
(A) Spearman correlation coefficient between DSBs and either RAD21, TOP2B, CTCF, ATAC-seq, and H3K27Ac tested at CTCF binding sites (and the surrounding 500 bps) that bind CTCF and RAD21. (B) RAD21 and TOP2B binding are correlated. (C) Linear regression model was performed with END-seq levels as the response variable. Predictor variables were added in the order of their correlation with END-seq (as determined in Figure S5A). Right panel shows that RAD21 levels can, by themselves, predict DSB intensity, and there is no increase in prediction quality upon inclusion of additional parameters. (D) Left panel: comparison of the ratio of RAD21 occupancy and DSBs levels in 12 hours activated B-cells vs. activated T-cells (Spearman correlation, ρ=0.79). Right panel: comparison of the ratio of transcription, measured by nascent RNA, and DSBs levels in 12 hour activated B-cells vs. activated T-cells (Spearman correlation, ρ=0.32). (E) Example of a syntenic region in mouse and dog between the genes Ptpn5- Zdhhc13 that gave rise of an insertion in mouse as shown in (Vietri Rudan et al., 2015). Close-up view shows DSBs profiles upon ETO treatment, and CTCF/RAD21 occupancy in activated B cells. Vietri Rudan et al. demonstrated that a cluster of non-orthologous Mrgpr genes (blue) has been inserted in mouse between the orthologous genes Ptpn5 and Zdhhc13 (highlighted in red). The inserted region (in yellow bordered with a dashed line) forms its own nested chromosomal domain structure, probably because of gene duplication events. DSBs upon ETO localize at binding sites of CTCF and RAD21 that flank this duplication event.
cBioPortal OncoPrint graphical representation showing the alteration and co-occurrence/exclusivity of 11 genes across 191 Acute Myeloid Leukemia ((Cancer Genome Atlas Research et al., 2013) samples. There is a tendency (log of the odds ratio <−3) of mutual exclusivity between mutations affecting KMT2A and mutations in CTCF, RAD21, SMC3 and TOP2A.