Supplemental digital content is available in the text.
Abstract
Background
Outcome after liver transplantation (LT) is determined by donor, transplant and recipient risk factors. These factors may have different impact on either patient or graft survival (outcome type). In the literature, there is wide variation in the use of outcome types and points in time (short term or long term). Objective of this study is to analyze the predictive capacity of risk factors and risk models in LT and how they vary over time and per outcome type.
Methods
All LTs performed in the Netherlands from January 1, 2002, to December 31, 2011, were analyzed with multivariate analyses at 3-month, 1-year, and 5-year for patient and (non-)death-censored graft survival. The predictive capacity of the investigated risk models was compared with concordance indices.
Results
Recipient age, model for end-stage liver disease sodium, ventilatory support, diabetes mellitus, hepatocellular carcinoma, previous malignancy, hepatitis C virus antibody, hepatitis B virus antibody, perfusion fluid, and Eurotransplant donor risk index (ET-DRI) had significant impact on outcome (graft or patient survival) at 1 or multiple points in time. Significant factors at 3-month patient survival (recipient age, model for end-stage liver disease sodium, ventilatory support) were used to compose a concept model. This model, had a higher c-index than the balance-of-risk score, DRI, ET-DRI, donor-recipient model and simplified recipient risk index for long-term patient and non–death-censored graft survival.
Conclusions
In this study, the effects of recipient risk factors and models on different outcome types and time points were shown. Short-term patient survival mainly depends on recipient risk factors, long-term graft survival on donor risk factors and is more difficult to predict. Next to the concept model, the donor-recipient model has a higher predictive capacity to other risk models for (long-term) patient and non–death-censored graft survival. The DRI and ET-DRI best predicted death-censored graft survival. Knowledge about risk factors and models is critical when using these for waitlist management and/or help in organ allocation and decision-making.
Outcome after liver transplantation (LT) is determined by multiple factors, among which donor, transplant and recipient risk factors play a crucial role. Previous studies have identified several of these risk factors and computed risk models in an attempt to predict this outcome. The survival outcomes following liver transplantation (SOFT) score,1 donor model for end-stage liver disease (D-MELD),2 the balance of risk (BAR) score3 and risk model by Burroughs et al4 all use combinations of donor, transplant and recipient factors in 1 model, whereas the donor risk index (DRI)5 and Eurotransplant DRI (ET-DRI)6 consist of donor and transplant factors.
Donor and transplant risk is best indicated by the DRI5 for the United Network for Organ Sharing (UNOS) region and ET-DRI6 for the Eurotransplant region. Our recent study on donor-recipient matching demonstrated that the use of a combination of a donor risk model with a recipient risk model in a donor-recipient model (DRM) had a better prediction of outcome after LT, than a donor model or recipient model alone.7 One of the drawbacks of this study was the fact that the recipient model only consisted of an analysis with basic recipient-related factors that are registered in the Eurotransplant database. These basic recipient factors were used to create a “simplified” recipient risk index (sRRI). An analysis to create a recipient risk model that encompasses more factors might be more accurate for the prediction of patient or graft survival after LT.
When evaluating donor risk models and donor-recipient risk models computed with data from large registries (Organ Procurement and Transplantation Network, European Liver Transplant Registry, Eurotransplant and the UK) in the past decade (Table 1), it is remarkable that every model is either based on patient survival or graft survival, with either short or long-term follow-up. Ideally, relevant information on pretransplant risk factors that influence posttransplant outcome should be available at the time of an organ offer. However, when choosing one of the above described models, one should at that time already have the desired endpoint in mind. A sophisticated tool to assess the specific risks of the recipient at multiple time points, that looks at patient as well as graft survival, does not yet exist. Furthermore, when analyzing and reporting results and comparing them with the literature, these results should always be interpreted in the light of donor quality and recipient risks involved.
TABLE 1.
Donor and/or recipient risk models in the past decade with different end points (patient/graft survival) at different time points (short-/long-term survival)

The objective of this study is to analyze the varying risk and predictive capacity of (recipient) risk factors and risk models in LT in the Netherlands. To achieve this, we have to determine how the risks of these factors vary over time (impact at short versus long term survival) and per different types of outcome (patient versus graft survival). Furthermore, we compare these risk factors with existing risk models.
MATERIALS AND METHODS
Study Design
Data from all LTs (including repeated transplants) performed in the Netherlands from January 1, 2002, to December 31, 2011, were included. Patients transplanted with a combined transplant were excluded, except for patients transplanted with a combined liver-kidney transplantation. All livers were recovered from deceased donors and were transplanted into adult recipients (≥18 years). Donor, transplant, basic recipient factors, and follow-up data were obtained from the Netherlands Organ Transplant Registry, with consent of the scientific advisory committee and the department heads of the 3 Dutch liver transplant centers. Detailed information on recipient characteristics and follow-up were obtained directly from the transplant centers. No ethical statement was required according to European guidelines and Dutch law because data were anonymized, and patients were not (directly) involved and/or affected.
Statistical Analysis
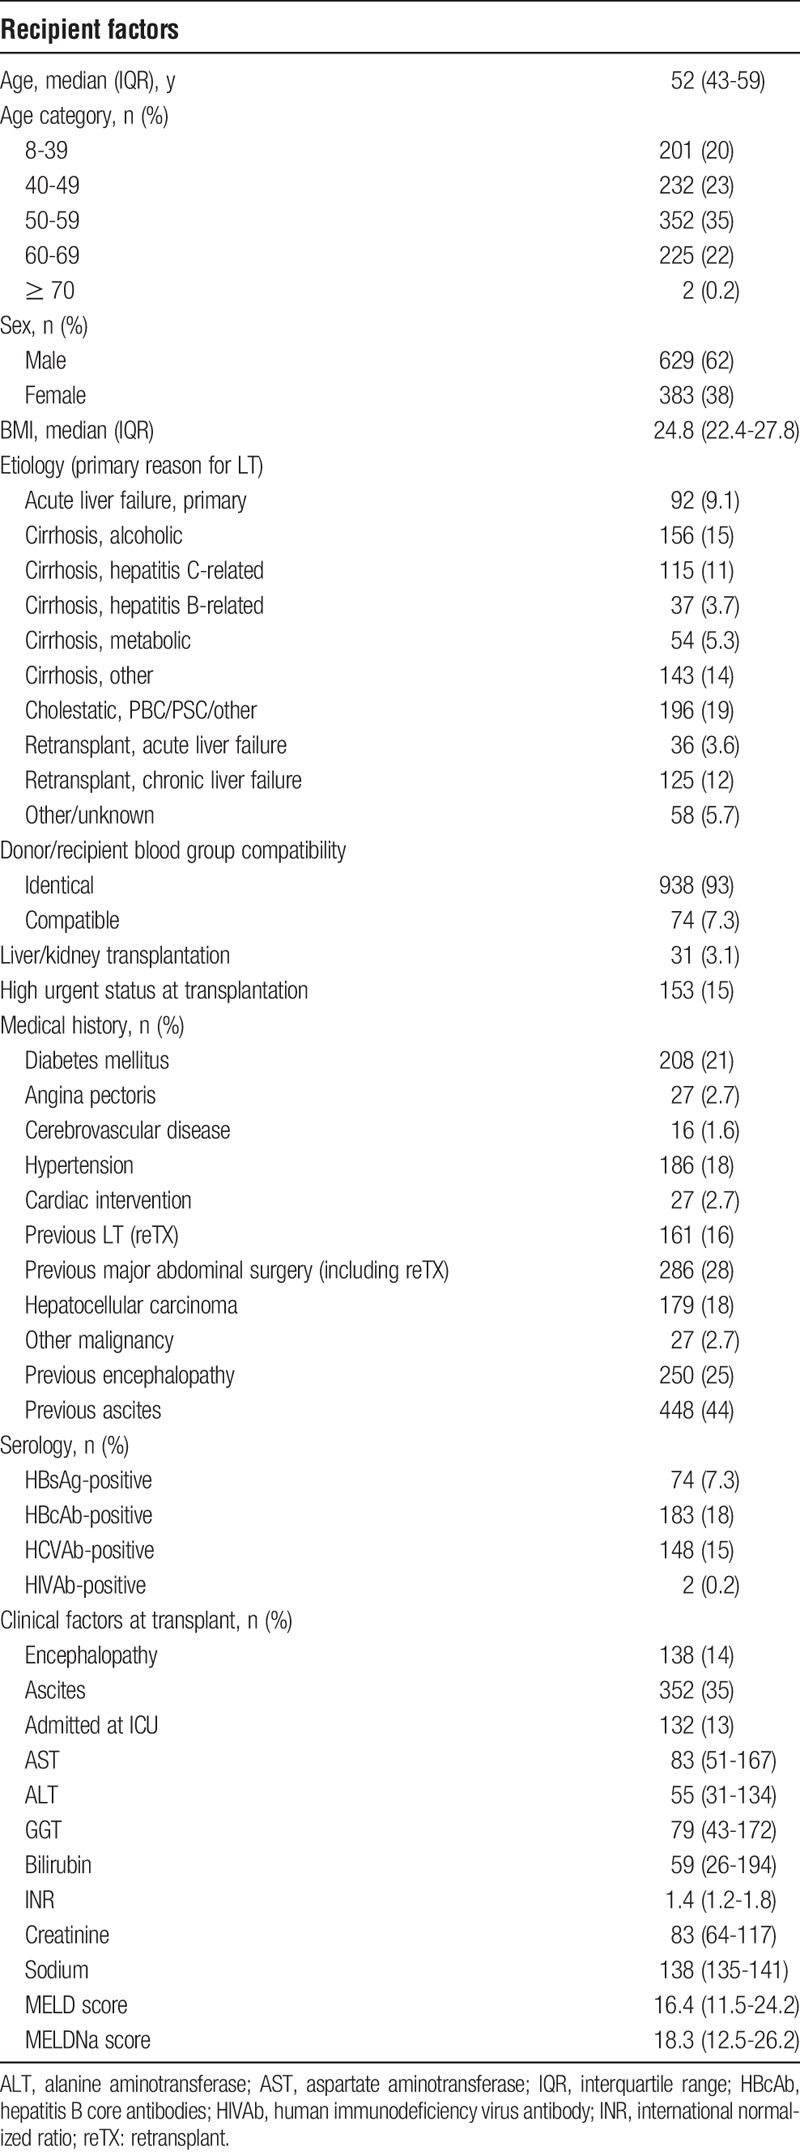
All available recipient characteristics (Table 2) were included in the statistical analysis. The ET-DRI was calculated to include donor risk in the multivariate analyses.6 In case of missing values for donor gamma-glutamyltransferase (GGT) and/or cold ischemia time (CIT) median values were used (GGT 28 U/L in 1.8% missing of the total, CIT 7.67 h in 0.9% missing of the total) to calculate the ET-DRI. For all recipients, the most recent model for end-stage liver disease (MELD) score before transplantation was calculated using the original formula with a lower limit of 1 for all variables and with creatinine capped at 4 mg/dL.8 If patients received renal replacement therapy according to Eurotransplant, the creatinine value was set at 4 mg/dL (as of December 16, 2006, implementation of the MELD score for liver allocation in the Eurotransplant region).9 The MELD score was capped at 40 and was rounded to the nearest whole value (range, 6-40). For the MELD sodium (MELDNa) score the formula from the original study by Kim et al10 was used. The BAR score was calculated, according to the formula described by Dutkowski et al3 The factor major abdominal surgery was defined and analyzed as follows: all types of major abdominal surgery such as bowel surgery exploratory laparotomy, previous LT, liver surgery, and so on (examples of nonmajor previous abdominal surgery: appendectomy, laparoscopic cholecystectomy, pylorotomy) and categorized as either no major abdominal surgery, previous LT, or other major abdominal surgery. The factor perfusion fluid was categorized as University of Wisconsin (UW) cold storage solution/other/unknown versus histidine-tryptophan-ketoglutarate (HTK) solution. A separate analysis of UW versus HTK, after exclusion of other and unknown, showed similar results (data not shown). To not lose too many patients for the study, we included the other/unknown patients in the UW group, as they showed similar results (data not shown).
TABLE 2.
Characteristics of all recipients transplanted in the Netherlands from 2002 to 2011
To determine a set of prognostic factors for further study, multivariate analyses were performed using Cox regression models with backward elimination and forward selection. Before multivariate analyses, all recipient laboratory values with a nonnormal distribution (alanine aminotransferase, aspartate aminotransferase, GGT, creatinine, and bilirubin) and the ET-DRI were converted to a logarithmic scale. All analyses were first performed 3 times; with the separate MELD components (creatinine, International Normalized Ratio and bilirubin), the calculated MELD score and the calculated MELDNa score. Both models (MELD and MELDNa) were significant, but because MELDNa was the more significant model, this was used in all analyses. The factors that were significant in these first set of multivariate analyses were then used in the next part of the analyses. Next, all multivariate Cox-regression analyses were performed separately for patient survival and graft survival (non–death-censored and death-censored), defined as follows:
-
-
Patient survival (PS): “the period between the date of transplantation and date of recipient death, (independent for cause of death).”
-
-
Graft survival, non–death-censored (GSNC): “the period between the date of transplantation and date of recipient death or date of retransplantation.”
-
-
Graft survival, death-censored (GSDC): “the period between the date of transplantation and date of retransplantation or the date of reregistration on the waiting list, only if followed by recipient death. Data were censored as of the date of recipient death for all patients that were not reregistered on the waitlist. Note that using this definition of death-censored graft survival, patients that were reregistered on the waiting list, but were not retransplanted nor died directly after the reregistration, were not regarded as graft failure.”
Administrative censoring applied at 3-months, 1-year, and 5-year follow-up. Administrative censoring was calculated after “x” months, specific emphasis for the factors that were significant at 3 months and so on. All analyses were anonymized for transplant center. Subsequently, multivariate analyses were performed, using all prognostic factors that were selected (significant at 0.05 level) in at least one of the previous analyses.
z Values were calculated for all significant factors from the multivariate analysis. The z value is the quotient of the regression coefficient of a risk factor and its standard error, with a significance level at 1.96 (standard error). Negative values have a protective effect for graft failure or patient death. Harrell's concordance index (c-index)11 was calculated to indicate the predictive capacity of the combination of factors at that specific time point and outcome type. The maximal c-index of the combination of all factors in the multivariate analysis was also calculated to get an indication of the maximal value that could be reached in this database (Supplemental Digital Content). Of course, such a model would be totally overfitted and this was only done to obtain an upper bound for a c-index in a clinical prediction model, based on currently registered variables. A concept model (CM) was constructed with the significant factors at 3 months patient survival as a proof of principle and was compared with the BAR score, DRI, ET-DRI, sRRI, and DRM by calculating c-indices for all models over time (from 3 months till 5 years posttransplant outcome). For all analyses, a Wald P value less than 0.05 was considered significant. Analyses and the calculation of the c-index were performed with R (version 3.3.2).
RESULTS
Donor, Transplant, and Recipient Factors
Included were 1012 deceased donor LTs, including 161 repeated transplants (16%), performed in the Netherlands in adult recipients, with a mean follow-up of 7.9 years. Recipient characteristics are shown in Table 2. Median recipient age was 52 years, with the majority of patients being transplanted for cholestatic disease (19%) or alcoholic cirrhosis (15%) or viral cirrhosis due to hepatitis B virus or hepatitis C virus (HCV) (14.8%).
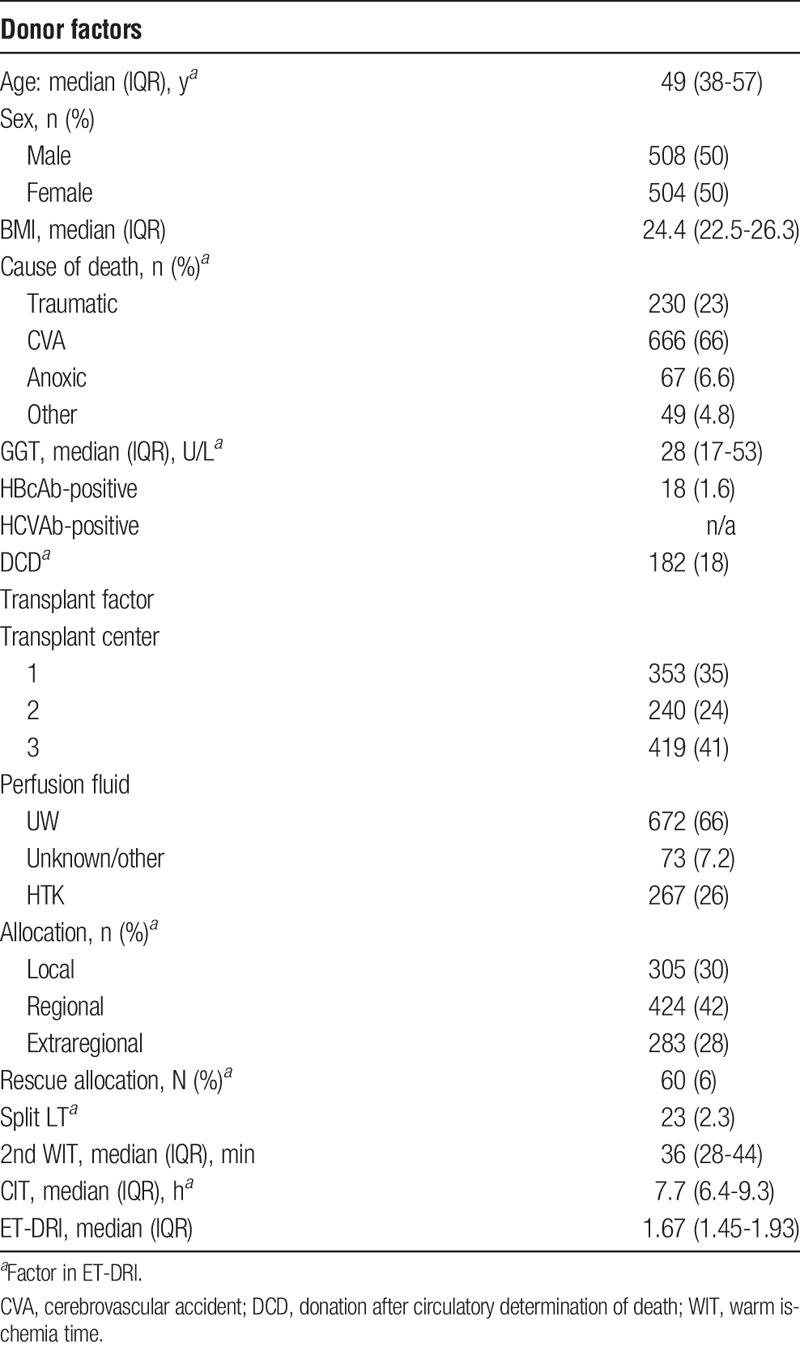
Donor and transplant factors are shown in Table 3. Median donor age was 49 years, the majority of donors had a cerebrovascular accident as cause of death (66%), and 18% of all allografts were obtained from donation after circulatory death donors. Overall median ET-DRI donor risk was 1.67.
TABLE 3.
Donor and transplant characteristics for deceased donor liver transplants performed in adults from 2002 to 2011 in the Netherlands
Multivariate Analysis of Recipient Risk Factors
A multivariate Cox regression analysis for 3 types of outcome (patient survival, non–death- and death-censored graft survival) at 3 time points (3-month, 1-year, and 5-year survivals) was performed. All the available recipient factors (Table 2), perfusion fluid (UW/other or HTK), transplant center, second warm ischemia time, and the ET-DRI were included. This resulted in 9 separate analyses. The hazard ratios of the factors that were significant at 1 or more points in time are shown in Table 4 (PS) and Table 5 (GSNS and GSDS). The c-index for the optimal combination of the significant factors at that specific time point, for that specific outcome type was calculated and shown below the involved significant factors. The log-hazard ratios of the significant factors are shown in Figure S1, SDC (http://links.lww.com/TXD/A127).
TABLE 4.
Results of the multivariate analysis of recipient risk factors according to 3-month, 1-year, and 5-year patient survivals
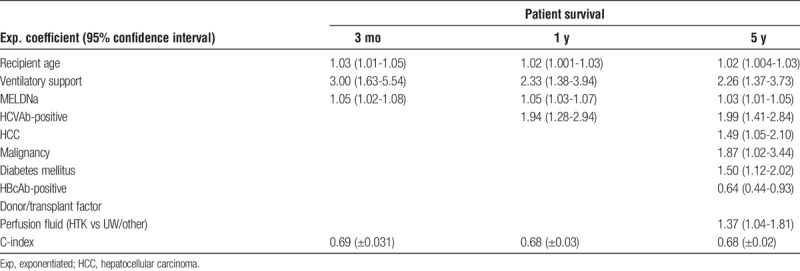
TABLE 5.
Results of the multivariate analysis of recipient risk factors according to 3-month, 1-year, and 5-year non–death-censored and death-censored graft survivals
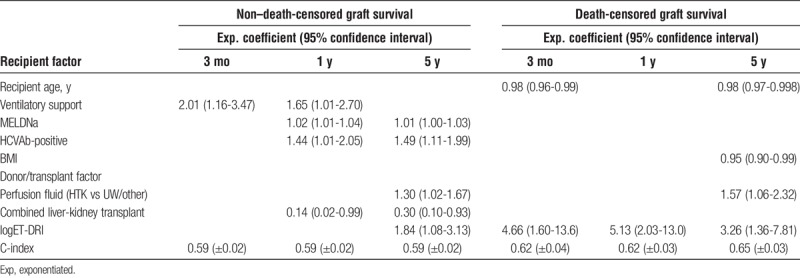
Figure 1 shows the z values of the significant factors over time for patient survival (Figure 1A), non–death-censored graft survival (Figure 1B) and death-censored graft survival (Figure 1C). The z value is the reflection of the importance of that factor at that time point. These figures demonstrate that the risk of every factor varies over time (short term vs long term) and changes when looking at either patient or graft survival. For example, in Figure 1A, the importance of the factor HCV antibody (HCVAb) for decreased patient survival is negligible until about 6 months and becomes and remains significant as of that point.
FIGURE 1.
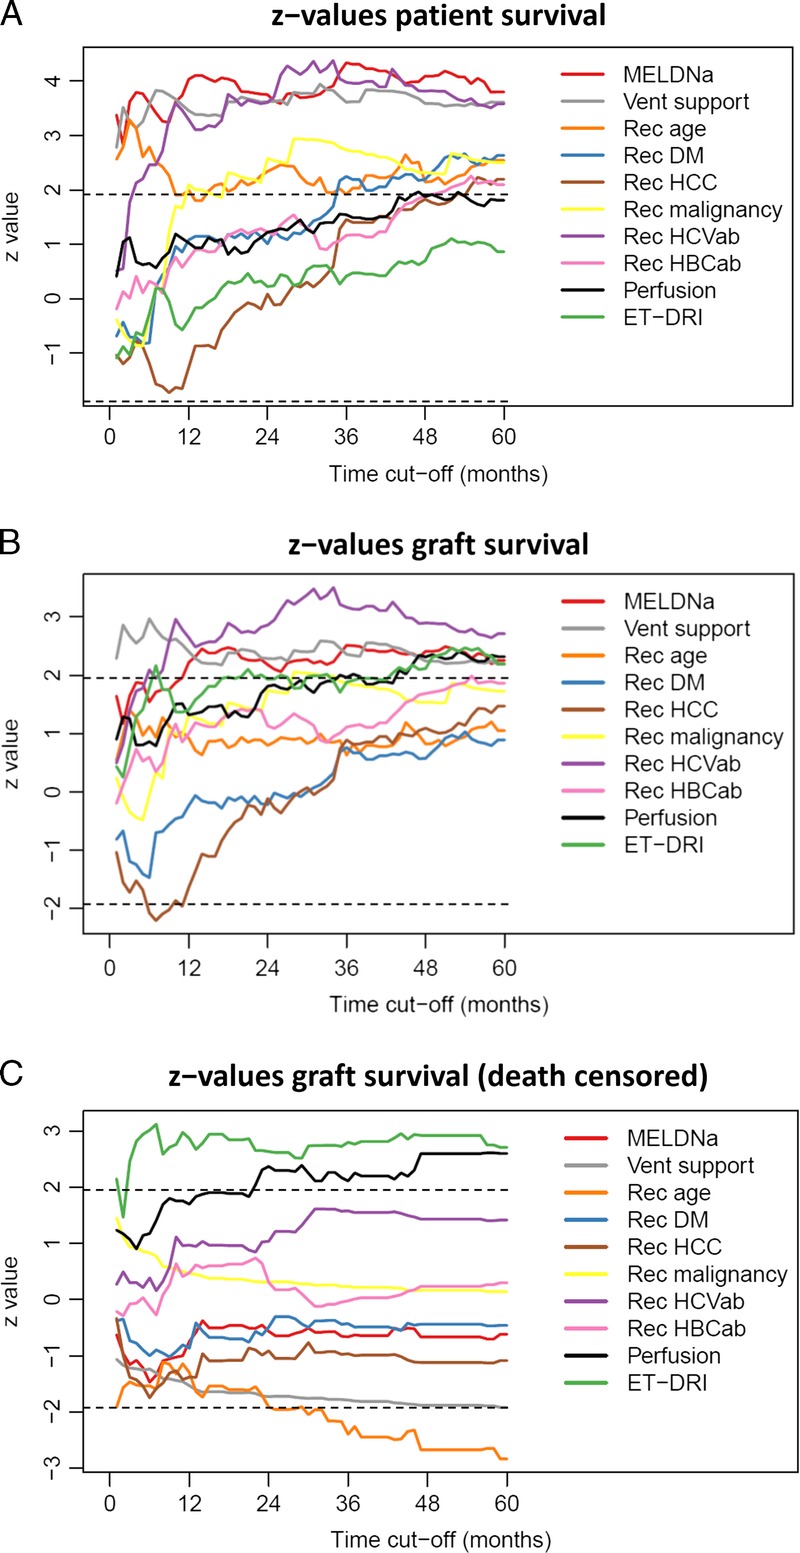
A, Z values for recipient risk factors, perfusion fluid and (log-)ET-DRI with patient survival as outcome over 5 years time. B, z values for recipient risk factors, perfusion fluid and (log-)ET-DRI with (non–death-censored) graft survival as outcome over 5 years time. C, Z values for recipient risk factors, perfusion fluid and (log-)ET-DRI with (death-censored) graft survival as outcome over 5 years' time.
As a demonstration of this concept, the validity of the significant recipient risk factors at 3-month patient survival, recipient age (P < 0.001), MELD-Na (P < 0.001), and ventilatory support (P < 0.001) were used to compose a “concept model.” This CM is the most suited to predict patient survival at 3 months in this database (P < 0.001; c-index, 0.69) and is used in the following analyses as a surrogate recipient risk model and subsequently for the sole reason to function as a proof of principle.
Comparison of Risk Models
As a first step, the BAR score and ET-DRI were validated in our data set for the type of outcome and time point they were originally constructed for. The BAR score was validated for 3-month patient survival (P < 0.001; c-index, 0.69). The ET-DRI was validated for 5-year graft survival (P = 0.002; c-index, 0.55).
Next, the c-indices of the DRI, ET-DRI, BAR-score, sRRI, DRM, CM, and combination of CM with ET-DRI were calculated (all as continuous models) for the 3 outcome measures and 3 time points, to compare their predictive capacity. The c-indices of these models are depicted in Figure 2; for patient survival (Figure 2A), non–death-censored graft survival (Figure 2B) and death-censored graft survival (Figure 2C), the values are described in Table 6.
FIGURE 2.
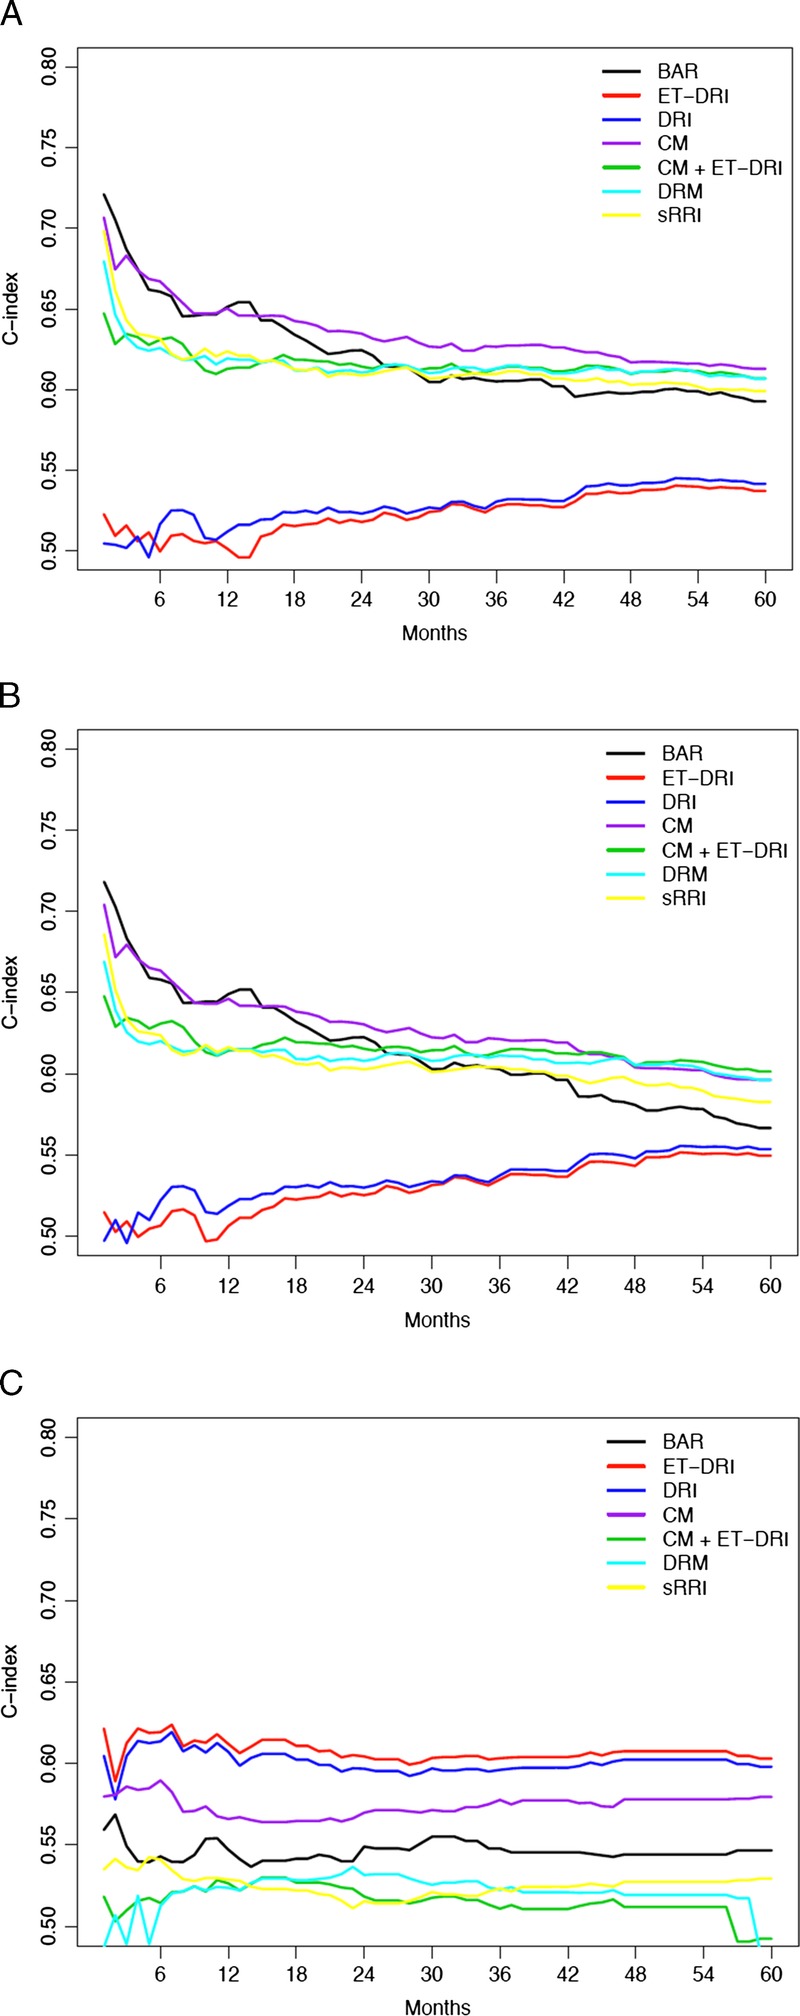
A, Concordance indices of risk models with patient survival as outcome over 5 years' time. B, Concordance indices of risk models with non–death-censored graft survival as outcome over 5 years' time. C, Concordance indices of risk models with death-censored graft survival as outcome over 5 years' time.
TABLE 6.
C-indices of the investigated risk model for PS, GSNC, and GSDC at 3 months, 1 year, and 5 years
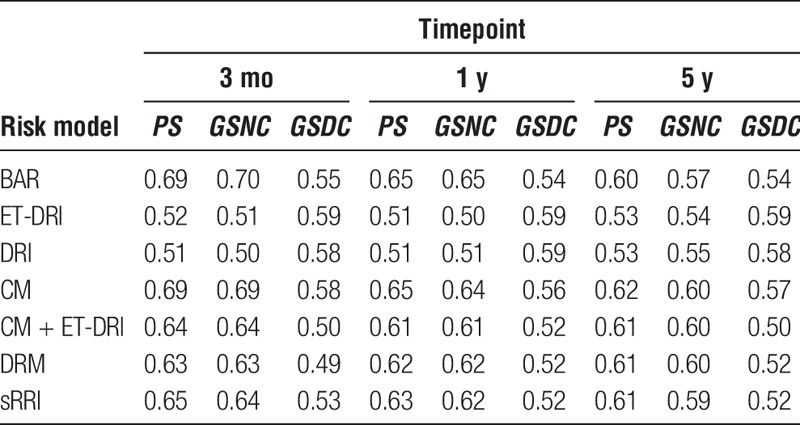
The change in the predictive capacity of the models is demonstrated over time with the difference in c-indices per outcome type (patient vs graft survival). The BAR score and CM seem to have the highest c-index for short-term patient survival (Figure 2A), but this decreases over time. As of circa 16 months of follow-up, the CM has the highest predictive capacity for patient survival. For non–death-censored graft survival (Figure 2B), the BAR and CM have comparable predictive capacity at short-term survival, but the CM, CM/ET-DRI, and DRM have the highest predictive capacity at the long-term follow-up. For death-censored graft survival (Figure 2C), the ET-DRI has a continuous higher predictive capacity than the other risk models.
To show the absolute maximum of what may be possible to achieve, the maximal c-indices of the combination of all significant factors (Figure S2, SDC, http://links.lww.com/TXD/A128) and the combination of all available factors (Figure S3, SDC, http://links.lww.com/TXD/A129) were calculated for all 3 outcome measurements. Of course, such models are totally overfitted and therefore not usable in (clinical) practice.
DISCUSSION
This study provides insight into the changing importance of (recipient) risk factors and donor/recipient risk models over time (short term vs long term) and per outcome type (patient survival vs graft survival). The main focus of this study was to demonstrate the differences in outcome type and period (for the in this study included recipient risk factors). This was demonstrated by analyzing a decade of LTs performed in the Netherlands with a long-term follow-up (mean, 7.9 years). The provided knowledge can be used to assess the risks involved in clinical decision-making. Besides a great variety in the factors that are used in the studied risk models (either donor, transplant and/or recipient risk factors), these models are incomparable when looking at the type of outcome that is intended to predict: patient survival versus graft survival and short-term versus long-term outcome. This makes it difficult to perform a valid comparison with regard to their capability of predicting outcome after LT, reflected by the c-index.
The BAR score and ET-DRI were first validated in the data set for their original endpoint and outcome type. Additionally, a multivariate analysis was performed including all (available) recipient risk factors and significant donor and transplant factors (ET-DRI and perfusion fluid) to determine which factors influence outcome after LT. As shown in Figures 1A to C, the importance of the significant factors varies over time and across outcome types. Factors with an absolute z-value greater than 1.96 are significantly associated with outcome (Tables 4 and 5). As a demonstration of this principle, the significant factors at 3-month patient survival (recipient age, ventilatory support and MELDNa) were used to construct a concept model. This is to demonstrate that a risk model changes (or should change) per chosen type of outcome (in this case patient survival) and point in time (in this case short-term [3 months] follow-up). The factors included in the appropriate model are chosen according to or determined by to results of the multivariate analysis for that specific time point and outcome type. So, in this case, we created a risk model that is the most appropriate to predict 3-month patient survival, consisting of the 3 significant factors at that time point: recipient age, MELD-Na and ventilatory support. The comparison of c-indices showed that the combination of factors significant at short-term (3 months) patient survival are important to indicate short-term patient risk, but also long-term patient and graft survival (purple line in Figures 2A and B). In our database, the CM was comparable to the BAR-score for short-term outcome and seemed superior to all other models for long-term outcome.
When looking at non–death-censored graft survival, the CM and BAR had comparable c-indices short-term, but the CM was comparable to the combination of ET-DRI with the CM and the DRM (long term). The results of the death-censored graft survival analyses showed that the ET-DRI has the highest c-index over time and would have our preference to the other risk models. Overall, our results clearly show that patient survival mainly depends on the condition of the recipient, whereas death-censored graft survival predominantly depends on the quality of the liver graft itself. Non–death-censored graft survival reflects both, which is a consequence of its definition. Even though the outcome of a complex procedure like an LT is very difficult to predict, we have shown the best predictive models (in our opinion) with their limitations. Although limited, these models are still much better than not validated, sometimes only theoretical parameters or even expert opinion. Furthermore, predictive models are essential in case-mix correction and/or outcome analysis. The results of our analyses actually show that the risk factors that were significantly associated with outcome are also relevant after a longer period. These factors are most relevant at the time of transplantation when selecting a suitable recipient.
For evaluation of outcome or for deciding whether to accept an organ offer or not, it is essential to understand the differences of predictive tools with regard to time and outcome. When comparing outcome data between various centers, regions, or countries, the data suggest that the DRM (combination of ET-DRI and sRRI) has the highest potential. Of all previously described models, the DRM gives a valid prediction of long-term patient and non–death-censored graft survival (c-index of 0.60). Furthermore, the DRM consist of a combination of donor, transplant, and recipient factors that are all available in most databases (UNOS and Eurotransplant). Donor quality is probably best reflected in death-censored graft survival analyses. The DRI and ET-DRI models best predict this outcome type, which is why we therefore prefer these models to describe donor quality. For short-term patient survival, one could either use the BAR score or CM. We prefer the latter because this model only includes recipient factors. In fact, the CM has the same parameters as the BAR, with the addition of donor age, CIT, retransplantation, and MELD-Na instead of MELD. Interestingly, retransplantation was not identified as a risk factor in this database.
This study has certain limitations. Because it is based on a retrospective database (from a single country), all donor-recipient combinations were already chosen by the transplant center, and liver allografts were allocated centrally (by Eurotransplant). The consequence is that certain (extreme) risk factors could have been missed due to not accepting such an organ for an LT. Theoretically, in a larger study cohort, there could be a chance of finding more significant risk factors; nevertheless, we proved that the abovementioned factors are of significant impact on outcome after LT in the Netherlands. In the end, the doctor in charge should overview all clinical data of the donor and the recipient before accepting the offer. It is difficult to weigh all factors, which is why risk models can be helpful in assessing the specific risks of the donor organ or recipient at the time of transplantation. In the analyzed models, every relevant risk factor seems to be included. A better prediction model or model with a higher c-index would therefore only be possible if other factors were added to one of these models. However, the question rises if it would even be possible to achieve such a higher c-index, because this would only be possible at the risk of overfitting the model to a specific database and thus losing the generalizability for a broader transplant population. Even though our recipient population differs from that in (for example) the United States, looking at the distribution of etiology of disease. In our database, the majority of patients is suffering from biliary tract related/cholestatic disease or alcoholic disease, whereas the majority of patients transplanted in the United States has HCV-related cirrhosis or a malignancy.12 Nevertheless, we corrected for the disease etiology in the multivariate analyses, and we think our findings can also be applied in other regions, such as the United States. The main point is the varying risk of etiology, such as, for example, hepatocellular carcinoma or HCV (see above). Another issue was the missing values of CIT and GGT. To calculate the risk models for every transplantation, the median values of these factors were used as imputation. Because of the limited missing number of values, this will not have influenced or led to any bias in the analyses. With regard to the analyses, it would have been possible to use competing risk analyses for this study. However, competing risks only play a role in death-censored graft survival, where death of the recipient precludes graft failure. The models that we present in this article for death-censored graft survival are based on so-called cause-specific hazards models. These models are valid also in the presence of competing risks and are actually recommended when interest lies in the etiology of the prognostic factors/indices involved.13,14 The Fine-Gray model is an alternative, but we felt that the cause-specific hazards models that we present are more appropriate and closer to the proportional hazards models that were used for the other outcomes. The fact that we found perfusion fluid as a risk factor could potentially have been caused by selection bias. A possible explanation could be that the difference in outcome for UW- and HTK-related transplants is due to the more frequent use of HTK in earlier years, which potentially have less results, whereas in more recent years, UW has preferably been used as perfusion fluid of choice in the Netherlands. A recent study with Eurotransplant data showed that the differences in outcome are explained by regional differences in donor, recipient, and transplant characteristics. After adjustment for these factors, these differences in outcome disappeared (de Boer et al Transplantation, 2018—accepted manuscript). The same effect could be applicable for a difference in transplant period (era). Nevertheless, perfusion fluid was found as a significant factor in this study and has therefore been corrected for.
The 3 factors of the CM (recipient age, ventilatory support, and MELDNa) were significantly associated with short-term patient survival. Of those 3 factors, MELDNa was also significantly associated with outcome at all time points and for both patient and death-uncensored graft survival (Tables 4 and 5). The impact of pretransplant sodium in the transplant candidate on outcome has been described previously10,15 and is a known risk factor. We choose here to use MELDNa instead of MELD because it had a higher predictive capacity in our data set (data not shown). The MELDNa model is not (yet) being used for liver allocation in the Netherlands (nor the rest of ET). In UNOS, however, the MELDNa has been incorporated for liver allocation in patients with a MELD score above 11 since January 2016.16 Based on these data, we would advocate that Eurotransplant also incorporates sodium into the MELD score. In the previously constructed sRRI, the MELD score was used, because MELDNa was not available in the Eurotransplant database, but when looking at the current data, it would be interesting to alter this to MELDNa. Even in a population where the median MELDNa at transplant is substantially higher than in our database, our findings are still useful. When a prognostic model is applied in a context where the median MELDNa is substantially higher, the resulting probabilistic predictions from that model will be different, but it does not mean that the contributions of the factors in that model change. That will be the case when the “effect” of the covariates is different when Na-MELD is higher or lower. In statistical terms, that is the case when there is an interaction between Na-MELD and other factors. We have checked for this, and we did not find any significant interactions between Na-MELD and other factors for none of the 3 types of outcome considered here.
A recent publication on donor-recipient matching by Briceño et al17 addressed the difficulties with these types of (predictive) models and gave a complete overview of the current situation with regard to existing risk models. The same authors studied the use of artificial intelligence (artificial neural networks) in donor-recipient matching and prediction of 3-month graft survival as alternative to the current existing predictive models.18 They also addressed the limitations of available predictive models, such as the DRI, MELD (when used as predictor of posttransplant survival19), SOFT, D-MELD, or BAR score, that all had lower areas under the curve as compared with their artificial neural networks. Interestingly, they describe the high risk of overfitting, because the high number (>55) of variables was solved by the self-learning process of the artificial neural networks, but the question remains if this system would be useable in the daily practice because of its complexity. Also, such a model would almost certainly be severely overfitted, meaning that it would fit very well on these data, but not so well on other, comparable data. Furthermore, because it is suited for 1 center or region specifically, it cannot be used to compare outcome data between different centers, regions, or countries.
It seems that, when looking at the predictive capacity of the investigated risk models, graft survival is more difficult to predict than patient survival; the c-indices are generally lower in the graft survival figures (Supplemental Digital Content). The fact that the various models function differently with different outcome types and times is a logical consequence of their design to predict this specific outcome type or time. For example, donor risk has less impact on the prediction of patient survival (lower c-indices for DRI/ET-DRI), but this increases when looking at graft survival and when follow-up time increases. This suggests that 1 model would be preferable over another model for short-term survival, but another model would be more suitable when one is looking for prediction of long-term survival. Ideally, one would be able to create an LT “risk equalizer” that adjusts the risk of a certain factor according to the moment in time and the chosen outcome type. We think that this study is a first step toward, such a risk equalizer and the methods described here would make it possible to create such a tool. However, the data in the database used for this study are too limited in numbers to create such a model, and our aim was not to create a new risk model, but to demonstrate the steps to do so. Furthermore, before introducing another (new) model, this should first be tested and validated in another database, preferably from other countries/regions, to ensure its strength. Follow-up studies to verify these findings would be interesting to undertake. In the meantime, our suggestion would be to look at patient survival for short-term prediction purposes and non–death-censored graft survival for long-term prediction purposes. Even though our results showed that long-term outcome is more difficult to predict, a reasonable risk indication can be achieved with the currently available risk models (eg, ET-DRI and sRRI). This pretransplantation risk indication can be used to improve donor-to-recipient matching (or selection) and optimize utilization in an era of organ scarcity.
CONCLUSIONS
In our opinion, this study contributes to the concept of risk factors and models. Although these models have their limitations, they are currently the best predictors of outcome. It is important to define and clearly describe which type of outcome and point in time one aims to predict (dynamic endpoints). A decade of LT in the Netherlands was analyzed and used to demonstrate the effects of recipient risk factors and risk models on different outcome types and posttransplantation time points. Short-term patient survival mainly depends on recipient risk factors, whereas long-term graft survival (death-censored) mostly depends on donor risk factors. For these purposes, respectively, the BAR model and ET-DRI showed a satisfactory discriminative capacity. Long-term outcome is more difficult to predict, but next to the CM, the DRM has a higher predictive capacity to other risk models for (long-term) patient and especially non–death-censored graft survival. The DRI and ET-DRI were the best predictors of death-censored graft survival and therefore best describe the quality of the donor liver itself. Knowledge about risk factors and models is critical when looking at outcome or comparing results and is an essential asset in waiting list management and organ allocation.
Supplementary Material
ACKNOWLEDGMENTS
The authors acknowledge the help from the following people in the data collection process: Cynthia Konijn, director of the Netherlands Organ Transplant Registry; Erwin de Vries, Eurotransplant data manager; Wouter Kopp, PhD student Leiden University Medical Center; Lot Aronson, student researcher Leiden University Medical Center.
Footnotes
Published online 21 August, 2018.
The authors declare no funding or conflicts of interest.
J.J.B., H.P., A.E.B. participated in the design, writing of the article, and performing the research. J.J.B. and H.P. participated in the data analysis. J.J.B., H.J.M., R.J.P., F.G., J.J., A.P.B., J.Z., and B.H. participated in the data collection. H.J.M., R.J.P., F.G., J.J., A.P.B., J.Z., J.D.B., and B.H. participated in preparation of the final version of the article.
Supplemental digital content (SDC) is available for this article. Direct URL citations appear in the printed text, and links to the digital files are provided in the HTML text of this article on the journal’s Web site (www.transplantationdirect.com).
REFERENCES
- 1.Rana A, Hardy MA, Halazun KJ, et al. Survival outcomes following liver transplantation (SOFT) score: a novel method to predict patient survival following liver transplantation. Am J Transplant. 2008;8:2537–2546. [DOI] [PubMed] [Google Scholar]
- 2.Halldorson JB, Bakthavatsalam R, Fix OK, et al. D-MELD, a simple predictor of post liver transplant mortality for optimization of donor/recipient matching. Am J Transplant. 2009;9:318–326. [DOI] [PubMed] [Google Scholar]
- 3.Dutkowski P, Oberkofler CE, Slankamenac K, et al. Are there better guidelines for allocation in liver transplantation? A novel score targeting justice and utility in the model for end-stage liver disease era. Ann Surg. 2011;254:745–753. [DOI] [PubMed] [Google Scholar]
- 4.Burroughs AK, Sabin CA, Rolles K, et al. 3-month and 12-month mortality after first liver transplant in adults in Europe: predictive models for outcome. Lancet. 2006;367:225–232. [DOI] [PubMed] [Google Scholar]
- 5.Feng S, Goodrich NP, Bragg-Gresham JL, et al. Characteristics associated with liver graft failure: the concept of a donor risk index. Am J Transplant. 2006;6:783–790. [DOI] [PubMed] [Google Scholar]
- 6.Braat AE, Blok JJ, Putter H, et al. The Eurotransplant donor risk index in liver transplantation: ET-DRI. Am J Transplant. 2012;12:2789–2796. [DOI] [PubMed] [Google Scholar]
- 7.Blok JJ, Putter H, Rogiers X, et al. Combined effect of donor and recipient risk on outcome after liver transplantation: research of the Eurotransplant database. Liver Transpl. 2015;21:1486–1493. [DOI] [PubMed] [Google Scholar]
- 8.Wiesner RH, Edwards E, Freeman R, et al. Model for end-stage liver disease (MELD) and allocation of donor livers. Gastroenterology. 2003;124:91–96. [DOI] [PubMed] [Google Scholar]
- 9.Eurotransplant. Eurotransplant Manual Chapter 5. 2013;1–96. [Google Scholar]
- 10.Kim WR, Biggins SW, Kremers WK, et al. Hyponatremia and mortality among patients on the liver-transplant waiting list. N Engl J Med. 2008;359:1018–1026. [DOI] [PMC free article] [PubMed] [Google Scholar]
- 11.Harrell FE. Regression Modeling Strategies. New York: Springer; 2001. [Google Scholar]
- 12.SRTR, OPTN. Liver chapter, 2012 SRTR & OPTN. Annual Data Report. 2014:1–28. [Google Scholar]
- 13.Koller MT, Raatz H, Steyerberg EW, et al. Competing risks and the clinical community: irrelevance or ignorance? Stat Med. 2012;31:1089–1097. [DOI] [PMC free article] [PubMed] [Google Scholar]
- 14.Putter H, Fiocco M, Geskus RB. Tutorial in biostatistics: competing risks and multi-state models. Stat Med. 2007;26:2389–2430. [DOI] [PubMed] [Google Scholar]
- 15.Sharma P, Schaubel DE, Goodrich NP, et al. Serum sodium and survival benefit of liver transplantation. Liver Transpl. 2015;21:308–313. [DOI] [PMC free article] [PubMed] [Google Scholar]
- 16.Kalra A, Wedd JP, Biggins SW. Changing prioritization for transplantation: MELD-Na, hepatocellular carcinoma exceptions, and more. Curr Opin Organ Transplant. 2016;21:120–126. [DOI] [PubMed] [Google Scholar]
- 17.Briceño J, Ciria R, de la Mata M. Donor-recipient matching: myths and realities. J Hepatol. 2013;58:811–820. [DOI] [PubMed] [Google Scholar]
- 18.Briceño J, Cruz-Ramírez M, Prieto M, et al. Use of artificial intelligence as an innovative donor-recipient matching model for liver transplantation: results from a multicenter Spanish study. J Hepatol. 2014;61:1020–1028. [DOI] [PubMed] [Google Scholar]
- 19.Desai NM, Mange KC, Crawford MD, et al. Predicting outcome after liver transplantation: utility of the model for end-stage liver disease and a newly derived discrimination function1. Transplantation. 2004;77:99–106. [DOI] [PubMed] [Google Scholar]
Associated Data
This section collects any data citations, data availability statements, or supplementary materials included in this article.


