Abstract
To address the reliability of CT activity score (CTAS) and investigate the relationships between CTAS, lung function changes after treatment and the serum angiotensin-converting enzyme (SACE) levels.
Fifty-seven sarcoidosis patients underwent chest high-resolution CT (HRCT) and spirometry, as well as SACE examination, were retrospectively analyzed. Follow-up spirometry in each patient was obtained about 6 months after the initial spirometry. The correlations between CTAS and pulmonary function changes were evaluated by Spearman correlation analysis. According to SACE status, patients were divided into normal and high level 2 subgroups. Comparisons of pulmonary function parameters, HRCT abnormalities extent scores between SACE normal and high 2 subgroups were performed with the Mann–Whitney U test or Independent samples t test.
CTAS demonstrated significant correlations with lung function changes (Δ%VC: ρ= 0.543, P < .001; ΔFEV1.0/FVC:ρ = 0.417, P = .001; Δ%TLC: ρ = 0.309, P = .019). In addition, worse initial lung function, larger changes of lung function, and higher extent scores of HRCT were observed in SACE high-level subgroup.
The findings of this study suggest that CTAS of initial HRCT is a promising index for disease activity in pulmonary sarcoidosis to some degree. Prospective studies with large cohort designed to address further verification are warranted before wide clinical practice.
Keywords: disease activity, high-resolution computed tomography, lung function, sarcoidosis, serum angiotensin converting enzyme
1. Introduction
Sarcoidosis is a multisystem granulomatous disorder with unclear etiology and unpredictable course.[1–3] The clinical course and the prognosis are related to the symptoms at onset and to extent of disease, ranging from an acute self-limited process to progressive fibrosis of the lung or other organs.[4–8] In sarcoidosis treatment, the search for disease activity marker that associates with organ function (i.e., pulmonary function) is ongoing.[9–25] Respiratory tract involvement is evaluated by regular clinical examinations, chest X-ray, and pulmonary function testing (spirometry). The most encouraging indicator for disease activity in clinical trial was pulmonary function testing, which showed the correlation with pulmonary PET outcomes.[13–15]
Additionally, the serum angiotensin-converting enzyme (SACE) has been the most frequently used laboratory test in sarcoidosis. Some studies have shown that SACE is produced by the alveolar macrophages in the sarcoid granuloma, and SACE level reflects the total sarcoidosis granuloma burden.[1,2] SACE level is commonly elevated and may correlate with disease activity.[20–23]
To date, high-resolution computed tomography (HRCT) has been a routine item for airway or interstitial involvement diseases. Various studies have demonstrated that HRCT is superior to conventional radiography in detecting nodules, early fibrosis, and parenchymal distortion.[6,9–12,15–19] Some HRCT features have the potential to discriminate between reversible disease (active inflammation) and irreversible disease (fibrosis).[9] Furthermore, HRCT abnormalities appeared to be useful in evaluating parameters of disease severity and lung functional impairment.[9–12,16,17,20,25] However, the results of the correlation between HRCT scores and disease activity and/or lung function appeared to be conflicting for variable HRCT scoring systems. To achieve a valid, reliable evaluation of lung abnormalities, a standard quantitative estimation of radiological abnormalities is necessary.
Currently, the HRCT scoring system proposed by Benamore et al[25]-CT activity score (CTAS) takes the extent of radiological abnormalities in pulmonary parenchyma into account, showing significant correlation with forced vital capacity (FVC) response to treatment. In addition, extent scores 4 radiological features (ground-glass opacity [GGO], interlobular septal thickening [IST], nodularity and consolidation) enrolled in CTAS correlated with at least one of the surrogates of disease activity, suggesting the validation of the relationship of CTAS to disease activity in sarcoidosis.
However, given that the limited patients were followed up in Benamore et al[25] study, the relationship between CTAS and the changes of lung function after treatment will benefit from further verification with a larger cohort. In addition, whether the extent scores of CT abnormalities mentioned above would be different in patients with different SACE status, in other words, the relationship between CT features and serum marker-ACE was still debated. Therefore, the aims of the article were to address the reliability of CTAS and investigate the relationship between CTAS and lung function changes, aiming to provide a more reliable reference for assessment of disease activity; and to compare CTAS in patients with different SACE status, exploring the potential relationship between CTAS and SACE.
2. Materials and methods
2.1. Subjects
The Institutional Review Board granted approval for our retrospective study, waiving informed consent because of its retrospective nature. This retrospective study included 57 patients with newly diagnosed pulmonary sarcoidosis between December 2010 and September 2016. Inclusion criteria in the study: the initial laboratory test and spirometry were obtained within a 2-week interval before or after the HRCT; patients without corticosteroids therapy or comorbidity before HRCT examination. To assess pulmonary function changes that have occurred over time, follow-up spirometry in each patient was obtained about 6 months after the initial spirometry.
The 57 patients included 16 males and 41 females, 27 to 66 years of age (mean age 49 ± 10 years). Of these patients,11 were ex-smoker/current smoker and 46 were nonsmoker. The diagnosis was confirmed by histology examination of lymph nodes including 16 (28.1%) transbronchial lung biopsy (TBLB), 18 (31.6%) endobronchial ultrasound-guided transbronchial needle aspiration (EBUS-TBNA), 8 (14.0%) thoracoscope, and 7 (12.3%) mediastinal biopsy. Two patients (3.5%) initially presented with a classic Löfgren's syndrome (fever, erythema nodosum, arthralgias, and bilateral hilar lymphadenopathy) without biopsy. For the other 6 patients (10.5%) without histological evidence, clinical features and bronchoalveolar fluid analysis consistent with the WASOG guidelines[26] confirmed the final diagnosis. All the patients received systemic corticosteroids therapy after HRCT examination, but the dose and treatment duration were adjusted according to clinical presentation. None of them have received immunosuppressive therapy during the 6 months.
2.2. HRCT technique and image analysis
HRCT scans were performed on either a 16-slice (Toshiba Aquilion), 320-slice (Toshiba Aquilion One) or a 256-slice CT scanner (Philips Brilliance iCT). All scans were acquired using the high-resolution technique. Images were acquired in the supine position after end-inspiration and extended from the lung apices to the costophrenic angles by using the following parameters: section thickness, 5 mm; section intervals, 5 mm; pitch, 0.75; rotation time, 330 ms; tube voltage, 120 kV; tube current, 200 mA; thin collimation 0.75 mm; reconstruction matrix, 512 × 512. From raw data, 1-mm-thick section images were reconstructed at 1-mm intervals by using a high-spatial-frequency algorithm (B60S). All CT scans were obtained with window settings that were appropriate for lung parenchyma (window width, 1300 Hounsfield units [HU]; level, −450 HU) and mediastinum (window width, 400 HU; level, 40 HU). All data were analyzed on the postprocessing workstation EBW4.52 (Extended Brilliant Workshop 4.52, Philips Healthcare Systems).
The CT images were assessed in totally random order by 2 radiologists (with 6 years and 10 years of experience in chest CT imaging, respectively) without reference to the clinical or laboratory test results. Sarcoidosis-related HRCT abnormalities (including GGO (Fig. 1A), IST, nodule (Fig. 1B), conglomeration, consolidation (Fig. 1C), intrathoracic lymphadenopathy, fibrosis (Fig. 1D)] were scored for the presence, character, and extent follow the criteria defined in the previous study.[25] Specifically, the sum of the scores for GGO, IST, nodularity and consolidation was defined as the CT activity score or CTAS and recorded. In addition, the pleural effusion and the fibrosis were also recorded without enrolling in CTAS scoring system. The fibrosis was defined as the presence of any honeycombing, reticulation, traction bronchiectasis or intralobular linear opacities with or without architectural distortion or lobar volume loss (Tables 1 and 2).
Figure 1.
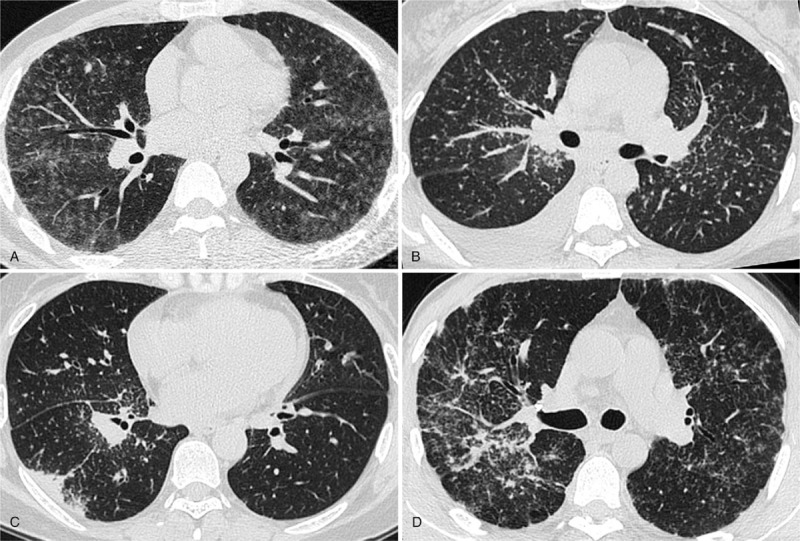
A, HRCT obtained at the level of right lower bronchus displayed bilateral diffuse ground-glass opacities in a 41-year-old male patient. Note the right hilar lymphadenopathy. The SACE level was 60.1 U/mL. B, HRCT showed micronodules with a perivascular distribution and thickening of bronchovascular bundles accompanied with right pleural effusion in a 43-year female patient. The SACE value was 68.1 U/mL. C, HRCT demonstrated consolidation in subpleural region, multiple micronodules clustered interlobar fissures and centrilobular interstitium of right lower lobe in a 50-year-old female patient, enlarged right hilar lymph nodes were also seen, the SACE level was 28.3 U/mL. D, HRCT depicted right bronchovascular bundles distortion in a 48-year male patient, a usual finding of pulmonary fibrosis. Note the bilateral irregular thickening of the pleura (pseudoplaque) and multiple miliary nodules. The SACE value was 33.7 U/mL. HRCT = high-resolution CT, SACE = serum angiotensin converting enzyme.
Table 1.
Definition of terms for abnormalities on HRCT.
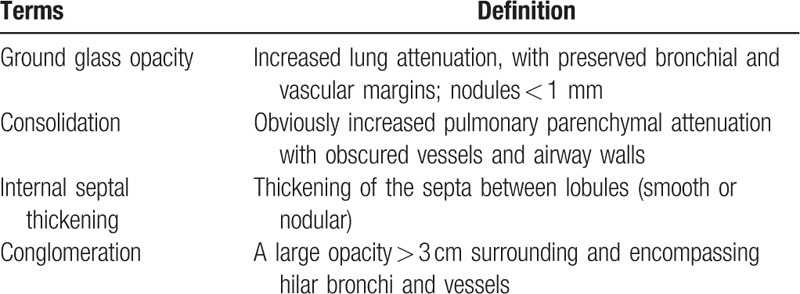
Table 2.
Scoring system for abnormalities on HRCT.
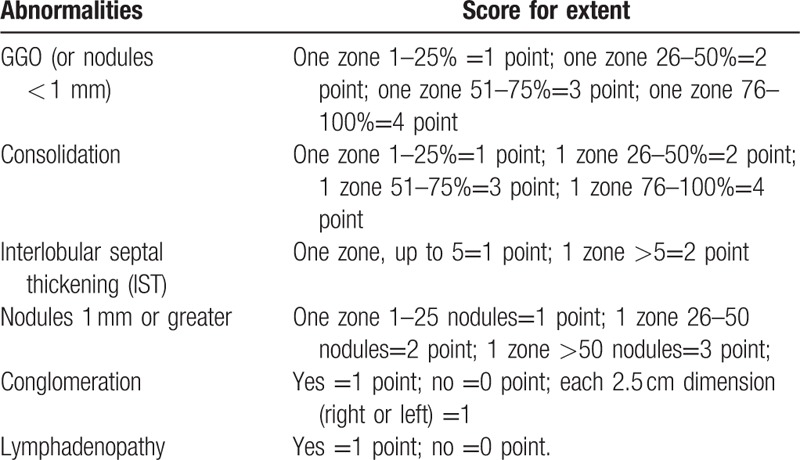
Each lung was divided into 3 zones on HRCT as follows: the upper zone above the carina in the cranio-caudal plane; the lower zone below the inferior pulmonary veins in the cranio-caudal plane; the middle zone between the upper and lower zones.
The extent of CT abnormalities was estimated visually in each aforementioned zone and measured by quartiles (25%) for GGO and consolidation, number of IST (</ = 5 or > 5) per zone, number of nodules per zone (0–25/26–50/ > 50), 2.5 cm intervals of short-axis diameter for conglomeration.[25] In addition, the sub-1 mm nodules were considered GGO since indistinguishability between innumerable sub-1 mm and GGO with current HRCT resolution.
2.3. SACE examination
SACE examination was performed with 3 mL venous blood on fasting state in the morning, all specimen were sent to our clinical laboratory by immunoturbidimetry (reagent kit were provided by Beijing Strong Biotechnologies, Inc. The instrument was adopted by BECKMAN COULTER AU5800 type automatic biochemical analyzer, America). The normal range of the SACE level was 17 U/mL to 55 U/mL in our institution, and the upper limit of normal of the SACE level is above 55 U/mL.
2.4. Pulmonary function test
All subjects performed spirometry, including vital capacity as the percent of the predicted value (%VC), forced expiratory volume in the first second (FEV1.0), forced vital capacity (FVC), and total lung capacity as the percent of the predicted value (%TLC). The initial spirometry was performed within 2 weeks before or after HRCT examination, and the second spirometry was performed with a 6-month interval. The initial spirometric values (Table 3) and the changes between the twice spirometric results were both recorded.
Table 3.
Clinical characteristics of 57 subjects.

2.5. Statistical analysis
All data were expressed as mean ± standard deviation (SD) or median± interquartile range (IQR). The correlations between pulmonary function changes, SACE values, and CT activity score (CTAS), between SACE values and pulmonary function changes were evaluated by Spearman correlation analysis or Pearson correlation analysis. According to SACE status, patients were divided into normal and high level 2 subgroups. Comparisons of pulmonary function parameters, HRCT abnormalities extent scores between SACE normal, and high 2 subgroups were performed using Mann–Whitney U test or Independent samples t test. Concordance rates and kappa values were calculated to show the reliability of calculating HRCT features and CTAS between observers. All statistical analyses were performed using a statistical software package (SPSS 17.0 for Windows, SPSS, Chicago, IL). A P values < .05 was considered to be significant.
3. Results
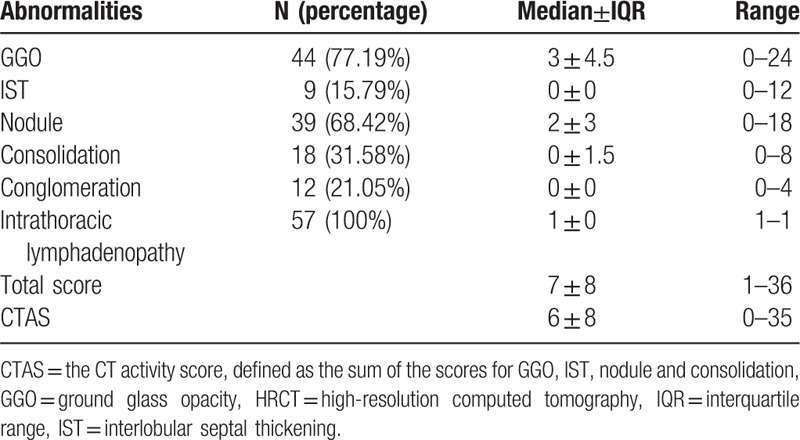
The concordance rates and kappa values were 91.2% to 95.4% and 0.85 to 0.91 for different HRCT features and CTAS. Clinical characteristics of subjects are summarized in Table 3. Extent scores for HRCT abnormalities are listed in Table 4. In addition, 4 patients (7.02%) presented with pleural effusion, 14 (24.56%) patients showed evidence of pulmonary fibrosis.
Table 4.
HRCT abnormalities and extent score.
3.1. Correlations between pulmonary function changes, SACE and HRCT abnormality extent score
Following the scoring criterion for disease activity suggested by Benamore et al,[25] the sum score of GGO, IST, consolidation, and nodularity is termed CTAS. Correlations between pulmonary function changes, SACE, and CTAS are summarized in Table 5. Pulmonary function changes and SACE both demonstrated significant correlations with CTAS.
Table 5.
Correlation between pulmonary function changes, SACE values, and CT activity score (CTAS).
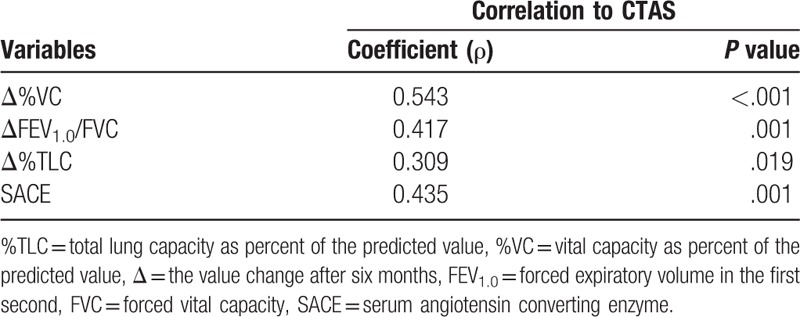
We also have evaluated the relationships between pulmonary function changes, SACE values, and total score of the HRCT features (excluding fibrosis), and have observed similar results to CTAS's (Δ%VC: ρ= 0.509, P < .001; ΔFEV1.0/FVC:ρ= 0.382, P = .003; Δ%TLC: ρ= 0.327, P = .013; SACE: ρ= 0.440, P = .001).
In addition, the SACE value showed significant correlations with pulmonary function changes (Δ%VC: ρ= 0.413, P = .001; ΔFEV1.0/FVC:ρ= 0.317, P = .016; Δ%TLC:ρ= 0.439, P = .001).
3.2. Pulmonary function parameters, HRCT scores between different SACE status
The values of pulmonary function parameters and HRCT scores in patients with different SACE status were described in Table 6. Worse initial lung function, larger changes of %TLC values, and higher HRCT scores were observed in SACE high-level subgroup.
Table 6.
Comparisons of pulmonary function parameters, HRCT abnormalities scores between different SACE status.

4. Discussion
In the present study, CTAS demonstrated the significant correlations with lung function changes (Δ%VC: ρ= 0.543, P < .001; ΔFEV1.0/FVC:ρ= 0.417, P = .001; Δ%TLC: ρ= 0.309, P = .019). Interestingly, similar outcomes were observed in the total score of HRCT abnormalities. The results suggest that CTAS is useful in evaluating disease activity in sarcoidosis. In addition, higher extent scores of HRCT and larger changes of lung function were also observed in SACE high-level subgroup, which further supported the aforementioned outcome to some degree.
Chest HRCT is an important modality to identify chest involvement of sarcoidosis. It has been demonstrated that 15% of symptomatic patients have normal chest X-ray but abnormal findings on CT scans.[27] The correlation between HRCT abnormalities and impaired lung function at rest has been well estimated in previous studies.[9–12,16,17,20,25] Thus far, most of the previous studies have been focused on the disease severity (not activity) on HRCT, and its relationship with lung function impairment. The HRCT features of pulmonary sarcoidosis could be divided into reversible and irreversible ones,[6,7,9] in other words, “reversible” feature could be improved after treatment over time, while “irreversible” ones would be unchangeable with or without treatment. GGO, IST and nodular has been proved to be potentially reversible changes in sarcoidosis.[9] Furthermore, HRCT features including GGO, IST, nodular, and consolidation have been demonstrated the significant correlation with lung function,[11,16,19] although the sample size and, more importantly, the scoring system were different. Therefore, it is reasonable to predict that the disease activity scoring system CTAS involving of GGO, IST, nodular, and consolidation associated with lung function changes after treatment in this study.
The increased level of SACE is thought to be secondary to increased expression by the epithelioid cells present in the granulomas.[28] One study showed that SACE was produced by the alveolar macrophages in the sarcoid granuloma, and SACE levels reflected the secreted total granuloma burden.[1,2] Many studies have confirmed that SACE levels can reflect the activity of the disease,[3,21–24] furthermore, it has been reported that the baseline and serial SACE levels correlate with lung function improvement during methotrexate therapy in sarcoidosis patients.[21] Therefore, SACE could be supposed to be an index for disease activity in some degree.
Although it was quite difficult to speculate about the intrinsic reason that underlay this observation, pathologic correlation factors may lead to the correlation between morphology score and SACE in sarcoidosis. First of all, the high percent of GGO (77.19%) and nodular (68.42%) were observed in the lung parenchyma. More recently, studies have shown that ground-glass opacities actually pointed to numerous granulomas along the interlobular fissures and septa and within the centrilobular interstitium surrounding arterioles and bronchioles.[20] They demonstrated as ground-glass opacities, because of beyond the resolution of HRCT.[3,4,29,30] In addition, ground-glass opacities also represented centrilobular interstitial disease in some cases.[23,30] Also, thickened bronchovascular bundles and the surrounding micronodules on HRCT, pathologically corresponded to granulomas surrounding the connective tissue sheath of bronchovascular bundles, which caused bronchovascular bundles nodular or irregular thickening.[4] Whether granulomas stand in the peribronchial interstitium or centrilobular interstitium, these 2 signs are representative of accumulation of granuloma in the lung. Nodules located in bronchovascular bundles distribute more widespread than that located in subpleural regions, the interlobular septa, centrilobular interstitium, and parts of subpleural nodules represent intrapulmonary lymph nodes.[31] Second, 100% lymphadenopathy presented in this study, although it was not enrolled in the CTAS. The bilateral hilar lymph node enlargement also undoubtedly added the total granuloma burden, although the corresponding influence on SACE may be variable in individuals. Together, these factors may explain the significant correlation between CTAS and SACE.
Our study has the following clinical significances. First, CTAS has potential clinical value to judge the disease activity of patients with sarcoidosis. CTAS showed the significant correlations with lung function and the SACE in pulmonary sarcoidosis. Second, we can indirectly judge treatment response and determine the clinical outcome with HRCT features. Finally, based on CTAS and SACE, pulmonary function and improvement after treatment might be predicted in some degree.
Our study has some limitations that need to be addressed. First, the number of cases is limited, and the study is a retrospective study. Studies with larger patients are needed to reduce selective bias. Second, considering the limited subjects, the potential effects of smoking on HRCT appearance, function test, and SACE level were not analyzed; this is a monocentric study focusing on the scoring system proposed by Benamore et al[25] without comparison with other scoring systems on HRCT. Third, in this study 100% intrathoracic lymphadenopathy was observed, similar as in Benamore et al[25] study. However, for the subjects without intrathoracic lymphadenopathy, the CTAS scoring system still needs to be discussed. Finally, it is necessary to follow up patients and to make a dynamic longitudinal study between HRCT activity score and clinical parameters (including pulmonary function, serum ACE) in order to reflect the outcome of the disease.
5. Conclusion
In conclusion, our results suggest that CTAS involving of GGO, IST, nodular and consolidation on HRCT could be a promising index for disease activity; CTAS demonstrated significant correlations both with lung function changes after treatment and SACE; subjects with high SACE prefer to behave higher CTAS on HRCT and worse initial lung function to some degree. Prospective studies with a large cohort designed to address further verification are warranted before wide clinical practice.
Author contributions
Conceptualization: Jianghui Duan, Hongliang Sun, Wu Wang.
Data curation: Jianghui Duan, Yanyan Xu, Haixu Zhu, Haibo Zhang, Shilong Sun, Hongliang Sun.
Formal analysis: Jianghui Duan, Yanyan Xu, Haibo Zhang, Hongliang Sun.
Funding acquisition: Hongliang Sun, Wu Wang.
Investigation: Hongliang Sun.
Methodology: Yanyan Xu, Hongliang Sun.
Project administration: Hongliang Sun, Sheng Xie.
Resources: Jianghui Duan, Haibo Zhang, Sheng Xie.
Software: Jianghui Duan, Haixu Zhu.
Supervision: Wu Wang.
Writing – original draft: Jianghui Duan, Yanyan Xu.
Writing – review & editing: Yanyan Xu, Haixu Zhu, Hongliang Sun, Wu Wang, Sheng Xie.
Footnotes
Abbreviations: %TLC = total lung capacity as percent of the predicted value, %VC = vital capacity as percent of the predicted value, CTAS = CT activity score, EBUS-TBNA = endobronchial ultrasound-guided transbronchial needle aspiration, FEV1.0 = forced expiratory volume in the first second, FVC = forced vital capacity, GGO = ground-glass opacity, HRCT = high-resolution CT, HU = Hounsfield units, IQR = interquartile range, IST = interlobular septal thickening, SACE = serum angiotensin-converting enzyme, TBLB = transbronchial lung biopsy, WASOG = World Association of Sarcoidosis and Other Granulomatous Disorders.
This work has received funding from Beijing Municipal Science and Technology Commission No. Z181100001718099, the National Natural Science Foundation of China (81501469), and the Health Industry Special Scientific Research Project of National Health and Family Planning Commission of the People's Republic of China (201402019).
The authors have no conflicts of interest to disclose.
References
- [1].Rosen Y. Pathology of sarcoidosis. Semin Respir Crit Care Med 2007;28:36–52. [DOI] [PubMed] [Google Scholar]
- [2].Sheffield EA. Pathology of sarcoidosis. Clin Chest Med 1997;18:741–54. [DOI] [PubMed] [Google Scholar]
- [3].Wessendorf TE, Bonella F, Costabel U. Diagnosis of sarcoidosis. Clin Rev Allergy Immunol 2015;49:54–62. [DOI] [PubMed] [Google Scholar]
- [4].Little BP. Sarcoidosis: overview of pulmonary manifestations and imaging. Semin Roentgenol 2015;50:52–64. [DOI] [PubMed] [Google Scholar]
- [5].Koyama T, Ueda H, Togashi K, et al. Radiologic manifestations of sarcoidosis in various organs. Radiographics 2004;24:87–104. [DOI] [PubMed] [Google Scholar]
- [6].Criado E, Sánchez M, Ramírez J, et al. Pulmonary sarcoidosis: typical and atypical manifestations at high-resolution CT with pathologic correlation. Radiographics 2010;30:1567–86. [DOI] [PubMed] [Google Scholar]
- [7].Nishimura K, Itoh H, Kitaichi M, et al. Pulmonary sarcoidosis: correlation of CT and histopathologic findings. Radiology 1993;189:105–9. Erratum in: Radiology 1994;190:907. [DOI] [PubMed] [Google Scholar]
- [8].Reich JM. Mortality of intrathoracic sarcoidosis in referral vs population-based settings: influence of stage, ethnicity, and corticosteroid therapy. Chest 2002;121:32–9. [DOI] [PubMed] [Google Scholar]
- [9].Murdoch J, Müller NL. Pulmonary sarcoidosis: changes on follow-up CT examination. AJR Am J Roentgenol 1992;159:473–7. [DOI] [PubMed] [Google Scholar]
- [10].Oberstein A, von Zitzewitz H, Schweden F, et al. Non invasive evaluation of the inflammatory activity in sarcoidosis with high-resolution computed tomography. Sarcoidosis Vasc Diffuse Lung Dis 1997;14:65–72. [PubMed] [Google Scholar]
- [11].Drent M, De Vries J, Lenters M, et al. Sarcoidosis: assessment of disease severity using HRCT. Eur Radiol 2003;13:2462–71. [DOI] [PubMed] [Google Scholar]
- [12].Akira M, Kozuka T, Inoue Y, et al. Long-term follow-up CT scan evaluation in patients with pulmonary sarcoidosis. Chest 2005;127:185–91. [DOI] [PubMed] [Google Scholar]
- [13].Keijsers RG, Verzijlbergen EJ, van den Bosch JM, et al. 18F-FDG PET as a predictor of pulmonary function in sarcoidosis. Sarcoidosis Vasc Diffuse Lung Dis 2011;28:123–9. [PubMed] [Google Scholar]
- [14].Mostard RL, Vöö S, van Kroonenburgh MJ, et al. Inflammatory activity assessment by F18 FDG-PET/CT in persistent symptomatic sarcoidosis. Respir Med 2011;105:1917–24. [DOI] [PubMed] [Google Scholar]
- [15].Mostard RL, Verschakelen JA, van Kroonenburgh MJ, et al. Severity of pulmonary involvement and (18)F-FDG PET activity in sarcoidosis. Respir Med 2013;107:439–47. [DOI] [PubMed] [Google Scholar]
- [16].Sileo C, Epaud R, Mahloul M, et al. Sarcoidosis in children: HRCT findings and correlation with pulmonary function tests. Pediatr Pulmonol 2014;49:1223–33. [DOI] [PubMed] [Google Scholar]
- [17].Polverosi R, Russo R, Coran A, et al. Typical and atypical pattern of pulmonary sarcoidosis at high-resolution CT: relation to clinical evolution and therapeutic procedures. Radiol Med 2014;119:384–92. [DOI] [PubMed] [Google Scholar]
- [18].Keijsers RG, van den Heuvel DA, Grutters JC. Imaging the inflammatory activity of sarcoidosis. Eur Respir J 2013;41:743–51. [DOI] [PubMed] [Google Scholar]
- [19].Remy-Jardin M, Giraud F, Remy J, et al. Pulmonary sarcoidosis: role of CT in the evaluation of disease activity and functional impairment and in prognosis assessment. Radiology 1994;191:675–80. [DOI] [PubMed] [Google Scholar]
- [20].Ors F, Gumus S, Aydogan M, et al. HRCT findings of pulmonary sarcoidosis; relation to pulmonary function tests. Multidiscip Respir Med 2013;8:8. [DOI] [PMC free article] [PubMed] [Google Scholar]
- [21].Vorselaars AD, van Moorsel CH, Zanen P, et al. ACE and sIL-2R correlate with lung function improvement in sarcoidosis during methotrexate therapy. Respir Med 2015;109:279–85. [DOI] [PubMed] [Google Scholar]
- [22].Popević S, Šumarac Z, Jovanović D, et al. Verifying sarcoidosis activity: chitotriosidase versus ace in sarcoidosis— case-control study. J Med Biochem 2016;35:390–400. [DOI] [PMC free article] [PubMed] [Google Scholar]
- [23].Mathur RS, Kurdikar VL, Shah JR. Serum angiotensin converting enzyme in the diagnosis of pulmonary sarcoidosis. J Assoc Physicians India 1990;38:474–5. [PubMed] [Google Scholar]
- [24].Sainani GS, Mahbubani V, Trikannad V. Serum angiotensin converting enzyme activity in sarcoidosis and pulmonary tuberculosis. J Assoc Physicians India 1996;44:29–30. [PubMed] [Google Scholar]
- [25].Benamore R, Kendrick YR, Repapi E, et al. CTAS: a CT score to quantify disease activity in pulmonary sarcoidosis. Thorax 2016;71:1161–3. [DOI] [PubMed] [Google Scholar]
- [26].Statement on sarcoidosis. Joint Statement of the American Thoracic Society (ATS), the European Respiratory Society (ERS) and the World Association of Sarcoidosis and Other Granulomatous Disorders (WASOG) adopted by the ATS Board of Directors and by the ERS Executive Committee, February 1999. Am J Respir Crit Care Med 1999;160:736–55. [DOI] [PubMed] [Google Scholar]
- [27].Epler GR, McLoud TC, Gaensler EA, et al. Normal chest roentgenograms in chronic diffuse infiltrative lung disease. N Engl J Med 1978;298:934–9. [DOI] [PubMed] [Google Scholar]
- [28].Silverstein E, Pertschuk LP, Friedland J. Immunofluorescent localization of angiotensin converting enzyme in epithelioid and giant cells of sarcoidosis granulomas. Proc Natl Acad Sci U S A 1979;76:6646–8. [DOI] [PMC free article] [PubMed] [Google Scholar]
- [29].Nakatsu M, Hatabu H, Morikawa K, et al. Large coalescent parenchymal nodules in pulmonary sarcoidosis: "sarcoid galaxy" sign. AJR Am J Roentgenol 2002;178:1389–93. [DOI] [PubMed] [Google Scholar]
- [30].Marchiori E, Zanetti G, Barreto MM, et al. Atypical distribution of small nodules on high resolution CT studies: patterns and differentials. Respir Med 2011;105:1263–7. [DOI] [PubMed] [Google Scholar]
- [31].Koo HJ, Chae EJ, Kim JE, et al. Presence of macronodules in thoracic sarcoidosis: prevalence and computed tomographic findings. Clin Radiol 2015;70:815–21. [DOI] [PubMed] [Google Scholar]


