Abstract
Evaluating the role of endoscopic ultrasound (EUS) elastography and strain ratio in differentiation between malignant and benign pancreatic lesions.
Three hundred twenty-five patients with solid pancreatic lesions were enrolled in this prospective study from 2014 to 2017. EUS real-time elastography scoring and strain ratio were done to all patients and compared to the final diagnosis to assess its sensitivity, specificity, positive and negative predictive values (PPV and NPV) in differentiating malignant from benign lesions.
A cut-off value of 4.2 we had sensitivity of 95%, specificity of 63%, PPV of 89%, NPV of 81%, and accuracy of 87%. Another cut-off value of 10.9 showed a sensitivity of 75%, specificity of 88%, PPV of 95%, NPV of 54%, and accuracy of 79%. Adding the elastography to the better cut-off value gave a sensitivity of 97%, specificity of 63%, PPV of 89%, NPV of 88%, and accuracy of 89%.
Real-time elastography and strain ration are valuable in differentiating malignant from pancreatic lesions.
Keywords: elastography, EUS, pancreatic lesions, strain ratio
1. Introduction
Solid pancreatic lesions (SPL) have less than 5% 5-year survival rate,[1] so they need to be investigated thoroughly to reach the proper diagnosis. In advanced cases, surgery will not be a solution in spite being the best treatment at earlier stages.[2]
In a previous study,[3] we evaluated real-time EUS elastography and strain ratio as predictive tools to reach the correct diagnosis for SPL. It had a sensitivity of 98% and specificity of 77% and a diagnostic accuracy of 92%.[3]
In this prospective study, we decided to increase the sample size of the studied group (325 patients) for more accurate diagnosis and to see if this would change the cut-off values of the strain ratio reached in the previous work for differentiating benign from malignant lesions.
2. Patients and methods
2.1. Patients
Patients with solid pancreatic lesions (SPL) identified by endoscopic ultrasound (EUS) in Cairo University hospital starting from January 2014 to June 2017 were enrolled in this prospective study. The inclusion criteria were solid pancreatic lesion from prior radiological imaging and patients with extrahepatic biliary radicle obstruction with inconclusive CT or MRI findings between 18 and 80-year-old. The exclusion criteria were patients that refused to participate, patients with contraindication to the procedure, and pregnant or breast-feeding patients. Informed consent was obtained from all patients before the procedure.
2.2. Methods
After approval from the ethical committee, patients who agreed to participate in the study were appointed to the endoscopy room on the day of the procedure for EUS examination. EUS examination was performed using a linear EchoendoscopePentax EG3870UTK (HOYA Corporation, PENTAX Life Care Division, Showanomori Technology Center, Tokyo, Japan) connected to an ultrasound unit Hitachi AVIUS machine (Hitachi Medical Systems, Tokyo, Japan). All examinations were performed by 1 endosonographer. For EUS-fine needle aspiration (FNA), we used the Cook needle 22G (Echotip; Wilson-Cook, Winston Salem, NC). Elastography was applied to evaluate the SPL.
2.2.1. Qualitative score
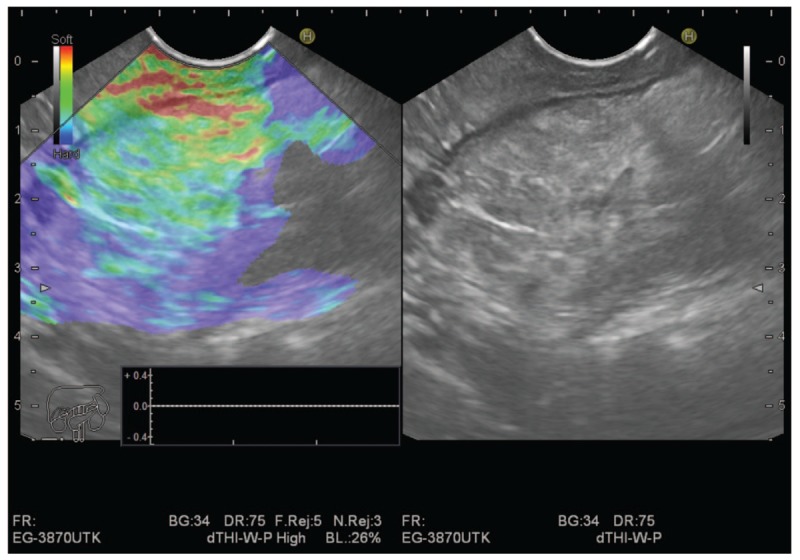
We used the “Elastic score” reported by Giovannini et al,[4] that is, Score 1 (soft, green), corresponding to the normal pancreas; Score 2 corresponding to chronic pancreatitis as shown in Fig. 1. Elastographic images that were largely blue with minimal heterogeneity, corresponding to small adenocarcinomas, were given Score 3 as shown in Fig. 2. Score 4 represented a hypoechoic region in the center, with a green appearance within a small area surrounded by blue, or harder tissue, corresponding to neuroendocrine tumors.
Figure 1.

Chronic pancreatitis with elasticity score 2.
Figure 2.

Pancreatic adenocarcinoma with elasticity score 3.
2.2.2. Quantitative score
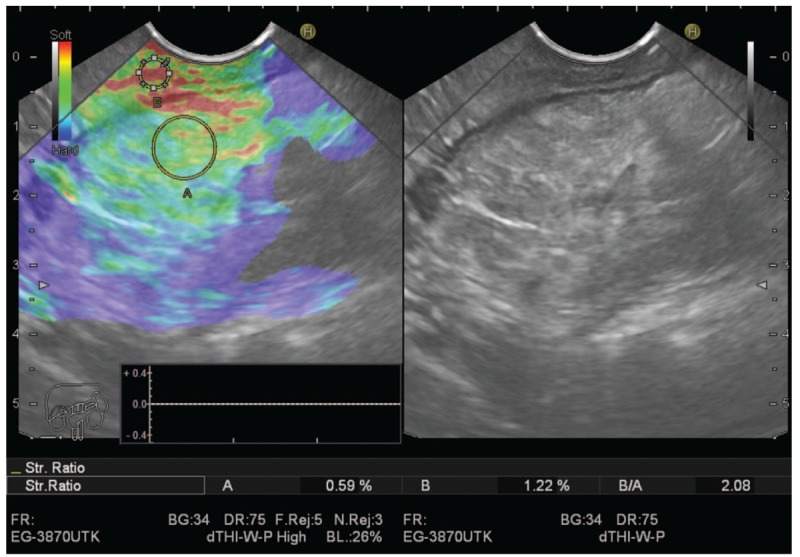
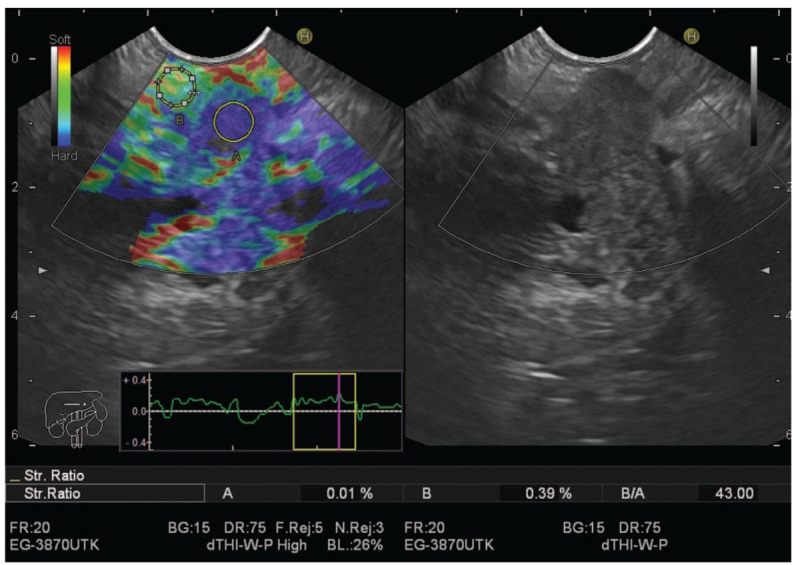
The semiquantitative score of elastography was represented by the strain ratio method. Two areas were selected, area (A) representing the region of interest and area (B) representing the normal area. Area (B) is then divided by area (A). Means of strain ratios were calculated and used as final results for each patient as shown in Figs. 3 and 4. The best cut-off value of strain ratio was also combined with results of elastography for calculation of diagnostic value.
Figure 3.

Chronic pancreatitis showing low strain ratio.
Figure 4.

Pancreatic adenocarcinoma with high stain ratio.
2.2.3. Data analysis
Sensitivity, specificity, positive predictive value (PPV), negative predictive value (NPV), and accuracy were calculated by comparing diagnoses made by elastography, strain ration, and final diagnoses.
Final diagnosis of the SPL was obtained by cytopathological examination of aspirate taken by EUS-FNA, excisional biopsy of surgically removed tumors, presence of metastases or follow up of benign lesions for at least 6 months.
3. Results
The study was done on 325 patients, 222 females with mean age of 55.6 and 103 males with mean age of 54.8.
The lesions were diagnosed to be benign in 78 patients and malignant in 247 patients, with the different diagnoses mentioned in Table 1.
Table 1.
Nature of the diagnosed lesions.

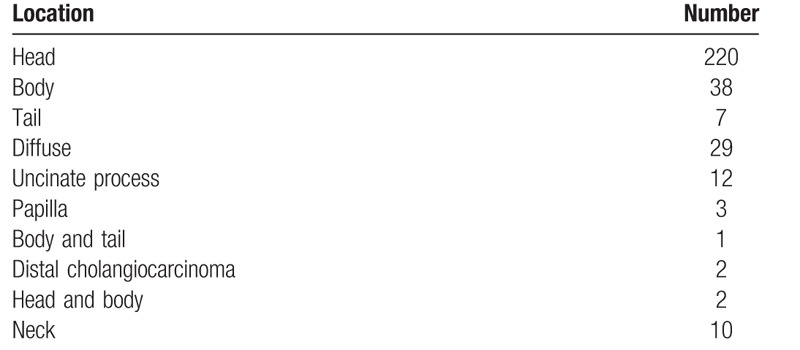
Most of the lesions were located in the head of the pancreas reaching 220 cases, to be followed by lesions in the body of the pancreas reaching 38 and those involving the whole pancreas where 29 cases as mentioned in Table 2.
Table 2.
Location of the lesions and their numbers.

Elastography Scores 1 and 2 were considered benign while 3 and 4 were considered malignant. The calculated statistical parameters of elasticity score, cut-off strain ratio at 4.2 and 10.9 and combined elasticity score and stain ration of 4.2 are shown in Table 3.
Table 3.
Elastography and strain ratio.

4. Discussion
As EUS has a limited ability to differentiate between benign and malignant solid pancreatic lesions, EUS guided tissue sampling is needed to improve its accuracy.[5–9] Still, EUS-guided tissue sampling may face some limitations as the false-negative results,[10] the difficult puncture in some lesions due to interposing vascular structure[11] and the very small but present morbidity.[12] This urged the need for a noninvasive method to be used with the EUS to differentiate between the malignant and benign lesions.
We previously investigated 172 patients identified to have SPL by the previously mentioned noninvasive modalities beside the EUS-FNA to predict the nature of the lesion.[3] At the cut-off level of 3.8, we had sensitivity, specificity, PPV, NPV, and accuracy of 99%, 53%, 84%, 86%, and 96%, respectively. Then we calculated the best cut-off value to have 7.8 to differentiate between benign and malignant SPL. We had sensitivity of 92%, specificity of 77%, accuracy of 88%, PPV of 91%, and NPV of 80%. To increase the efficacy of diagnosing SPL, we combined elastography to the strain ratio level of 7.8 to have sensitivity of 98%, specificity of 77%, accuracy of 92%, PPV of 91%, and NPV of 95% raising the accuracy than if every tool was used alone.
At this paper, we decided to find out the effect of increasing the sample size on the cut-off values for strain ratio by investigating 325 patients.
On a cut-off value of 4.2 we had sensitivity of 95%, specificity of 63%, PPV of 89%, NPV of 81%, and accuracy of 87%. Another cut-off value of 10.9 had a sensitivity of 75%, specificity of 88%, PPV of 95%, NPV of 54%, and accuracy of 79%.
This decrease in the better reached cut-off value with better sensitivity and higher accuracy may be attributed to the increased sample size which gives results of better diagnostic value and may postulate that small values for strain ratio can include malignant lesions. The work carried by Dalibor et al[13] recorded a cut-off value of 1.153 with sensitivity of 98%, specificity of 50%, and accuracy of 69%.
Iglesias-Garcia et al reported their results on the strain ratio on 86 patients. This methodology even increased the accuracy of qualitative elastography, yielding an overall diagnostic accuracy for malignancy of 97.7% when presenting strain ratio level >6.04. In addition, EUS-guided elastography could differentiate pancreatic cancers from inflammatory masses (100% sensitivity and 96%specificity) and pancreatic cancers from neuroendocrine tumors (100% sensitivity and 88% specificity).[14] Several studies reported different cut-off values from 3.7 to 24, with diagnostic sensitivities ranging from 67% to 98% and specificities between 45% and 71%.[15–21] This issue highlights that standardization of the techniques is needed.
Another study by Iglesias-Garcia et al[22] reported that a strain ratio >10 is the optimal cut-off values for the classification of lesions as malignant with an overall accuracy of 98%. Several meta-analyses have been performed to determine the role of EUS-guided elastography in the differential diagnosis of solid pancreatic masses. Two meta-analyses evaluated the role on the differentiation of malignant pancreatic tumors from inflammatory pancreatic masses, showing a sensitivity of 95% and a specificity ranging from 67% to 69%.[23,24] The third meta-analysis included 7 studies and 752 patients, with a global sensitivity of 97% and a specificity of76%. This meta-analysis highlighted the difficulties of differentiating adenocarcinoma and neuroendocrine tumors, due to the similar hardness of both tumors.[25] The fourth meta-analysis found that the use of a color pattern for elastographic interpretation was associated with a sensitivity of 99% and a specificity between 69%and 76%.[26]
Adding the elastography to the better cut-off value gave a sensitivity of 97%, specificity of 63%, PPV of 89%, NPV of 88%, and accuracy of 89%. This was near to the values obtained by elastography alone. This also was different from the previous work where adding the strain ratio to elastography increased accuracy to 92% with sensitivity of 98%. This finding suggests that elastography, although being a subjective method, in good experienced hands and with large sample size can be very objective.
Using elastography and strain ratio as guide to accurately target FNA tissue sampling will improve its accuracy, moreover, in highly suspicious lesions based on elastography and strain ratio with negative FNA, another trial of FNA will be justified.
Many previous publications showed similar results, however the large sample size of this study will consolidate the elastography and strain ratio role in the future as an important complementary tool to EUS and FNA.
Still, the value of the strain ratio as a numerical non subjective method cannot be dismissed. The large sample size beside the nature of the study being a prospective one, gave us confidence in our results, whether the subjective or the numerical ones.
5. Conclusion
EUS-guided elastography with strain ratio provides very useful and valuable information on the malignant potential of lesions. Although tissue confirmation is frequently needed for the final diagnosis and is included in the diagnostic algorithm, elastography should be included in the diagnostic work up of solid pancreatic lesions.
Author contributions
Conceptualization: Hussein Hassan Okasha.
Data curation: Mohamed El-Nady.
Formal analysis: Asem Ashraf.
Funding acquisition: Moustafa Saeed.
Investigation: Amr Abo El-Magd.
Project administration: Shaimaa Elkholy.
Resources: Reem Ezzat Mahdy, Abeer Awad.
Software: Ahmed Nabil El-Mazny.
Visualization: Osama Soliman Elbalky.
Writing – original draft: Mohamed Sayed Hassan.
Writing – review & editing: Kareem Essam Eldin Hadad.
Footnotes
Abbreviations: EUS = endoscopic ultrasound, FNA = fine needle aspiration, NPV = negative predictive value, PPV = positive predictive value, SPL = solid pancreatic lesions.
The authors whose names are listed certify that they have no conflict of interest with any organization or entity with any financial or nonfinancial interest in the subject matter or materials discussed in this manuscript.
References
- [1].Gong Z, Holly EA, Bracci PM. Survival in population-based pancreatic cancer patients: San Francisco Bay area, 1995–1999. Am J Epidemiol 2011;174:1373–81. [DOI] [PMC free article] [PubMed] [Google Scholar]
- [2].Cheng CT, Tsai CY, Hsu JT, et al. Aggressive surgical approach for patients with T4 gastric carcinoma: promise of myth? Ann Surg Oncol 2011;18:1606–14. [DOI] [PubMed] [Google Scholar]
- [3].Okasha H, Elkoly S, El-Sayed R, et al. Real time endoscopic ultrasound elastography and strain ratio in the diagnosis of solid pancreatic lesions. World J Gastroenterol 2017;23:5962–8. [DOI] [PMC free article] [PubMed] [Google Scholar]
- [4].Giovannini M, Hookey LC, Bories E, et al. Endoscopic ultrasound elastography: the first step towards virtual biopsy? Preliminary results in 49 patients. Endoscopy 2006;38:344–8. [DOI] [PubMed] [Google Scholar]
- [5].Hewitt MJ, McPhail MJ, Possamai L, et al. EUS-guided FNA for diagnosis of solid pancreatic neoplasms: a meta-analysis. Gastrointest Endosc 2012;75:319–31. [DOI] [PubMed] [Google Scholar]
- [6].Hartwig W, Schneider L, Diener MK, et al. Preoperative tissue diagnosis for tumours of the pancreas. Br J Surg 2009;96:5–20. [DOI] [PubMed] [Google Scholar]
- [7].Puli SR, Bechtold ML, Buxbaum JL, et al. How good is endoscopic ultrasound-guided fine-needle aspiration in diagnosing the correct etiology for a solid pancreatic mass? A meta-analysis and systematic review. Pancreas 2013;42:20–6. [DOI] [PubMed] [Google Scholar]
- [8].Dumonceau JM, Polkowski M, Larghi A, et al. Indications, results, and clinical impact of endoscopic ultrasound (EUS)-guided sampling in gastroenterology: European Society of Gastrointestinal Endoscopy (ESGE) clinical guideline. Endoscopy 2011;43:897–912. [DOI] [PubMed] [Google Scholar]
- [9].Iglesias-Garcia J, Dominguez-Munoz JE, Abdulkader I, et al. Influence of on-site cytopathology evaluation on the diagnostic accuracy of endoscopic ultrasound-guided fine needle aspiration (EUS-FNA) of solid pancreatic masses. Am J Gastroenterol 2011;106:1705–10. [DOI] [PubMed] [Google Scholar]
- [10].Giovannini M, Seitz JF, Monges G, et al. Fine-needle aspiration cytology guided by endoscopic ultrasonography: results in 141 patients. Endoscopy 1995;27:171–7. [DOI] [PubMed] [Google Scholar]
- [11].DeWitt J, McGreevy K, Sherman S, et al. Utility of a repeated EUS at a tertiary-referral center. Gastrointest Endosc 2008;67:610–9. [DOI] [PubMed] [Google Scholar]
- [12].Eloubeidi MA, Tamhane A, Varadarajulu S, et al. Frequency of major complications after EUS-guided FNA of solid pancreatic masses: a prospective evaluation. Gastrointest Endosc 2006;63:622–9. [DOI] [PubMed] [Google Scholar]
- [13].Opaclc D, Rustemovic N, Kalauz M, et al. Endoscopic ultrasound elastography strain histograms in the evaluation of patients with pancreatic masses. World J Gastroenterol 2015;21:4014–9. [DOI] [PMC free article] [PubMed] [Google Scholar]
- [14].Iglesias-Garcia J, Larino-Noia J, Abdulkader I, et al. Quantitative endoscopic ultrasound elastography: an accurate method for the differentiation of solid pancreatic masses. Gastroenterology 2010;139:1172–80. [DOI] [PubMed] [Google Scholar]
- [15].Figueiredo FA, da Silva PM, Monges G, et al. Yield of contrast-enhanced power doppler endoscopic ultrasonography and strain ratio obtained by EUS-elastography in the diagnosis of focal pancreatic solid lesions. Endosc Ultrasound 2012;1:143–9. [DOI] [PMC free article] [PubMed] [Google Scholar]
- [16].Dawwas MF, Taha H, Leeds JS, et al. Diagnostic accuracy of quantitative EUS elastography for discriminating malignant from benign solid pancreatic masses: a prospective, single-center study. Gastrointest Endosc 2012;76:953–61. [DOI] [PubMed] [Google Scholar]
- [17].Lee TH, Cho YD, Cha SW, et al. Endoscopic ultrasound elastography for the pancreas in Korea: a preliminary single center study. Clin Endosc 2013;46:172–7. [DOI] [PMC free article] [PubMed] [Google Scholar]
- [18].Havre RF, Ødegaard S, Gilja OH, et al. Characterization of solid focal pancreatic lesions using endoscopic ultrasonography with real-time elastography. Scand J Gastroenterol 2014;49:742–51. [DOI] [PubMed] [Google Scholar]
- [19].Rustemovic N, Opacic D, Ostojic Z, et al. Comparison of elastography methods in patients with pancreatic masses. Endosc Ultrasound 2014;3:S4. [PMC free article] [PubMed] [Google Scholar]
- [20].Kongkam P, Lakananurak N, Navicharern P, et al. Combination of EUS-FNA and elastography (strain ratio) to exclude malignant solid pancreatic lesions: a prospective single-blinded study. J Gastroenterol Hepatol 2015;30:1683–9. [DOI] [PubMed] [Google Scholar]
- [21].Mayerle J, Beyer G, Simon P, et al. Prospective cohort study comparing transient EUS guided elastography to EUS-FNA for the diagnosis of solid pancreatic mass lesions. Pancreatology 2016;16:110–4. [DOI] [PubMed] [Google Scholar]
- [22].Iglesias-Garcia J, Lindkvist B, Larino-Noia J, et al. Differential diagnosis of solid pancreatic masses: contrast-enhanced harmonic (CEH-EUS), quantitative-elastography (QE-EUS), or both? United European Gastroenterol J 2017;5:236–46. [DOI] [PMC free article] [PubMed] [Google Scholar]
- [23].Pei Q, Zou X, Zhang X, et al. Diagnostic value of EUS elastography in differentiation of benign and malignant solid pancreatic masses: a meta-analysis. Pancreatology 2012;12:402–8. [DOI] [PubMed] [Google Scholar]
- [24].Mei M, Ni J, Liu D, et al. EUS elastography for diagnosis of solid pancreatic masses: a meta-analysis. Gastrointest Endosc 2013;77:578–89. [DOI] [PubMed] [Google Scholar]
- [25].Xu W, Shi J, Li X, et al. Endoscopic ultrasound elastography for differentiation of benign and malignant pancreatic masses: a systemic review and meta-analysis. Eur J Gastroenterol Hepatol 2013;25:218–24. [DOI] [PubMed] [Google Scholar]
- [26].Li X, Xu W, Shi J, et al. Endoscopic ultrasound elastography for differentiating between pancreatic adenocarcinoma and inflammatory masses: a meta-analysis. World J Gastroenterol 2013;19:6284–91. [DOI] [PMC free article] [PubMed] [Google Scholar]


