. 2018 Sep 11;7:e37125. doi: 10.7554/eLife.37125

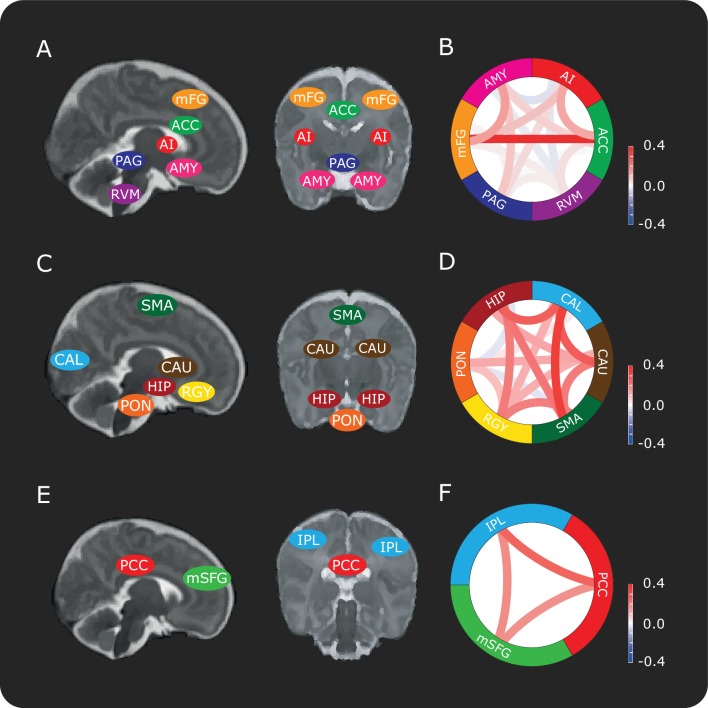
Figure 1. Connectivity between brain regions in the DPMS and control networks.

Schematic representation showing approximate locations of brain regions in sagittal and coronal slices in the (A) DPMS Network, (C) Control Network and (E) Default Mode Network. Each anatomical region of interest is identified in Figure 1—figure supplement 1 and the source data is provided in Figure 1—source data 1. Figure 1—figure supplement 2 shows the registration of two example masks from template to functional space and example time series. Network schematics of the mean pre-stimulus functional connectivity between pairs of regions in the (B) DPMS Network, (D) Control Network and (F) Default Mode Network. For abbreviations see main text.

Figure 1—source data 1. All region-of-interest masks in standard space.
DOI: 10.7554/eLife.37125.006

Figure 1.

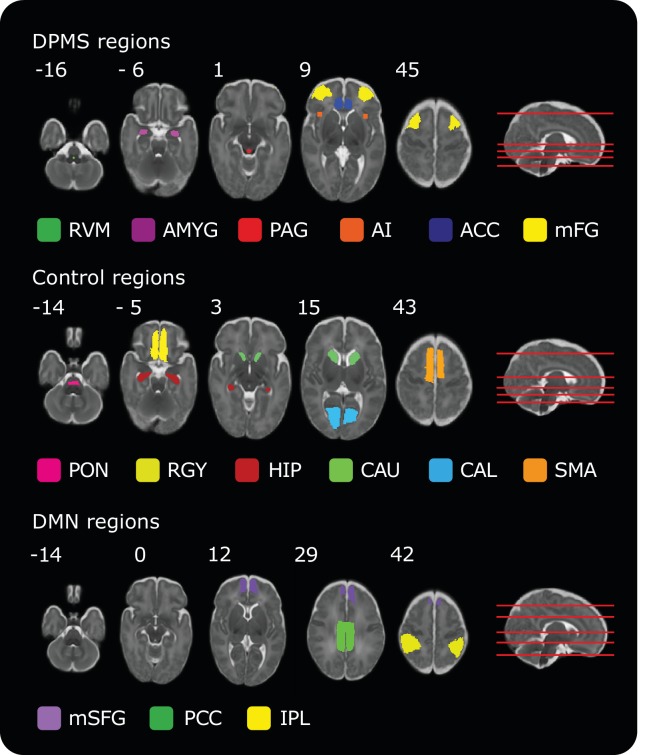
Figure 1—figure supplement 1. Masks of regions included in the DPMS, Control Network and Default Mode Network.

Figure 1—figure supplement 1.

Numbers by the top left of each transverse image represent coordinate locations in infant template space. The location of each transverse slice is demonstrated (red lines) on the sagittal template brain on the right. The source data (Figure 1—source data 1) contains all the brain regions in standard space for all networks.
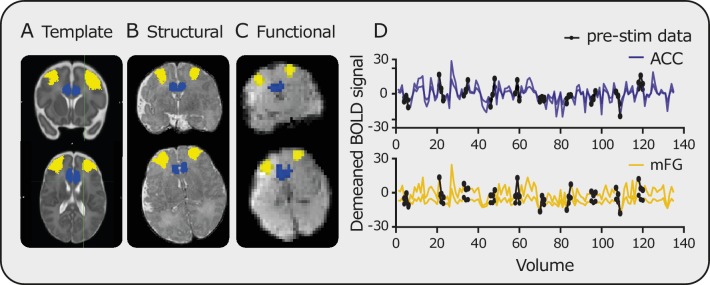
Figure 1—figure supplement 2. Registration and time series data.

Figure 1—figure supplement 2.

Registration of masks from (A) template to (B) structural and finally to (C) functional space (blue mask = ACC, yellow mask = mFG). (D) Examples of the resulting time series within the ACC (blue) and mFG (yellow). Black circles highlight the pre-stimulus data points.
Figure 1—figure supplement 3. Pre-stimulus connectivity is stable.

Figure 1—figure supplement 3.

Average pre-stimulus connectivity in the DPMS Network across infants prior to each of the 10 stimuli. Error bars indicate mean and standard deviation.