

Abstract
Objective
To measure CSF levels of biomarkers reflecting microglia and astrocytes activation, neuroinflammation, and cerebrovascular changes and study their associations with the core biomarkers of Alzheimer disease (AD) pathology (β-amyloid [Aβ] and tau), structural imaging correlates, and clinical disease progression over time.
Methods
The study included cognitively unimpaired elderly (n = 508), patients with mild cognitive impairment (MCI, n = 256), and patients with AD dementia (n = 57) from the longitudinal Swedish BioFINDER cohort. CSF samples were analyzed for YKL-40, interleukin (IL)–6, IL-7, IL-8, IL-15, IP-10, monocyte chemoattractant protein 1, intercellular adhesion molecule 1 (ICAM-1), vascular adhesion molecule 1 (VCAM-1), placental growth factor, and fms-related tyrosine kinase 1 (Flt-1). MRI data were available from 677 study participants. Longitudinal clinical assessments were conducted in control individuals and patients with MCI (mean follow-up 3 years, range 1–6 years).
Results
CSF levels of YKL-40, ICAM-1, VCAM-1, IL-15, and Flt-1 were increased during the preclinical, prodromal, and dementia stages of AD. High levels of these biomarkers were associated with increased CSF levels of total tau, with the associations, especially for YKL-40, being stronger in Aβ-positive individuals. The results were similar for associations between phosphorylated tau and YKL-40, ICAM-1, and VCAM-1. High levels of the biomarkers were also associated with cortical thinning (primarily in the precuneus and superior parietal regions) and with subsequent cognitive deterioration in patients without dementia as measured with Mini-Mental State Examination (YKL-40) and Clinical Dementia Rating Sum of Boxes (YKL-40, ICAM-1, VCAM-1 and IL-15). Finally, higher levels of CSF YKL-40, ICAM-1, and Flt-1 increased risk of development of AD dementia in patients without dementia.
Conclusions
Neuroinflammation and cerebrovascular dysfunction are early events occurring already at presymptomatic stages of AD and contribute to disease progression.
β-Amyloid (Aβ) and tau pathology in Alzheimer disease (AD) is associated with a number of cellular reactions in the surrounding tissue. AD is accompanied by activation of microglia and astrocytes1,2 that affects the clearance and production of Aβ42,3,4 development and propagation of tau pathology,5 exacerbates neurodegeneration, and influences disease progression and severity.6,7 Genome-wide association studies have identified several single nucleotide polymorphisms in immune-related genes that are linked to increased risk of AD.8 AD is also associated with cerebrovascular changes that have been implicated in neuronal dysfunction and neurodegeneration.9 AD frequently co-occurs with cerebrovascular disease10 and these conditions have common risk factors including APOE ε4, hyperlipidemia, obesity, and others.11 At the same, studies have indicated that Aβ pathology may lead to secondary vascular damage including white matter lesions, microinfarcts, and microbleeds.12
Despite several lines of evidence supporting a role of neuroinflammation and cerebrovascular dysfunction in AD, further research is needed to elucidate how these changes are linked to Aβ and tau pathology and whether they represent an early phenomenon driving neurodegeneration and clinical progression, or merely downstream bystander effects of the disease. In the present study, we measured a panel of 11 inflammatory and vascular biomarkers in CSF of 508 cognitively unimpaired elderly and 313 patients with mild cognitive impairment (MCI) and AD dementia. We examined whether these biomarkers were associated with Aβ and tau pathology, cortical atrophy, rate of longitudinal cognitive decline, and risk of AD.
Methods
Standard protocol approvals, registrations, and patient consents
The study was approved by the Regional Ethics Committee in Lund, Sweden, and the patients or their relatives gave written informed consent.
Study participants
The study population included 315 cognitively normal elderly participants (recruited from the population-based Malmö Diet Cancer Study13), 449 patients with mild cognitive complaints, and 57 patients with AD dementia enrolled consecutively at 3 memory outpatient clinics in Sweden between 2010 and 2014 (the prospective and longitudinal Swedish BioFINDER study; biofinder.se). Inclusion criteria for cognitively normal elderly were (1) age ≥60 years, (2) Mini-Mental State Examination (MMSE) 28–30 points at the screening visit, (3) absence of cognitive symptoms as evaluated by a physician, (4) fluency in Swedish, and (5) not fulfilling the criteria of MCI or any dementia. Individuals with (1) significant neurologic or psychiatric disease (e.g., stroke, Parkinson disease, multiple sclerosis, major depression), (2) significant systemic illness making it difficult to participate, or (3) significant alcohol abuse or (4) who were refusing lumbar puncture were excluded. Cognitively normal elderly underwent clinical assessments at baseline and 2-, 4-, and 6-year follow-up visits. The patients with mild cognitive complaints were thoroughly examined by physicians specialized in dementia disorders. The inclusion criteria were (1) cognitive symptoms, (2) not fulfilling the criteria for dementia, (3) MMSE 24–30 points, (4) age 60–80 years, and (5) fluent in Swedish. The exclusion criteria were (1) cognitive impairment that without doubt could be explained by another condition (other than prodromal dementia), (2) severe somatic disease, and (3) refusing lumbar puncture or neuropsychological investigation. These criteria resulted in a clinically relevant population where 193 individuals were classified as subjective cognitive decline (SCD) and 256 as MCI. The classification was based on a neuropsychological battery assessing the cognitive domains of verbal ability, visuospatial construction, episodic memory, and executive functions and the clinical assessment of a senior neuropsychologist. In agreement with US National Institute on Aging–Alzheimer's Association guidelines, cognitively normal individuals and study participants with SCD were included in the cognitively unimpaired control group.14 Patients with cognitive complaints underwent annual clinical assessments during 6-year follow-up. Patients with AD were required to meet the criteria for probable AD defined by National Institute of Neurological and Communicative Disorders and Stroke–Alzheimer’s Disease and Related Disorders Association.15 They were included when receiving their AD diagnosis and thereafter underwent annual clinical assessments. Cognitive progression was measured using the MMSE and Clinical Dementia Rating (CDR) based on thorough and standardized patient and informant rating scales, interviews, and cognitive tests. Study participants were categorized into groups with normal (Aβ−) and pathologic (Aβ+) CSF signature using the CSF Aβ42/Aβ40 ratio cutoff ≤0.1.16 Demographics are shown in table 1.
Table 1.
Demographic and clinical data

CSF sampling and analysis
Collection of lumbar CSF samples was performed at the 3 centers with participants nonfasting and the samples were analyzed according to a standardized protocol.17 Following collection, the samples were centrifuged (2,000 g, +4°C, 10 minutes), 1 mL was aliquoted into polypropylene tubes (Sarstedt AG & Co., Nümbrecht, Germany), and aliquots were stored at −80°C. All CSF samples went through one freeze–thaw cycle before the analysis when 200 µL were further aliquoted into Lobind tubes (Eppendorf Nordic A/S, Hørsholm, Denmark).
CSF concentrations of the neuroinflammatory and cerebrovascular biomarkers (interleukin [IL]–6, IL-7, IL-8, IL-15, interferon-γ–induced protein 10 [IP-10], monocyte chemoattractant protein 1 [MCP-1], intercellular adhesion molecule 1 [ICAM-1], vascular adhesion molecule 1 [VCAM-1], placental growth factor [PlGF], and fms-related tyrosine kinase 1 [Flt-1]) were analyzed using ultrasensitive Mesoscale Discovery immunoassay and a customized V-PLEX kit. These biomarker assays were selected from the preconfigured V-PLEX Neuroinflammation Panel 1 Human Kit (combining proinflammatory, cytokine, chemokine, and angiogenesis panels) if the intra-assay and interassay coefficients of variation were below 20% and if the assays were sensitive enough for CSF analysis in our test samples/runs. CSF samples were analyzed with the customized kit according to the manufacturer's recommendations with one modification: for chemokine and proinflammatory panels, samples and calibrators were incubated overnight at +4°C.
CSF concentration of YKL-40 (chitinase-3-like protein 1), Aβ42, Aβ40, total tau (t-tau), and phosphorylated tau (p-tau) were measured using ELISA kits according to the manufacturer's recommendations (YKL-40, R&D Systems, Inc., Minneapolis, MN; Aβ42, Aβ40, t-tau, EUROIMMUN AG, Lübeck, Germany; p-tau, Fujirebio, Ghent, Belgium).
All analyses were performed using one batch of reagents and samples were randomized according to diagnosis across plates/runs to minimize the effects of run-to-run variation.
MRI
A total of 735 controls and patients with MCI underwent MRI performed on a 3T Siemens (Erlangen, Germany) Trio system equipped with a standard 12-channel head coil. A single 3T MRI scanner (Siemens Medical Solutions) was used for all patients. Cortical thickness analysis modeling and volumetric estimations of cortical and subcortical brain regions were performed on structural T1 images with the FreeSurfer image analysis package version 5.3 (surfer.nmr.mgh.harvard.edu/). This software package was used for imaging intensity normalization, removal of nonbrain tissues, segmentation of cortical and subcortical brain regions into white and gray matter, spherical surface-based intersubject registration, which is based on the cortical surface curvature (sulci and gyri), and, finally, an automated parcellation of the cortical surface. FreeSurfer output was visually inspected for quality control. Of the original 735 participants, 717 had MRI segmentation from FreeSurfer. Quality control revealed 40 participants with segmentation errors and thus 677 were included in the final analysis.
Statistical analysis
SPSS version 22 (IBM, Armonk, NY) and R version 3.3.118 were used for statistical analysis. Two cases showed extremely high levels of multiple analytes and increased protein levels in CSF and were excluded from the study. IL-6, IL-8, and IP-10 were skewed (skewness 16.1, 9.1, and 14.1, respectively) and therefore ln transformed values were used in statistical analysis. Associations between CSF biomarkers of neuroinflammation and cerebrovascular changes and baseline characteristics (e.g., age, sex) were examined with the Pearson correlation and Student t tests. Some study participants were taking anti-inflammatory medications and there were also differences in age, sex, and APOE genotype between the diagnostic groups (table 1). Therefore, group differences in the biomarker levels were first tested with one-way analysis of variance and, when statistically significant, were further investigated in univariate general linear models (GLM) adjusting for the potential confounders with age, sex, APOE genotype, and anti-inflammatory medications included as covariates. For group comparisons, p values were corrected using the Bonferroni method. Associations between CSF biomarkers and tau were assessed using linear regression models. To determine whether the baseline biomarker levels were independent predictors of AD dementia, we used Cox proportional hazard regression models. All study participants were censored at their last follow-up visit or diagnosis of dementia. Because CSF biomarker scales differed considerably, standardized variables (continuous or tertiles) were used in Cox proportional hazard regression models. Associations between biomarkers and longitudinal MMSE and CDR Sum of Boxes (CDR-SB) were tested using linear mixed-effects models (with R v 3.2.3 and the lme4 package). These models had random intercepts and slopes for time and an unstructured covariance matrix for the random effects, and included the interaction between time and the biomarker as predictor. Associations between biomarkers and volumetric estimates of subcortical grey matter structures (corrected for total intracranial volume) and regional cortical thickness were studied using linear regression models adjusting for multiple comparisons with the false discovery rate procedure at a q value of 0.05. All regression models were adjusted for age, sex, and APOE genotype. The Query Design Estimate Contrast tool was used for GLM analysis at each vertex of the cortical surface. The model included sex and APOE ε4 carriers vs noncarriers as discrete factors and age as nuisance variable and cortical thickness as dependent variable. The results of the GLM analysis were corrected for multiple comparisons at the cluster level using the Monte Carlo simulation method for p cluster at p < 0.01 (z vertex 2.0).
Data availability
Anonymized data will be shared by request from any qualified investigator for the sole purpose of replicating procedures and results presented in the article and as long as data transfer is in agreement with EU legislation on the general data protection regulation.
Results
Associations with demographic data
In the whole cohort, all CSF neuroinflammatory and cerebrovascular analytes except IL-6 correlated with age (data available from Dryad) (table 1) (doi.org/10.5061/dryad.5f82b32). The levels of IL-6, MCP-1, ICAM-1, VCAM-1, and PlGF were higher in men whereas Flt-1 levels were higher in women. There were no differences in YKL-40, IL-7, IL-8, IL-15, and IP-10 between men and women or in any of the biomarkers between APOE ε4 carriers and noncarriers (data available from Dryad) (table 1) (doi.org/10.5061/dryad.5f82b32). Study participants taking anti-inflammatory medications had higher concentrations of IP-10 but did not differ in the levels of the other biomarkers from those not taking anti-inflammatory medications (data available from Dryad) (table 1) (doi.org/10.5061/dryad.5f82b32).
CSF biomarkers and amyloid pathology
To study possible associations between Aβ pathology and CSF biomarkers of neuroinflammation and cerebrovascular dysfunction, we first examined the effects of Aβ status on CSF biomarker levels in GLM, covaried for clinical diagnosis. We found that pathologic Aβ status was associated with higher levels of YKL-40, ICAM-1, VCAM-1, IL-15, and Flt-1 (all p < 0.001) in both control and MCI groups, and the interaction terms were negative (i.e., the effect of CSF Aβ status on the tested biomarkers was independent of clinical diagnosis). We did not observe any effect of Aβ status on the levels of IL-6, IL-7, IL-8, PlGF, IP-10, or MCP-1.
To establish how early in the disease course neuroinflammation and cerebrovascular changes might occur, we compared control individuals with normal Aβ status (control–/Aβ−) to study participants with preclinical disease (controls with pathologic Aβ, control–/Aβ+), prodromal disease (MCI with pathologic Aβ status, MCI–Aβ+), and AD dementia. We also wanted to establish if the CSF levels of the biomarkers were associated with disease severity. For this, we studied differences in the biomarkers between the control–Aβ+, MCI–Aβ+, and AD groups. The results are summarized in figure 1. Compared with the control–Aβ− group, the CSF levels of YKL-40, ICAM-1, VCAM-1, IL-15, and Flt-1 were increased in all groups with pathologic Aβ status (control–Aβ+, MCI–Aβ+, and AD dementia) but not in MCI–Aβ−. Furthermore, YKL-40 levels were higher in AD dementia than in control–Aβ+ and MCI–Aβ+. There were no differences in VCAM-1, Il-15, and Flt-1 levels between the groups with pathologic Aβ status (control–Aβ+, MCI–Aβ+, and AD dementia). ICAM-1 was higher in AD dementia than in control–Aβ+ and MCI–Aβ+, but the differences between the groups were confounded by the effects of age, sex, APOE ε4 genotype, and anti-inflammatory medications and were no longer significant when these covariates were included in the regression models. The rest of the significant findings were very similar when adjusting for the covariates.
Figure 1. CSF biomarkers of neuroinflammation and cerebrovascular changes in diagnostic groups.

CSF levels of YKL-40 (A), intercellular adhesion molecule 1 (ICAM-1) (B), vascular adhesion molecule 1 (VCAM-1) (C), interleukin-15 (IL-15) (D), and fms-related tyrosine kinase 1 (Flt-1) (E) in cognitively unimpaired controls and patients with mild cognitive impairment (MCI) with normal (Ctrl–β-amyloid (Aβ)−, MCI–Aβ−, Aβ42/Aβ40 >0.1) and pathologic (Ctrl–Aβ+, MCI–Aβ+, Aβ42/Aβ40 ≤0.1) CSF Aβ status and patients with Alzheimer disease (AD) dementia. For comparison, CSF levels of total tau in the same diagnostic groups are shown in (F). The dotted lines indicate median levels in the Ctrl-Aβ− group. p Values are from one-way analysis of variance; statistical significance was set to p < 0.0071 (0.05/7) to account for Bonferroni correction. The significant findings were very similar when adjusting for the covariates (age, sex, APOE ε4 genotype, and anti-inflammatory medications), with the exception of ICAM-1, for which there were no differences between the groups with pathologic CSF Aβ status (Ctrl–Aβ+, MCI–Aβ+, and AD dementia).
CSF biomarkers and tau
We next examined relationships between biomarkers of neuroinflammation and cerebrovascular dysfunction (YKL-40, ICAM-1, VCAM-1, IL-15, Flt-1) and CSF tau (t-tau and p-tau), and whether these relationships differed between individuals with normal and pathologic Aβ status. In the whole cohort, higher CSF levels of all biomarkers were associated with higher levels of t-tau and p-tau in both in Aβ-negative and Aβ-positive groups (table 2). YKL-40, ICAM-1, VCAM-1, IL-15, and Flt-1 interacted with Aβ status to predict t-tau (YKL-40 p < 0.001; ICAM-1 p = 0.040; VCAM-1 p = 0.002; IL-15 p = 0.043; Flt-1 p = 0.001). Increased levels of YKL-40, ICAM-1, VCAM-1, IL-15, and Flt-1 were associated with higher levels of t-tau in Aβ-positive than Aβ-negative people (figure 2A and table 2). We also found interaction effects between YKL-40, ICAM-1, VCAM-1, and Aβ status for p-tau (p < 0.001, p = 0.024, and p = 0.011) (figure 2B and table 2). Higher levels of IL-15 and Flt-1 were associated with higher p-tau levels, but these associations did not depend on Aβ status, i.e., were similar in Aβ-positive and Aβ-negative study participants. The differences in slopes between Aβ-positive and -negative individuals were particularly pronounced for YKL-40. The associations with t-tau and p-tau were similar in individual diagnostic groups (data available from Dryad) (tables 3 and 4) (doi.org/10.5061/dryad.5f82b32).
Table 2.
Associations between CSF biomarkers of neuroinflammation and cerebrovascular dysfunction and tau by β-amyloid (Aβ) status in the whole cohort

Figure 2. CSF biomarkers of neuroinflammation and cerebrovascular changes, CSF tau, and cortical atrophy.

(A, B) Association between CSF YKL-40 and total tau (t-tau) and CSF YKL-40 and phosphorylated tau (p-tau), respectively, in study participants with normal (β-amyloid [Aβ]−) and pathologic (Aβ+) CSF status. Unstandardized B coefficients and p values for slopes are from linear regression models. The results were very similar when adjusting for the covariates (age, sex, APOE ε4 genotype, and anti-inflammatory medications). (C) Associations between YKL-40 and cortical thickness. Voxel-wise regression analysis corrected for age, sex, and APOE ε4.
The significant associations between the biomarkers and tau were very similar when adjusting for the covariates (age, sex, APOE ε4 genotype, and anti-inflammatory medications) (data available from Dryad) (table 4) (doi.org/10.5061/dryad.5f82b32). Anti-inflammatory medications did not show significant effects in any of the statistical tests and only age, sex, and APOE ε4 were included as covariates in all subsequent statistical analysis.
CSF biomarkers and gray matter atrophy
We performed voxel-wise regression analysis, which showed that high levels of CSF YKL-40 were associated with cortical thinning mostly in parietal areas including precuneus, posterior cingulate, and superior parietal cortices (figure 2C). Similar patterns were observed for the other biomarkers with further involvement of frontal regions (data available from Dryad) (figure 1) (doi.org/10.5061/dryad.5f82b32). In addition, higher levels of Flt-1 correlated with increased cortical thickness in insula, temporal, and cingulate cortices. In region of interest–based analyses, we found similar associations between CSF biomarkers and cortical thickness in some but not all areas that were significant in the voxel-wise regression models (data available from Dryad) (table 5) (doi.org/10.5061/dryad.5f82b32). The most consistent findings were associations between higher levels of the biomarkers and cortical thinning in the precuneus and superior parietal cortex (figure 2C) (data available from Dryad) (figure 1 and table 5) (doi.org/10.5061/dryad.5f82b32). When studying associations with subcortical gray matter volumes, we found that high levels of YKL-40 (but not other biomarkers) where associated with reduced volumes of left and right caudate and left amygdala (β = −0.092, p = 0.036; β = −0.124, p < 0.001; β = −0.102, p = 0.030; false discovery rate–adjusted p values).
CSF biomarkers and AD progression
Associations between CSF biomarkers of neuroinflammation and cognitive decline were assessed in control participants and patients with MCI with repeated MMSE and CDR scores available at each visit (n = 757, average follow-up 3 years, range 1–6 years). Higher levels of YKL40 were associated with lower MMSE at baseline and with more rapid longitudinal decline in MMSE (table 3). Increased levels of YKL-40, VCAM-1, and IL-15 were associated with higher baseline CDR-SB. Increased levels of these biomarkers as well as ICAM-1 were also associated with more rapid longitudinal increase in CDR-SB (table 3).
Table 3.
Associations between baseline CSF biomarker levels and cognition

Follow-up diagnosis was available from 728 study participants who were cognitively unimpaired or had MCI at baseline, of whom 115 (15.8%) progressed to AD dementia (average follow-up 3 years, range 1–6 years). Cox regression analysis including age, sex, and APOE ε4 as covariates showed that YKL-40, ICAM-1, and Flt-1, but not VCAM-1 and IL-15, were independent predictors of time to AD diagnosis (table 4). Compared to the lowest tertiles, the highest tertiles of YKl-40 (p = 0.005), ICAM-1 (p = 0.001) and Flt-1 (p = 0.007), but not the middle tertiles, were associated with increased risk of AD dementia (figure 3).
Table 4.
Cox proportional hazards model of time to Alzheimer disease (AD) dementia diagnosis
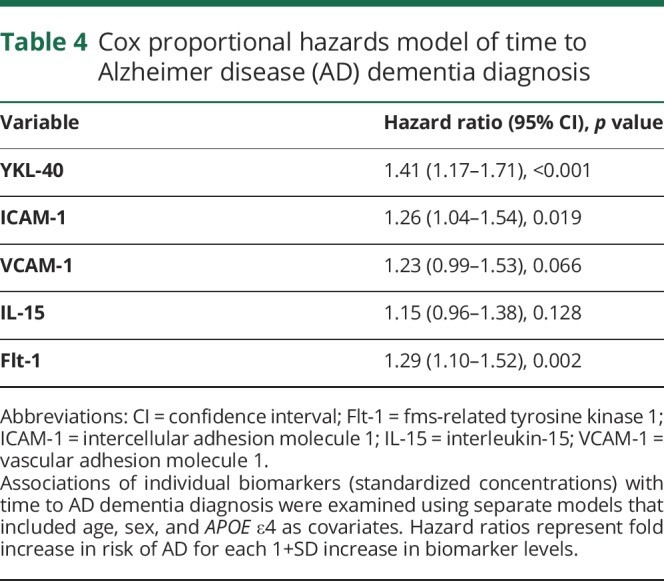
Figure 3. CSF biomarkers of neuroinflammation and cerebrovascular changes and progression to Alzheimer disease (AD).

Kaplan-Meier curves of progression from cognitively normal and mild cognitive impairment (MCI) to AD for tertiles of YKL-40 (A), intercellular adhesion molecule 1 (ICAM-1) (B), and fms-related tyrosine kinase 1 (Flt-1) (C).
Discussion
We found that CSF levels of 5 biomarkers of neuroinflammation and cerebrovascular dysfunction (YKl-40, ICAM-1, VCAM-1, IL-15, and Flt-1) were increased in AD already during the preclinical and prodromal stages. These biomarkers were associated with CSF tau, especially in Aβ-positive individuals. Further, increased concentrations of the biomarkers correlated with cortical thinning in the precuneus and superior parietal cortex. Finally, the longitudinal data suggested that higher levels of the neuroinflammatory and cerebrovascular biomarkers were associated with cognitive decline and increased risk of subsequent development of AD.
YKL-40 is a secreted glycoprotein that in the CNS is expressed by microglia and astrocytes19,20 and is considered one of the most promising biomarkers of neuroinflammation in AD. Our findings on YKL-40 agree with previous data showing increased CSF levels of this protein in preclinical, prodromal, and dementia stages of AD.21–24 A recent meta-analysis confirmed elevated levels of YKL-40 in AD dementia, although the association with AD was moderate compared with the core CSF AD biomarkers Aβ42, t-tau, and p-tau.25 Earlier studies have indicated that CSF YKL-40 is associated with tau pathology, since it may identify individuals with abnormal tau levels in CSF.21,26
We also showed that other CSF biomarkers of neuroinflammation and cerebrovascular dysfunction, including ICAM-1, VCAM-1, IL-15, and Flt-1, were associated with Aβ pathology, e.g., their levels were elevated in individuals with pathologic CSF Aβ status. ICAM-1 and VCAM-1 are adhesion molecules that are upregulated in endothelial cells under inflammatory conditions.27 In postmortem tissue from patients with AD, increased expression of ICAM-1 has been detected in plaques and astrocytes around plaques.28 High levels of ICAM-1 in temporal and cingulate cortices have been shown to correlate with larger Aβ plaque and neurofibrillary tangle loads in Lewy body disorder.29 Il-15 is a pleiotropic cytokine produced by many different cell types that regulates development, survival, and function of peripheral lymphocytes.30 While IL-15 could be found in both microglia and astrocytes, high expression by astrocytes has been shown to exacerbate tissue damage in multiple sclerosis and following brain ischemia.31,32 Flt-1 is one of the main receptors of the vascular endothelial growth factor (VEGF) family widely expressed in the vascular system.33 Apart from its role in the regulation of angiogenesis, Flt-1 (together with other members of VEGF family) has been implicated in glial cell development and adult neurogenesis.34 In animal models of cerebral ischemia, expression of Flt-1 is increased in astrocytes, endothelial cells, and neurons.35 Interestingly, upregulation of Flt-1 has been observed in the entorhinal cortical sections from human AD brain and in human microglia cells following treatment with Aβ42.36 One study has previously reported no difference in serum Flt-1 levels between patients with AD and healthy controls.37 Earlier investigations that have measured CSF and blood levels of ICAM-1, VCAM-1, and IL-15 in AD have produced conflicting results.38–42 This inconsistency in results could be partly due to heterogeneity of sample populations, various confounding factors, and small sample sizes. In the present study, using a large cohort of well-characterized patients, we show increased levels of ICAM-1, VCAM-1, IL-15, and Flt-1in AD at the preclinical, prodromal, and dementia stage, indicating that neuroinflammatory pathways are activated early in the disease course. These findings are in keeping with a recent report demonstrating that serum and CSF neuroinflammation biomarker signatures that included ICAM-1, VCAM-1, IL-15, and Flt-1 could identify individuals who had AD CSF profile (abnormal p-tau/Aβ42 ratio) in a group of patients with MCI.43 Of note, there was a considerable overlap in the CSF levels of YKL-40, ICAM-1, VCAM-1, IL-15, and Flt-1 between different groups in our study, suggesting that AD might be accompanied by neuroinflammation and cerebrovascular dysfunction in a subpopulation of patients. Future investigations assessing longitudinal changes in the biomarker levels are warranted in order to further clarify the roles of neuroinflammation and cerebrovascular dysfunction in AD progression including the development of tau pathology.
Previous studies have shown that higher CSF YKL-40 was associated with higher CSF tau, supporting a link between neuroinflammation and neurodegeneration.21 Accordingly, YKL-40 could distinguish patients with tau pathology from healthy controls.26 Here we report correlations between tau and several biomarkers of neuroinflammation and cerebrovascular dysfunction (YKL-40, ICAM-1, VCAM-1, IL-15, and Flt-1). Notably, the correlations were stronger in individuals with abnormal levels of CSF Aβ, indicating that the associations among neuroinflammatory, cerebrovascular, and neurodegenerative processes may be aggravated in the presence of Aβ pathology. The difference in the slopes was more pronounced for YKL-40 than for the other biomarkers (tables 2). A possible explanation for this finding could be that YKL-40 continued to increase with disease progression and reached its highest levels in AD dementia, whereas there were no differences in the levels of the other biomarkers among Aβ-positive controls, patients with prodromal AD, and patients with AD dementia. Thus, these data support the hypothesis that YKL-40 is associated with AD-related tau pathology in individuals with abnormal Aβ deposition.
High CSF levels of neuroinflammatory biomarkers correlated with cortical thinning predominantly in the precuneus and superior parietal cortex, but not in temporal areas, as has been reported for YKL-40 in a relatively smaller study.44 Both the precuneus and superior parietal cortex are parts of AD cortical signature that includes a set of cortical regions with consistent pattern of atrophy across different disease stages.45 Interestingly, the precuneus is one the nodes of the default mode network, where early deposition of Aβ occurs.46 Of relevance, PET studies have indicated increased microglia activation in the precuneus and parietal cortex in AD.47,48
In patients without dementia, higher levels of YKL-40 were associated with more rapid changes in MMSE and CDR-SB. At the same time, higher CSF levels of YKL-40, ICAM-1, VCAM-1, and IL-15 were related to more rapid increase in CDR-SB. Further, higher levels of the biomarkers were associated with increased risk of future AD. Two earlier reports have found that YKL-40 predicted progression to AD.22,49 Here we corroborate these findings in a considerably larger cohort. Moreover, we show that not only YKL-40 but also other biomarkers of neuroinflammation and cerebrovascular dysfunction are associated with cognitive impairment, thus suggesting that multiple neuroinflammatory and cerebrovascular factors might contribute to disease progression.
We demonstrate that AD is accompanied by longstanding changes in CSF levels of neuroinflammatory and cerebrovascular biomarkers, starting already at preclinical disease stages. These changes most likely reflect neuroinflammation and cerebrovascular dysfunction in the brain and our data indicate that these pathologic processes may contribute to tau pathology, neurodegeneration, cortical atrophy, and increased risk of AD dementia. Thus, our study provides evidence of the role of neuroinflammation and cerebrovascular dysfunction in AD and offers potential targets for novel therapeutic interventions.
Acknowledgment
The authors thank the study participants, research nurses, and technicians involved in the study.
Glossary
- Aβ
β-Amyloid
- AD
Alzheimer disease
- CDR
Clinical Dementia Rating
- CDR-SB
Clinical Dementia Rating Sum of Boxes
- Flt-1
fms-related tyrosine kinase 1
- GLM
general linear model
- ICAM-1
intercellular adhesion molecule 1
- IL
interleukin
- IP-10
interferon-γ–induced protein 10
- MCI
mild cognitive impairment
- MCP-1
monocyte chemoattractant protein 1
- MMSE
Mini-Mental State Examination
- p-tau
phosphorylated tau
- PlGF
placental growth factor
- SCD
subjective cognitive decline
- t-tau
total tau
- VCAM-1
vascular adhesion molecule 1
- VEGF
vascular endothelial growth factor
Author contributions
Drs. Janelidze, Mattsson, Stomrud, Lindberg, Palmqvist, Zetterberg, Blennow, and Hansson collected the data and reviewed the manuscript for intellectual content. Drs. Janelidze, Mattsson, Lindberg, and Hansson analyzed and interpreted the data. Drs. Janelidze and Hansson prepared figures and cowrote the manuscript. Dr. Hansson was the principal designer and coordinator of the study and overviewed collection, analysis, and interpretation of the study data.
Study funding
The study was supported by the European Research Council, the Swedish Research Council, The Swedish Alzheimer Foundation, the Swedish Brain Foundation, the Marianne and Marcus Wallenberg Foundation, and the Swedish Federal Government under the ALF Agreement and Greta and Johan Kock Foundation. The funding sources had no role in the design and conduct of the study; in the collection, analysis, interpretation of the data; or in the preparation, review, or approval of the manuscript.
Disclosure
S. Janelidze, N. Mattsson, E. Stomrud, O. Lindberg, and S. Palmqvist report no disclosures relevant to the manuscript. H. Zetterberg is a co-founder of Brain Biomarker Solutions in Gothenburg AB, a GU Ventures-based platform company at the University of Gothenburg, has served on advisory boards of Eli Lilly and Roche Diagnostics, and has received travel support from TEVA. K. Blennow is a co-founder of Brain Biomarker Solutions in Gothenburg AB, a GU Ventures-based platform company at the University of Gothenburg, and has served on advisory boards of Eli Lilly, Fujirebio Europe, IBL International, Novartis, and Roche Diagnostics. O. Hansson has acquired research support (for the institution) from Roche, GE Healthcare, Biogen, AVID Radiopharmaceuticals, Fujirebio, and Euroimmun. In the last 2 years, he has received consultancy/speaker fees (paid to the institution) from Lilly, Roche, and Fujirebio. Go to Neurology.org/N for full disclosures.
References
- 1.McGeer PL, Itagaki S, Tago H, McGeer EG. Reactive microglia in patients with senile dementia of the Alzheimer type are positive for the histocompatibility glycoprotein HLA-DR. Neurosci Lett 1987;79:195–200. [DOI] [PubMed] [Google Scholar]
- 2.Rogers J, Luber-Narod J, Styren SD, Civin WH. Expression of immune system-associated antigens by cells of the human central nervous system: relationship to the pathology of Alzheimer's disease. Neurobiol Aging 1988;9:339–349. [DOI] [PubMed] [Google Scholar]
- 3.Hickman SE, Allison EK, El Khoury J. Microglial dysfunction and defective beta-amyloid clearance pathways in aging Alzheimer's disease mice. J Neurosci 2008;28:8354–8360. [DOI] [PMC free article] [PubMed] [Google Scholar]
- 4.Liu CC, Hu J, Zhao N, et al. Astrocytic LRP1 mediates brain abeta clearance and impacts amyloid deposition. J Neurosci 2017;37:4023–4031. [DOI] [PMC free article] [PubMed] [Google Scholar]
- 5.Asai H, Ikezu S, Tsunoda S, et al. Depletion of microglia and inhibition of exosome synthesis halt tau propagation. Nat Neurosci 2015;18:1584–1593. [DOI] [PMC free article] [PubMed] [Google Scholar]
- 6.Block ML, Zecca L, Hong JS. Microglia-mediated neurotoxicity: uncovering the molecular mechanisms. Nat Rev Neurosci 2007;8:57–69. [DOI] [PubMed] [Google Scholar]
- 7.Calsolaro V, Edison P. Neuroinflammation in Alzheimer's disease: current evidence and future directions. Alzheimers Dement 2016;12:719–732. [DOI] [PubMed] [Google Scholar]
- 8.Efthymiou AG, Goate AM. Late onset Alzheimer's disease genetics implicates microglial pathways in disease risk. Mol Neurodegener 2017;12:43. [DOI] [PMC free article] [PubMed] [Google Scholar]
- 9.Zlokovic BV. Neurovascular pathways to neurodegeneration in Alzheimer's disease and other disorders. Nat Rev Neurosci 2011;12:723–738. [DOI] [PMC free article] [PubMed] [Google Scholar]
- 10.Jellinger KA, Attems J. Prevalence of dementia disorders in the oldest-old: an autopsy study. Acta Neuropathol 2010;119:421–433. [DOI] [PubMed] [Google Scholar]
- 11.Love S, Miners JS. Cerebrovascular disease in ageing and Alzheimer's disease. Acta Neuropathol 2016;131:645–658. [DOI] [PMC free article] [PubMed] [Google Scholar]
- 12.Smith EE, Greenberg SM. Beta-amyloid, blood vessels, and brain function. Stroke 2009;40:2601–2606. [DOI] [PMC free article] [PubMed] [Google Scholar]
- 13.Berglund G, Elmstahl S, Janzon L, Larsson SA. The Malmo Diet and Cancer Study: design and feasibility. J Intern Med 1993;233:45–51. [DOI] [PubMed] [Google Scholar]
- 14.Jack CR Jr, Bennett DA, Blennow K, et al. NIA-AA research framework: towards a biological definition of Alzheimer's disease. Alzheimers Dement 2018;14:535–562. [DOI] [PMC free article] [PubMed] [Google Scholar]
- 15.McKhann GM, Knopman DS, Chertkow H, et al. The diagnosis of dementia due to Alzheimer's disease: recommendations from the National Institute on Aging–Alzheimer's Association workgroups on diagnostic guidelines for Alzheimer's disease. Alzheimers Dement 2011;7:263–269. [DOI] [PMC free article] [PubMed] [Google Scholar]
- 16.Janelidze S, Zetterberg H, Mattsson N, et al. CSF Abeta42/Abeta40 and Abeta42/Abeta38 ratios: better diagnostic markers of Alzheimer disease. Ann Clin Transl Neurol 2016;3:154–165. [DOI] [PMC free article] [PubMed] [Google Scholar]
- 17.Palmqvist S, Zetterberg H, Blennow K, et al. Accuracy of brain amyloid detection in clinical practice using cerebrospinal fluid beta-amyloid 42: a cross-validation study against amyloid positron emission tomography. JAMA Neurol 2014;71:1282–1289. [DOI] [PubMed] [Google Scholar]
- 18.Team RC. R: language and environment for statistical computing. In: R Foundation for Statistical Computing. Vienna, Austria: 2014. Available at: r-project.org/. Accessed September 17, 2016. [Google Scholar]
- 19.Canto E, Tintore M, Villar LM, et al. Chitinase 3-like 1: prognostic biomarker in clinically isolated syndromes. Brain 2015;138:918–931. [DOI] [PubMed] [Google Scholar]
- 20.Querol-Vilaseca M, Colom-Cadena M, Pegueroles J, et al. YKL-40 (Chitinase 3-like I) is expressed in a subset of astrocytes in Alzheimer's disease and other tauopathies. J Neuroinflammation 2017;14:118. [DOI] [PMC free article] [PubMed] [Google Scholar]
- 21.Alcolea D, Martinez-Lage P, Sanchez-Juan P, et al. Amyloid precursor protein metabolism and inflammation markers in preclinical Alzheimer disease. Neurology 2015;85:626–633. [DOI] [PubMed] [Google Scholar]
- 22.Craig-Schapiro R, Perrin RJ, Roe CM, et al. YKL-40: a novel prognostic fluid biomarker for preclinical Alzheimer's disease. Biol Psychiatry 2010;68:903–912. [DOI] [PMC free article] [PubMed] [Google Scholar]
- 23.Janelidze S, Hertze J, Zetterberg H, et al. Cerebrospinal fluid neurogranin and YKL-40 as biomarkers of Alzheimer's disease. Ann Clin Transl Neurol 2016;3:12–20. [DOI] [PMC free article] [PubMed] [Google Scholar]
- 24.Mattsson N, Tabatabaei S, Johansson P, et al. Cerebrospinal fluid microglial markers in Alzheimer's disease: elevated chitotriosidase activity but lack of diagnostic utility. Neuromolecular Med 2011;13:151–159. [DOI] [PubMed] [Google Scholar]
- 25.Olsson B, Lautner R, Andreasson U, et al. CSF and blood biomarkers for the diagnosis of Alzheimer's disease: a systematic review and meta-analysis. Lancet Neurol 2016;15:673–684. [DOI] [PubMed] [Google Scholar]
- 26.Baldacci F, Toschi N, Lista S, et al. Two-level diagnostic classification using cerebrospinal fluid YKL-40 in Alzheimer's disease. Alzheimers Dement 2017;13:993–1003. [DOI] [PubMed] [Google Scholar]
- 27.Lee SJ, Benveniste EN. Adhesion molecule expression and regulation on cells of the central nervous system. J Neuroimmunol 1999;98:77–88. [DOI] [PubMed] [Google Scholar]
- 28.Akiyama H, Kawamata T, Yamada T, Tooyama I, Ishii T, McGeer PL. Expression of intercellular adhesion molecule (ICAM)-1 by a subset of astrocytes in Alzheimer disease and some other degenerative neurological disorders. Acta Neuropathol 1993;85:628–634. [DOI] [PubMed] [Google Scholar]
- 29.Walker DG, Lue LF, Tang TM, et al. Changes in CD200 and intercellular adhesion molecule-1 (ICAM-1) levels in brains of Lewy body disorder cases are associated with amounts of Alzheimer's pathology not alpha-synuclein pathology. Neurobiol Aging 2017;54:175–186. [DOI] [PMC free article] [PubMed] [Google Scholar]
- 30.Jabri B, Abadie V. IL-15 functions as a danger signal to regulate tissue-resident T cells and tissue destruction. Nat Rev Immunol 2015;15:771–783. [DOI] [PMC free article] [PubMed] [Google Scholar]
- 31.Li M, Li Z, Yao Y, et al. Astrocyte-derived interleukin-15 exacerbates ischemic brain injury via propagation of cellular immunity. Proc Natl Acad Sci USA 2017;114:E396–E405. [DOI] [PMC free article] [PubMed] [Google Scholar]
- 32.Saikali P, Antel JP, Pittet CL, Newcombe J, Arbour N. Contribution of astrocyte-derived IL-15 to CD8 T cell effector functions in multiple sclerosis. J Immunol 2010;185:5693–5703. [DOI] [PubMed] [Google Scholar]
- 33.Olsson AK, Dimberg A, Kreuger J, Claesson-Welsh L. VEGF receptor signalling: in control of vascular function. Nat Rev Mol Cell Biol 2006;7:359–371. [DOI] [PubMed] [Google Scholar]
- 34.Wittko-Schneider IM, Schneider FT, Plate KH. Brain homeostasis: VEGF receptor 1 and 2-two unequal brothers in mind. Cell Mol Life Sci 2013;70:1705–1725. [DOI] [PMC free article] [PubMed] [Google Scholar]
- 35.Greenberg DA, Jin K. Vascular endothelial growth factors (VEGFs) and stroke. Cell Mol Life Sci 2013;70:1753–1761. [DOI] [PMC free article] [PubMed] [Google Scholar]
- 36.Ryu JK, Cho T, Choi HB, Wang YT, McLarnon JG. Microglial VEGF receptor response is an integral chemotactic component in Alzheimer's disease pathology. J Neurosci 2009;29:3–13. [DOI] [PMC free article] [PubMed] [Google Scholar]
- 37.Kim YN, Kim DH. Decreased serum angiogenin level in Alzheimer's disease. Prog Neuropsychopharmacol Biol Psychiatry 2012;38:116–120. [DOI] [PubMed] [Google Scholar]
- 38.Huang CW, Tsai MH, Chen NC, et al. Clinical significance of circulating vascular cell adhesion molecule-1 to white matter disintegrity in Alzheimer's dementia. Thromb Haemost 2015;114:1230–1240. [DOI] [PubMed] [Google Scholar]
- 39.Johansson P, Almqvist EG, Wallin A, et al. Reduced cerebrospinal fluid concentration of interleukin-12/23 subunit p40 in patients with cognitive impairment. PLoS One 2017;12:e0176760. [DOI] [PMC free article] [PubMed] [Google Scholar]
- 40.Nielsen HM, Londos E, Minthon L, Janciauskiene SM. Soluble adhesion molecules and angiotensin-converting enzyme in dementia. Neurobiol Dis 2007;26:27–35. [DOI] [PubMed] [Google Scholar]
- 41.Rentzos M, Michalopoulou M, Nikolaou C, et al. The role of soluble intercellular adhesion molecules in neurodegenerative disorders. J Neurol Sci 2005;228:129–135. [DOI] [PubMed] [Google Scholar]
- 42.Rentzos M, Zoga M, Paraskevas GP, et al. IL-15 is elevated in cerebrospinal fluid of patients with Alzheimer's disease and frontotemporal dementia. J Geriatr Psychiatry Neurol 2006;19:114–117. [DOI] [PubMed] [Google Scholar]
- 43.Popp J, Oikonomidi A, Tautvydaite D, et al. Markers of neuroinflammation associated with Alzheimer's disease pathology in older adults. Brain Behav Immun 2017;62:203–211. [DOI] [PubMed] [Google Scholar]
- 44.Alcolea D, Vilaplana E, Pegueroles J, et al. Relationship between cortical thickness and cerebrospinal fluid YKL-40 in predementia stages of Alzheimer's disease. Neurobiol Aging 2015;36:2018–2023. [DOI] [PubMed] [Google Scholar]
- 45.Dickerson BC, Bakkour A, Salat DH, et al. The cortical signature of Alzheimer's disease: regionally specific cortical thinning relates to symptom severity in very mild to mild AD dementia and is detectable in asymptomatic amyloid-positive individuals. Cereb Cortex 2009;19:497–510. [DOI] [PMC free article] [PubMed] [Google Scholar]
- 46.Palmqvist S, Scholl M, Strandberg O, et al. Earliest accumulation of beta-amyloid occurs within the default-mode network and concurrently affects brain connectivity. Nat Commun 2017;8:1214. [DOI] [PMC free article] [PubMed] [Google Scholar]
- 47.Fan Z, Brooks DJ, Okello A, Edison P. An early and late peak in microglial activation in Alzheimer's disease trajectory. Brain 2017;140:792–803. [DOI] [PMC free article] [PubMed] [Google Scholar]
- 48.Hamelin L, Lagarde J, Dorothee G, et al. Early and protective microglial activation in Alzheimer's disease: a prospective study using 18F-DPA-714 PET imaging. Brain 2016;139:1252–1264. [DOI] [PubMed] [Google Scholar]
- 49.Kester MI, Teunissen CE, Sutphen C, et al. Cerebrospinal fluid VILIP-1 and YKL-40, candidate biomarkers to diagnose, predict and monitor Alzheimer's disease in a memory clinic cohort. Alzheimers Res Ther 2015;7:59. [DOI] [PMC free article] [PubMed] [Google Scholar]
Associated Data
This section collects any data citations, data availability statements, or supplementary materials included in this article.
Data Availability Statement
Anonymized data will be shared by request from any qualified investigator for the sole purpose of replicating procedures and results presented in the article and as long as data transfer is in agreement with EU legislation on the general data protection regulation.