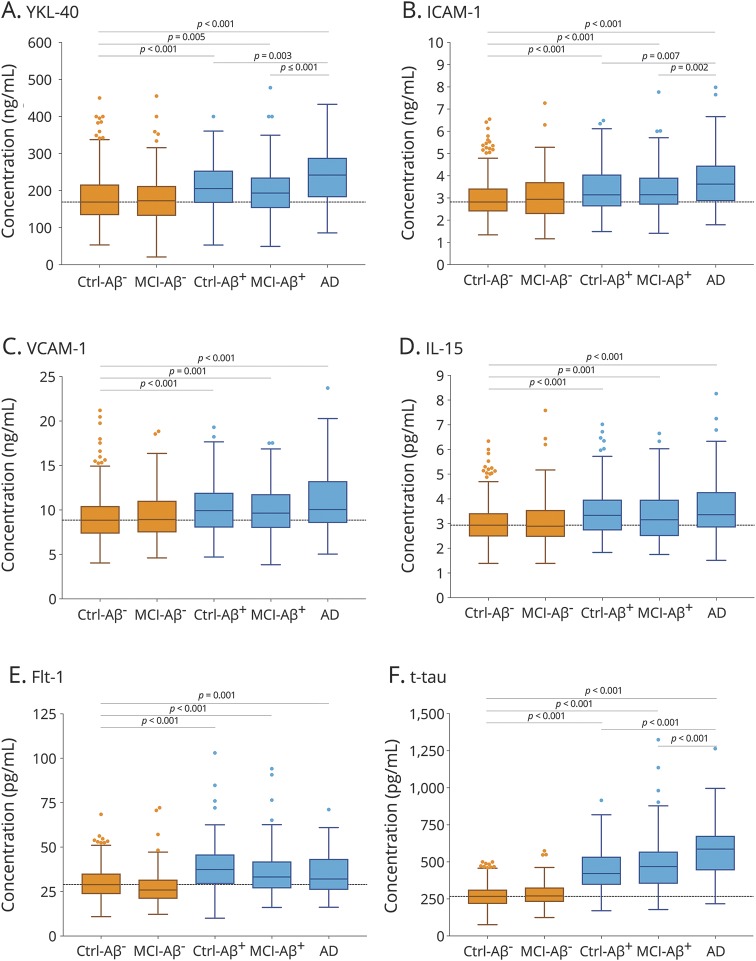
Figure 1. CSF biomarkers of neuroinflammation and cerebrovascular changes in diagnostic groups.
CSF levels of YKL-40 (A), intercellular adhesion molecule 1 (ICAM-1) (B), vascular adhesion molecule 1 (VCAM-1) (C), interleukin-15 (IL-15) (D), and fms-related tyrosine kinase 1 (Flt-1) (E) in cognitively unimpaired controls and patients with mild cognitive impairment (MCI) with normal (Ctrl–β-amyloid (Aβ)−, MCI–Aβ−, Aβ42/Aβ40 >0.1) and pathologic (Ctrl–Aβ+, MCI–Aβ+, Aβ42/Aβ40 ≤0.1) CSF Aβ status and patients with Alzheimer disease (AD) dementia. For comparison, CSF levels of total tau in the same diagnostic groups are shown in (F). The dotted lines indicate median levels in the Ctrl-Aβ− group. p Values are from one-way analysis of variance; statistical significance was set to p < 0.0071 (0.05/7) to account for Bonferroni correction. The significant findings were very similar when adjusting for the covariates (age, sex, APOE ε4 genotype, and anti-inflammatory medications), with the exception of ICAM-1, for which there were no differences between the groups with pathologic CSF Aβ status (Ctrl–Aβ+, MCI–Aβ+, and AD dementia).

