Abstract
Objective
To examine the independent and interactive influences of neuroimaging biomarkers on retrospective cognitive decline.
Methods
A total of 152 middle-aged and older adult participants with at least 2 clinical and cognitive assessments, a Clinical Dementia Rating score of 0 or 0.5, and a flortaucipir (18F-AV-1451) tau PET scan, a florbetapir (18F-AV-45) amyloid PET scan, and a structural MRI scan were recruited from the Knight Alzheimer Disease Research Center at Washington University in St. Louis. Cognition was assessed with standard measures reflecting episodic memory, executive functioning, semantic fluency, and processing speed.
Results
Results from retrospective longitudinal analyses showed that each biomarker had a univariate association with the global cognitive composite; however, when each marker was analyzed in a single statistical model, only tau was a significant predictor of global cognitive decline. There was an interaction between tau and amyloid such that tau-related cognitive decline was worse in individuals with high amyloid. There was also an interaction with hippocampal volume indicating that individuals with high levels of all 3 pathologies exhibited the greatest declines in cognition. Additional analyses within each cognitive domain indicated that tau had the largest negative influence on tests of episodic memory and executive functioning.
Conclusions
Together, these results suggest that increasing levels of tau most consistently relate to declines in cognition preceding biomarker collection. These findings support models of Alzheimer disease (AD) staging that suggest that elevated β-amyloid alone may be insufficient to produce cognitive change in individuals at risk for AD and support the use of multiple biomarkers to stage AD progression.
Alzheimer disease (AD) pathology accumulates for decades before the onset of clinically apparent symptoms.1,2 Staging individuals in terms of relative risk of developing dementia with in vivo biomarkers that represent the major pathologies of AD is critical for targeting participants for recruitment into secondary prevention trials and for understanding disease progression. Currently available biomarkers fall into 3 major categories: amyloid (typically measured with CSF β-amyloid1-42 or amyloid PET), tau (measured with CSF phosphorylated tau181 or tau PET), and neurodegeneration (fluorodeoxyglucose-PET, structural MRI, or CSF total tau).3 It is important to understand how these biomarkers interact to influence cognitive change to isolate the combination of pathologies that contribute most to decline.
The goal of this study was to determine the unique and interactive effects of neuroimaging biomarkers for amyloid (amyloid PET), tau (tau PET), and neurodegeneration (hippocampal volume) on change in cognition in asymptomatic to very mildly symptomatic AD. We hypothesized that each biomarker would have a significant univariate association with longitudinal decline when assessed individually. However, we also hypothesized that a combined model with all biomarkers included would reveal that tau PET demonstrated the strongest associations with cognition.4–6 Finally, we hypothesized that amyloid PET would interact with both tau PET and hippocampal volume to influence cognitive decline but that tau PET and hippocampal volume would demonstrate no interaction because markers of neurodegeneration in AD are likely to be mediated by tauopathy.7
Methods
Participants
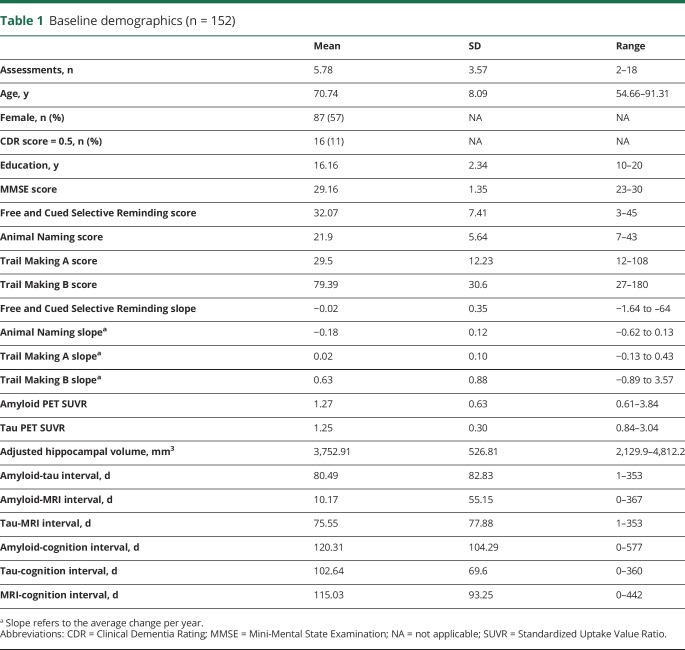
Participants were volunteers enrolled in longitudinal studies of memory and aging at the Knight Alzheimer Disease Research Center at Washington University in St. Louis (Knight ADRC). Participants were drawn from 2 cohorts: the Adult Children Study (ACS) and the Healthy Aging and Senile Dementia (HASD) study. To be included in the analyses, individuals were required to have at least 1 tau PET scan, 1 amyloid PET scan, and a structural MRI together with ≥2 clinical and cognitive assessments. All imaging scans were required to be <1 year apart. Because we are interested in the transition from cognitive normality to very mild AD, we included participants with a Clinical Dementia Rating (CDR)8 score of ≤0.5. Although we include the CDR rating as a covariate in all of our models, we do not pursue analyses within diagnostic groups per se. The final sample that met these criteria included 155 participants. However, 1 participant had a Mini-Mental State Examination score of 14, and 2 participants exhibited annualized cognitive change >4 SDs from the mean of the group. To prevent extreme outliers from skewing linear models, these participants were excluded, leaving 152 individuals available for analysis. However, it should be noted that removal or retention of these 3 participants did not qualitatively change the reported pattern of results. A summary of the demographic and clinical characteristics of this cohort is provided in table 1.
Table 1.
Baseline demographics (n = 152)
Standard protocol approvals, registrations, and patient consents
All participants signed a standard informed consent document, and all procedures were approved by the Institutional Review Board at Washington University in St. Louis.
Clinical and cognitive assessment
Each individual underwent annual clinical and cognitive assessments. Presence and severity of dementia were determined by experienced clinicians using the CDR. A CDR rating of 0 indicates absence of dementia, and ratings of 0.5, 1, 2, and 3 indicate very mild, mild, moderate, and severe dementia, respectively. Each cohort at the Knight ADRC receives slightly different cognitive batteries, and in the interest of maximizing the available sample size, only tests common across all cohorts were considered for the present analyses. These tests included a measure of episodic memory, the free recall score from the Free and Cued Selective Reminding Test9; a measure of semantic memory retrieval, category fluency for Animal Naming10; a test of processing speed, Trail Making Part A; and a test of executive function, Trail Making Part B.11 Tests were standardized using the sample mean and SD of the cognitive assessment that was nearest to the tau PET scan and then averaged together to form a cognitive composite score. Follow-up tests on each component of the composite were also performed to assess whether the biomarkers have differential influences on distinct cognitive domains.
Imaging
Amyloid PET imaging was performed with florbetapir (18F-AV-45) and was acquired on a Biograph mMR (Siemens Medical Solutions, Malvern, PA). Participants received an injection of between 7.4 and 11.3 (mean 10.0) mCi, and data from the 50- to 70-minute postinjection window were converted to standardized uptake value ratios (SUVRs) with the cerebellar cortex used as a reference region. PET data were processed with an in-house pipeline using regions of interest derived from FreeSurfer (PET Unified Pipeline, github.com/ysu001/PUP). Partial volume correction was performed with a regional spread function technique.12,13 This approach corrects for the spillover signal from adjacent regions of interest and nonbrain tissue on the basis of the scanner point spread function and the relative distance between regions. This partial volume correction approach accounts not only for spillover from different areas in the brain but also for spillover from nonbrain regions into the brain.
Amyloid deposition was quantified with the average across the left and right lateral orbitofrontal, medial orbitofrontal, rostral middle frontal, superior frontal, superior temporal, middle temporal, and precuneus regions.14
Tau PET imaging used the tracer 18F-AV-1451 (flortaucipir) and was acquired on a Biograph 40 PET/CT scanner (Siemens Medical Solutions). Participants were administered an intravenous injection of between 6.8 and 10.9 mCi (mean = 9.3) of AV-1451. Data from the 80- to 100-minute postinjection window were converted to SUVRs using a cerebellar cortex reference and partial volume corrected. Deposition was summarized with the average of bilateral entorhinal cortex, amygdala, inferior temporal lobe, and lateral occipital cortex.15
MRI data were acquired on a Siemens Biograph mMR or Trio 3T scanner. T1-weighted images were acquired with a magnetization-prepared rapid acquisition gradient echo sequence acquired in the sagittal orientation with a repetition time of 2,300 milliseconds, an echo time of 2.95 milliseconds, a flip angle of 9°, 176 slices, an in-plane resolution of 240 × 256, and a slice thickness of 1.2 mm. Images underwent volumetric segmentation with FreeSurfer 5.3 (freesurfer.net) to identify regions of interest for further analysis. Hippocampal volumes were adjusted for head size with a regression approach16 and summed across hemispheres.
Data availability
All data reported in this manuscript are available to qualified parties from the corresponding author on request.
Statistical analysis
Given the relatively recent implementation of tau PET imaging, the majority of cognitive assessments occurred before tau PET acquisition. Thus, we chose to temporally align individuals on the basis of the date of tau PET scan and used the closest amyloid PET scan and structural MRI to retrospectively assess change in cognition during the years before the tau PET scan. Time intervals between all modalities of imaging assessments were quite small (≈1.5 months on average, table 1). Retrospective longitudinal analyses were conducted with linear mixed-effects models using the lme4 package in R17 with degrees of freedom calculated with the Satterthwaite approximation. All models included the following terms: fixed effects of age at baseline, CDR status at baseline, sex, and years of education and the years before tau scan as a time-dependent term. Additional models added standardized amyloid PET SUVR, standardized tau PET SUVR, and standardized hippocampal volume, as well as their interactions with time, to assess whether different biomarkers were associated with differential cognitive trajectories. All models also included a random intercept term across patients and a random slope for time. It is important to note that because we are modeling cognitive change, all effects discussed below (with the exception of the demographic variables) involve an interaction with time.
Our analysis proceeded in several steps. First, retrospective longitudinal analyses of cognition were conducted with each biomarker in isolation to ensure that our sample was behaving in a manner consistent with prior reports (i.e., demonstrated predicted biomarker and cognition relationships). Second, in separate models, we tested the 2-way interactions between each pair of biomarkers (e.g., amyloid PET by tau PET, amyloid PET by hippocampal volume, tau PET by hippocampal volume) in influencing decline. In the third step, we entered the 3 two-way interactions between time and each of the biomarkers (e.g., amyloid by time, tau by time, and neurodegeneration by time) into a single analysis to examine the unique variance in cognitive change that is accounted for by each. In a final model, we allowed for a 3-way interaction among all 3 biomarkers with time (i.e., the amyloid by tau by neurodegeneration by time interaction) to test for incremental influences of accumulating AD pathology on cognitive change.
Results
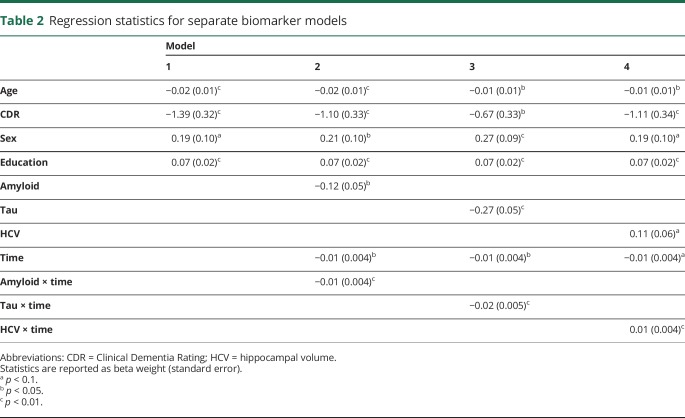
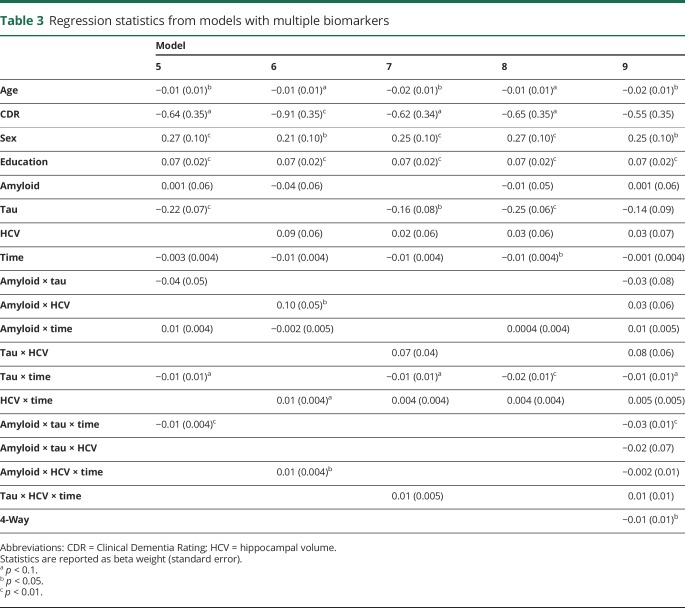
Demographic characteristics of the sample at the time of the tau PET scan are presented in table 1. One hundred fifty-two mostly cognitively normal (89% CDR score 0, Mini-Mental State Examination score 29.16 ± 1.35) participants were followed up for an average of 5.78 ± 3.57 annual assessments. The 3 neuroimaging biomarkers were moderately correlated (amyloid-tau r = 0.52, amyloid–hippocampal volume r = −0.33, tau–hippocampal volume r = −0.45, all p < 0.001). Model results from the individual biomarker models are summarized in table 2. Age (β = −0.019, p = 0.003), CDR score (β = −1.390, p < 0.001), and education (β = 0.072, p < 0.001) were related to prior change on the global cognitive composite, but sex was not (β = 0.194, p = 0.052). When modeled individually with terms for CDR score, age, sex, and years of education in the model, amyloid PET (model 2) was related to cognitive change (β = −0.010, p = 0.010), as was tau PET (model 3, β = −0.024, p < 0.001) and neurodegeneration (model 4, β = 0.012, p = 0.006). Models that included multiple biomarkers are summarized in table 3. As shown, amyloid PET and tau PET strongly interacted to influence retrospective change (model 5, β = −0.013, p = 0.003). Fitted values from this model are depicted in figure 1. Similarly, amyloid PET interacted with hippocampal volume, although the effect was not as strong (model 6, β = 0.008, p = 0.03). Tau PET and hippocampal volume did not interact to influence decline (model 7, β = 0.006, p = 0.199).
Table 2.
Regression statistics for separate biomarker models
Table 3.
Regression statistics from models with multiple biomarkers
Figure 1. Longitudinal relationship between tau PET and cognitive decline as a function of amyloid PET status using an SUVR threshold of 1.2215.
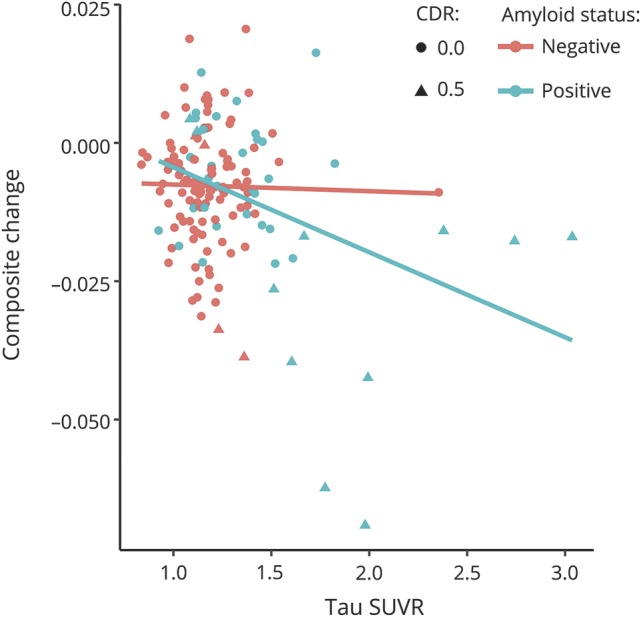
15Amyloid negative: Clinical Dementia Rating (CDR) score of 0 (n = 106) and 0.5 (n = 5); and amyloid positive: CDR score of 0 (n = 30) and 0.5 (n = 11). SUVR = standardized uptake value ratio.
When all biomarkers were analyzed in a combined model, only tau PET was associated with cognitive change (model 8, β = −0.022, p < 0.001) such that global cognition declined by 0.022 SD faster per year for each 1-SD increase in tau PET. Amyloid PET and hippocampal volume were not related to cognitive change (β = 0.00, p = 0.928; β = 0.004, p = 0.337, respectively). Finally, to examine the interactive influence of all 3 biomarkers, we conducted a final model (model 9) allowing for a 3-way interaction (amyloid by tau by hippocampal volume). There was a significant, albeit small, 3-way interaction among the biomarkers (β = −0.012, p = 0.033) in explaining cognitive decline. As shown by the fitted values from this final model in figure 2, this interaction indicates that participants with abnormal levels on all 3 biomarkers show accelerated rates of cognitive decline relative to individuals with abnormalities in 1 or 2 types of pathology.
Figure 2. Longitudinal relationship among tau PET, amyloid PET, and hippocampal volume in predicting cognitive decline.
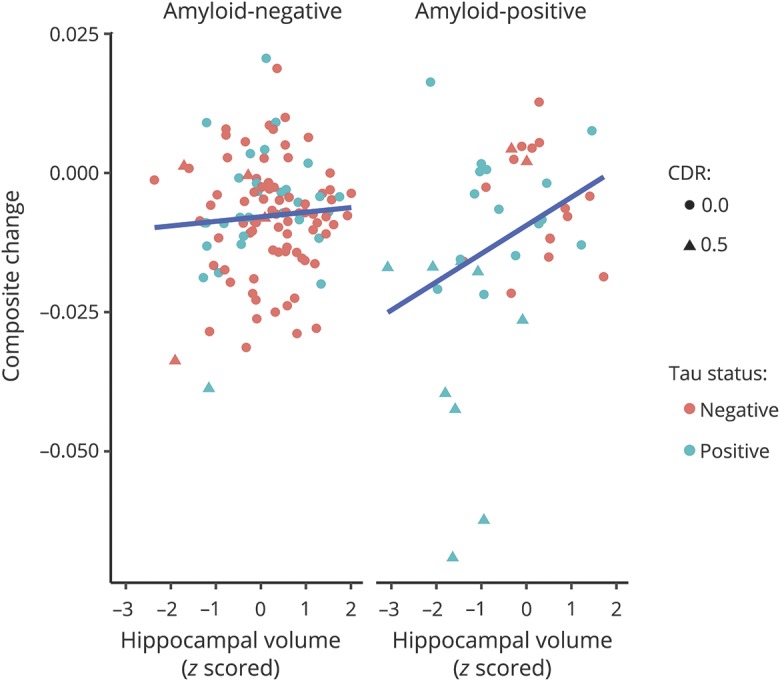
Standardized uptake value ratios were set at 1.22 for amyloid PET and 1.25 for tau PET.15 Tau negative, amyloid negative: Clinical Dementia Rating (CDR) score of 0 (n = 77) and 0.5 (n = 4); tau negative, amyloid positive: CDR score of 0 (n = 15) and 0.5 (n = 2); tau positive, amyloid negative: CDR score of 0 (n = 29) and 0.5 (n = 1); and tau positive, amyloid positive: CDR score of 0 (n = 15) and 0.5 (n = 9).
Cognitive domain subanalyses
We conducted follow-up analyses of each individual cognitive test to evaluate whether the relationship of the biomarkers to cognition varied across domains. Given that only tau PET was associated with performance on the cognitive composite when the biomarkers were modeled jointly, we report only the effects of tau PET by time after controlling for both the amyloid-by-time and hippocampal volume–by–time interactions. This analysis revealed some domain specificity in the relationship with tau PET. Specifically, tau PET was associated with the largest changes on Free and Cued Selective Reminding Test (β = −0.050, p < 0.0001) total free recall and Trail Making B (β = 0.051, p < 0.001), but there was no effect for either Trail Making A (β = 0.003, p = 0.747) or Animal Naming (β = −0.010, p = 0.442).
Discussion
The results of this study revealed that when used individually as a continuous marker of pathology, tau PET, amyloid PET, and hippocampal volume were each associated with retrospective cognitive change in preclinical and very early symptomatic AD. This finding supports our first hypothesis that each neuroimaging biomarker can serve as a robust indicator of AD pathology that correlates with cognitive change.
Our second hypothesis that tauopathy would be the primary determinant of cognitive decline was also supported. Specifically, when all neuroimaging biomarkers were modeled together, only tau PET accounted for significant unique variance in retrospective longitudinal performance on a composite cognitive measure reflecting episodic memory, semantic memory retrieval, processing speed, and executive function. Neither amyloid PET nor hippocampal volume accounted for significant variance in cognition once tau PET was included in the statistical model. These results are consistent with results from neuropathologic studies of AD4 and studies using tau PET and cross-sectional measures of cognition5 that found that markers of tau pathology were better predictors of cognition than markers of amyloid. Together, these results suggest that amyloidosis alone or reduced hippocampal volume alone may not be sufficient to cause observable cognitive declines. The lack of an association between cognitive decline and hippocampal volume in the combined model was unexpected; however, there are limits to the utility of using hippocampal volume as a cross-sectional marker of neurodegeneration. For example, it is possible that some individuals have other comorbid pathologies leading to smaller hippocampal volumes that are not necessarily indicative of brain atrophy due to progressive neurodegenerative diseases like AD. Future work should examine longitudinal changes in hippocampal volume and additional markers of neurodegeneration such as fluorodeoxyglucose-PET hypometabolism or CSF total tau, as recently suggested.3
Our third hypothesis that tau PET would be more strongly associated with cognition in the presence of elevated amyloid was supported. There was a strong interaction between tau PET and amyloid PET in relating to cognition, indicating that declines in cognition are accelerated when both tau and amyloid are elevated. Similarly, an interaction emerged when amyloid and neurodegeneration were examined. However, no interaction was observed between tau PET and hippocampal volume. These results support the proposed ordering of amyloid-driven biomarker accumulation in preclinical AD and the transition to symptomatic AD.1,7 However, given that amyloid interacted with both tau and hippocampal volume and given the correlation between tau and hippocampal volume, the question remains as to which biomarker is driving the interaction with amyloid. Our final analysis attempted to address this issue by constructing a model that included all 2-way interactions and allowed all 3 neuroimaging biomarkers to interact. In the 2-way interactions, only the tau PET–by–amyloid PET interaction was significantly associated with cognition, suggesting that increased levels of tau in the presence of increased levels of amyloid are the primary determinants of cognitive decline. There was a significant interaction among all 3 biomarkers such that individuals who are abnormal on all 3 markers exhibited the greatest rates of cognitive decline. The significance of this interaction was relatively limited, but it is consistent with the recent amyloid (A), tau (T), and neurodegeneration (N) classification system in which individuals are rated as normal or abnormal on each category of biomarker.3 The A/T/N classification system posits that individuals with abnormalities on all 3 biomarkers are at the greatest risk of developing AD and hence should exhibit the greatest magnitude of cognitive decline, which is precisely the pattern observed in the current data. Thus, our results provide initial validation of this system by showing incremental changes in cognitive decline as a function of increasing levels of AD pathology.
The present study extends prior findings in several important ways. First, there are few reports of tau PET imaging and longitudinal cognitive change,18 and here we demonstrate that tau PET correlates with a number of tests that represent major cognitive domains. Second, we simultaneously evaluated 3 major neuroimaging biomarkers in a single statistical model, allowing the quantification of the unique variance explained by each marker and providing critical insight into the pathologic mechanisms that drive cognitive change. Third, we examined interactions among the various biomarkers in a statistically rigorous manner. Finally, we analyzed the influence of tau PET across distinct cognitive domains in addition to a global cognitive composite. These findings indicate that tau PET is associated with change primarily in domains of episodic memory and executive functioning.
There are some limitations to this study. This was a retrospective analysis of cognitive functioning, which was due primarily to the relatively recent large-scale implementation of tau PET imaging in the Knight ADRC cohort. Until the rates of change in tau PET have been established, it is unclear whether current tau PET levels will predict future cognitive decline (as opposed to accounting for variance in decline that has already occurred). To examine the transition period from cognitive normality to very mild impairment, our sample included a small percentage of individuals with very mild dementia and consequently high levels of tau. Not surprisingly, symptomatic participants also showed the largest rates of decline. Indeed, the relationship between cognition and tau in cognitively normal participants was much reduced. However, statistical inferences are limited by small sample sizes. Future work with larger samples should examine similar relationships in a purely preclinical sample. In addition, we modeled all biomarkers using a linear relationship to cognitive decline. It is possible, indeed likely, that the relationship is curvilinear or stepwise. Specifically, rates of decline were relatively modest below a tau PET SUVR of ≈1.5, even in participants with a CDR score 0.5. It is possible that cognitive decline accelerates once tau PET reaches a threshold level. Similar to other ADRCs, our sample is highly educated (mean years of education 16.1 years), and participants with higher levels of education may be more resilient to the effects of neurodegeneration.19 Finally, our subanalysis of cognitive domains consisted of only a single test for each facet of cognition, which should be replicated with a more comprehensive cognitive battery.
In our sample of participants ranging from cognitively normal to very mild symptomatic AD, we found that each neuroimaging biomarker was related to cognitive decline when considered in isolation, but when modeled together, tau PET was the most consistent and significant predictor of cognitive decline. This effect held even after controlling for other neuroimaging biomarkers, CDR status, age, sex, and education. Tau-related cognitive decline was clearly accelerated when amyloid levels were also high. These findings are consistent with the notion that tau accumulation is a primary determinant of cognitive decline and support the utility of tau PET imaging in assessing AD-related cognitive change.
Glossary
- ACS
Adult Children Study
- AD
Alzheimer disease
- ADRC
Alzheimer Disease Research Center
- A/T/N
amyloid/tau/neurodegeneration
- CDR
Clinical Dementia Rating
- HASD
Healthy Aging and Senile Dementia
- SUVR
standardized uptake value ratio
Author contributions
Andrew Aschenbrenner: study concept and design, analysis and interpretation of data, drafting of the manuscript, critical revision for intellectual content, statistical analysis. Brian Gordon: study concept and design, critical revision for intellectual content. Tammie Benzinger and John C. Morris: acquisition of data, critical revision for intellectual content, obtained funding. Jason Hassenstab: study concept and design, acquisition of data, analysis and interpretation of data, drafting of the manuscript, critical revision for intellectual content, obtained funding.
Study funding
This study was supported by grants P50-AG05681, P01-AG03991, and P01-AG26276 awarded to Dr. Morris.
Disclosure
A. Aschenbrenner is a paid consultant for Lundbeck. B. Gordon reports no disclosures relevant to the manuscript. T. Benzinger reports receiving grants and other support from Avid Radiopharmaceuticals, Eli Lily, and Hoffman La Roche. J. Morris receives research support from Eli Lilly/Avid Radiopharmaceuticals and is funded by NIH grants P50AG005681; P01AG003991; P01AG026276, and UF01AG032438. J. Hassenstab is a paid consultant for Biogen, Lundbeck, and Pfizer. Go to Neurology.org/N for full disclosures.
References
- 1.Bateman RJ, Xiong C, Benzinger TLS, et al. Clinical and biomarker changes in dominantly inherited Alzheimer's disease. N Engl J Med 2012;367:795–804. [DOI] [PMC free article] [PubMed] [Google Scholar]
- 2.Price JL, McKeel DW, Buckles VD, et al. Neuropathology of nondemented aging: presumptive evidence for preclinical Alzheimer disease. Neurobiol Aging 2009;30:1026–1036. [DOI] [PMC free article] [PubMed] [Google Scholar]
- 3.Jack CR, Bennett DA, Blennow K, et al. A/T/N: an unbiased descriptive classification scheme for Alzheimer disease biomarkers. Neurology 2016;87:539–547. [DOI] [PMC free article] [PubMed] [Google Scholar]
- 4.Bennett DA, Schneider JA, Wilson RS, Bienias JL, Arnold SE. Neurofibrillary tangles mediate the association of amyloid load with clinical Alzheimer disease and level of cognitive function. Arch Neurol 2004;61:378. [DOI] [PubMed] [Google Scholar]
- 5.Brier MR, Gordon B, Friedrichsen K, et al. Tau and Aβ imaging, CSF measures, and cognition in Alzheimer's disease. Sci Transl Med 2016;8:338ra66. [DOI] [PMC free article] [PubMed] [Google Scholar]
- 6.Wang L, Benzinger TL, Hassenstab J, et al. Spatially distinct atrophy is linked to β-amyloid and tau in preclinical Alzheimer disease. Neurology 2015;84:1254–1260. [DOI] [PMC free article] [PubMed] [Google Scholar]
- 7.Jack CR, Knopman DS, Jagust WJ, et al. Tracking pathophysiological processes in Alzheimer's disease: an updated hypothetical model of dynamic biomarkers. Lancet Neurol 2013;12:207–216. [DOI] [PMC free article] [PubMed] [Google Scholar]
- 8.Morris JC. The Clinical Dementia Rating (CDR): current version and scoring rules. Neurology 1993;43:2412–2414. [DOI] [PubMed] [Google Scholar]
- 9.Grober E, Buschke H, Crystal H, Bang S, Dresner R. Screening for dementia by memory testing. Neurology 1988;38:900–903. [DOI] [PubMed] [Google Scholar]
- 10.Goodglass H, Kaplan E. Boston Diagnostic Aphasia Examination Booklet, III: Oral Expression: Animal Naming (Fluency in Controlled Association). Philadelphia: Lea & Febiger; 1983. [Google Scholar]
- 11.Armitage SG. An analysis of certain psychological tests used for the evaluation of brain injury. Psychol Monogr 1946;60:1–48. [Google Scholar]
- 12.Su Y, Blazey TM, Snyder AZ, et al. Partial volume correction in quantitative amyloid imaging. Neuroimage 2015;107:55–64. [DOI] [PMC free article] [PubMed] [Google Scholar]
- 13.Rousset OG, Ma Y, Evans AC. Correction for partial volume effects in PET: principle and validation. J Nucl Med 1998;39:904. [PubMed] [Google Scholar]
- 14.Su Y, D'Angelo GM, Vlassenko AG, et al. Quantitative analysis of PiB-PET with FreeSurfer ROIs. PLoS One 2013;8:e73377. [DOI] [PMC free article] [PubMed] [Google Scholar]
- 15.Mishra S, Gordon BA, Su Y, et al. AV-1451 PET imaging of tau pathology in preclinical Alzheimer disease: defining a summary measure. Neuroimage 2017;161:171–178. [DOI] [PMC free article] [PubMed] [Google Scholar]
- 16.Buckner RL, Head D, Parker J, et al. A unified approach for morphometric and functional data analysis in young, old, and demented adults using automated atlas-based head size normalization: reliability and validation against manual measurement of total intracranial volume. Neuroimage 2004;23:724–738. [DOI] [PubMed] [Google Scholar]
- 17.Bates DM, Maechler M, Bolker B, Walker S. Fitting linear mixed-effects models using lme4. J Stat Softw 2015;67:1–48. [Google Scholar]
- 18.Schöll M, Lockhart SN, Schonhaut DR, et al. PET imaging of tau deposition in the aging human brain. Neuron 2016;89:971–982. [DOI] [PMC free article] [PubMed] [Google Scholar]
- 19.Liu Y, Julkunen V, Paajanen T, et al. Education increases reserve against Alzheimer's disease: evidence from structural MRI analysis. Neuroradiology 2012;54:929–938. [DOI] [PMC free article] [PubMed] [Google Scholar]
Associated Data
This section collects any data citations, data availability statements, or supplementary materials included in this article.
Data Availability Statement
All data reported in this manuscript are available to qualified parties from the corresponding author on request.


