

Supplemental Digital Content is available in the text
Keywords: C difficile, hospital costs, mortality, outcomes, rehospitalization
Abstract
Recurrent Clostridium difficile infection (rCDI) requiring rehospitalization contributes to poor outcomes, which may differ between patients hospitalized with versus for it.
We performed a multicenter retrospective cohort study of rehospitalized adults surviving initial CDI hospitalization. Hospital mortality, length of stay (LOS), 30-day readmission, and mean gap between hospital costs and Diagnosis Related Group (DRG) reimbursement served as outcomes.
Among the 25.7% (n = 99,175) survivors requiring rehospitalization, 36,504 (36.8%) had rCDI (14,005 [38.4%] principal diagnosis rCDI [PrCDI]). Compared with non-CDI, PrCDI, and secondary diagnosis rCDI [SrCDI] carried lower risk of death (PrCDI odds ratio [OR] 0.52; 95% confidence interval [CI] 0.46, 0.58; SrCDI OR 0.80; 95% CI 0.75, 0.85) and 30-day readmission (PrCDI OR 0.84; 95% CI 0.80, 0.88; SrCDI OR 0.97; 95% CI 0.94, 1.01), and excess LOS (PrCDI 1.8 days; 95% CI 1.7, 2.0; SrCDI 1.4 days; 95% CI 1.3, 1.5), and costs (PrCDI $1399; 95% CI $858, $1939; SrCDI $2809; 95% CI $2307, $3311). Mean gap between hospital costs and DRG reimbursements was highest in SrCDI ($13,803).
A rehospitalization within 60-days of an initial CDI hospitalization occurs in approximately 25% of all survivors, 1/3 with rCDI. SrCDI carries worse outcomes than PrCDI. The potential loss of revenue incurred by the hospital is nearly 3-fold higher for SrCDI than PrCDI.
1. Introduction
Although clinical trials suggest that certain therapies can reduce recurrent Clostridium difficile infection (rCDI) rates by ≥50%, the condition remains both prevalent and burdensome.[1–4] Reasons include the increasing complexity of patients potentially at risk for rCDI, the suboptimal use of the newer therapies, and the general differences between the quasi-artificial construct of clinical trials and real-world clinical practice.[5–7] Regardless of the underlying reasons, rCDI continues to vex clinicians, torment patients, and affect hospitals.
Patients who have survived an initial hospitalization with CDI and then require a rehospitalization with a recurrence consume a disproportionate share of healthcare resources. In a cohort of such Medicare patients, we noted a recurrence rate of 33%, of whom 2/3 required a readmission to the hospital within a short interval.[4] Although rCDI did not raise the risk of death in these subjects, the associated excess hospital days and costs were considerable.
While studies conflict as to whether rCDI increases mortality, its economic burden is not in question. What is less certain is what drives this burden.[4,8–11] For example, there may be differences between patients who are admitted explicitly for the treatment of their rCDI and those who are admitted with another condition, where rCDI is a concurrent but not primary affliction. It is likely that those hospitalized for rCDI differ in important and potentially actionable ways from those hospitalized with rCDI. It is also unclear how much reimbursements for rCDI hospitalizations compare with the actual costs hospitals incur caring for these patients, as it is possible that the lengths of stay for patients with rCDI readmission exceed standard payments for these admissions. Finally, as the US healthcare system moves to a “value based” purchasing approach with a diminished willingness of payors to cover costs associated with readmissions, it is important to understand the current rates of 30-day readmissions among patients with a rCDI.[12]
2. Methods
2.1. Study design
We performed a retrospective cohort study to explore the epidemiology and outcomes of adult (age ≥18 years) rehospitalizations with rCDI in the United States. Outcomes of interest were hospital mortality, length of stay (LOS), hospital costs, 30-day readmission rates, and the reimbursements gap (defined below).
2.2. Data sources
We analyzed the State Inpatient Databases (SID), a part of the Health Care Utilization Project (HCUP) administered by the Agency for Healthcare Research and Quality (AHRQ), from 4 geographically diverse US states (California [only available for years 2009–2011], Florida, Iowa, and New York) for years 2009 to 2013.[13] For further details on SID, please, view Supplemental material.
The 4 states representing each of the 4 Census Bureau regions of the United States were chosen because their geographic diversity increases the generalizability of our findings.[14]
2.3. Case identification
An initial CDI hospitalization episode was defined as a discharge with a CDI International Classification of Diseases, Ninth Revision, Clinical Modification (ICD-9-CM) code (008.45) between March 1 and October 31 of any year and no CDI codes during any hospitalization within prior 60 days. All rehospitalizations within 60 days following initial CDI discharge were included in the cohort. Those whose rehospitalizations included a CDI code were assigned to the rCDI group.[4] Admissions with rCDI were subdivided into those whose rCDI was listed as the principal diagnosis (PrCDI), connoting the primary reason for admission, and those with rCDI as a secondary diagnosis (SrCDI), where rCDI was incidental to the hospitalization. For further definitions of rCDI categories (Community-onset healthcare facility associated [CO-HCFA], hospital-onset healthcare facility associated [HO-HCFA], and community-acquired [CA]), please, see Supplemental material.[15]
2.4. Follow-up
The groups were followed until in-hospital death or discharge from the hospital. For the 30-day readmission outcome, the survivors of the index rCDI hospitalization were followed for an additional 30 days with the sole purpose of quantifying this outcome.
2.5. Outcome variables
We examined mortality, hospital LOS in days, hospital costs in $US, as well as 30-day readmission rates among survivors of the readmission. HCUP collects hospital charges and provides Center for Medicare and Medicaid Services-defined individual hospital cost-to-charge conversion ratios as a part of the National Inpatient Database. Comparator groups were those readmitted with no evidence of rCDI (non-rCDI), those with PrCDI, and SrCDI. In addition, we explored the mean reimbursement gap between the top 5 Medicare Severity Diagnosis Related Groups (MS-DRG) within each comparator group (see below).[16] While hospital costs represent a fixed fraction of that which is billed by the hospital for a service (charge), a DRG reflects the actual amount reimbursed to the hospital by the payor. The gap between costs and reimbursements may also be related to further negotiated discounting or penalties and rewards based on value delivered.
2.6. Statistical analyses
We compared demographic, clinical, hospital, and discharge characteristics among the 3 groups, as well as their outcomes—mortality, LOS, costs, and 30-day readmission rates. Differences between mean MS-DRG reimbursements and mean costs for the top 5 MS-DRGs in each of the comparator groups were examined as a measure of the gap between costs and reimbursements.[16]
Mean (standard deviation, SD), and median (interquartile range, 25%–75% [IQR]) were calculated for continuous variables, and counts and proportions for categorical variables. One-way ANOVA, Student t test or the Wilcoxon rank-sum test were used to examine the differences in continuous variables as appropriate, while the chi-square test was used for categorical variables comparisons.
To adjust for confounding, we developed generalized linear models (GLM) to compare the differences in the continuous outcomes of interest (LOS and costs) between groups. Since the continuous outcomes were positive and non-normal (skewed), we ran the GLMs with a logarithmic link and used a Gamma family distribution. Robust standard errors were derived based on the hospital of the patient encounter.[17] For binary outcome models (mortality, 30-day readmission), a multilevel mixed-effects logistic regression model structure was used with hospitals of the patient encounters treated as random effects.
All inferences were two-tailed. Statistical significance was defined to be present at α = 0.05. Unless otherwise stated, the P-values are reported for comparisons between all 3 groups. Statistical analyses were performed using Stata/MP 15.1 for Windows for Windows (StataCorp, College Station, TX).
2.7. Ethics statement
Because this study used already existing publicly available fully de-identified retrospective data, it was exempt from ethics review.
3. Results
Among 385,682 initial CDI hospitalizations identified between years 2009 and 2013 in the 4 states examined, 99,175 (25.7%) required a rehospitalization (Fig. 1). Of them, 36,504 (36.8%) had a rCDI (14,005 [14.1%] as PrCDI), while the majority, 62,671 (63.2%), had no code for CDI. In each group, Florida contributed the plurality of admissions, followed by New York, California, and Iowa (Table 1 ). Nearly all rCDI were present on admission (POA) (99.7% PrCDI, 88.4% SrCDI) (Table 1 ), and nearly all were CO-HCFA (33,838, 92.7%) (Fig. 1).
Figure 1.
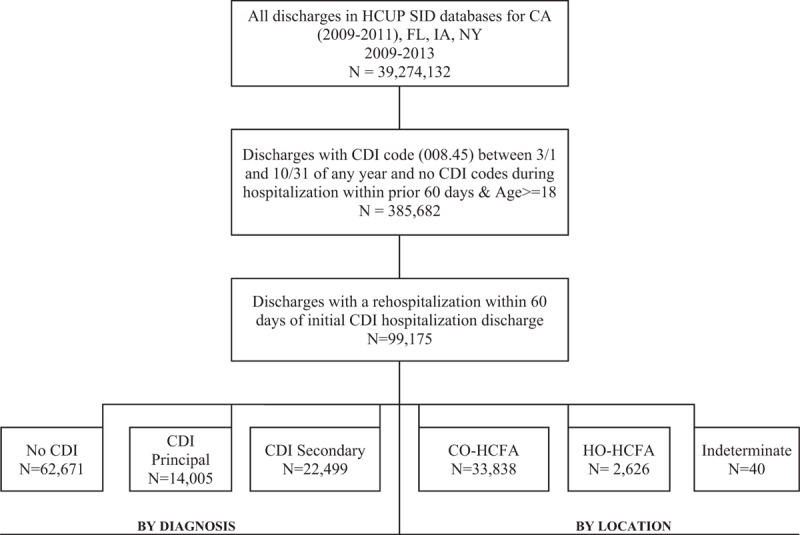
Enrollment chart. CDI = C difficile infection, CO = community-onset, HCFA = healthcare facility associated, HCUP = Health Care Utilization Project, HO = hospital-onset, SID = State Inpatient Database.
Table 1.
Baseline characteristics, admission, sources, and hospital events.
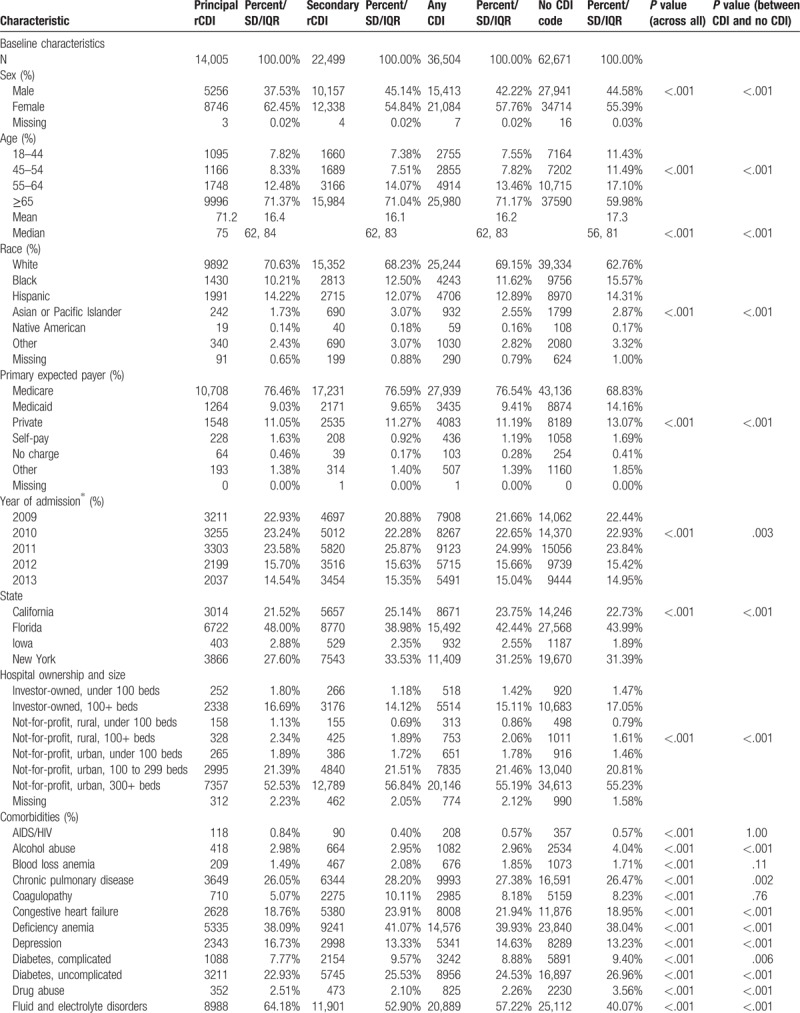
While patients with PrCDI and SrCDI were older than the non-CDI subjects, SrCDI and non-CDI groups had fewer females than PrCDI group (Table 1 ). PrCDI group had the lowest and SrCDI's the highest comorbidity burden, with non-CDI falling in-between (Table 1 ). Sepsis prevalence was nearly 8 times higher in SrCDI (39.2%) than in PrCDI (5.2%), and twice that in non-CDI (19.3%, P < .001). The prevalence of severe sepsis and septic shock followed a similar pattern (Table 1 ).
Both unadjusted hospital mortality and costs were highest in the SrCDI group and lowest in PrCDI (Supplement Table 1). LOS, on the other hand, was similar in PrCDI and non-CDI groups and both were lower than in SrCDI (Supplement Table 1). Interestingly, 30-day readmissions were highest among non-CDI and lowest in PrCDI, though in all groups the rate was over 30% (Supplement Table 1).
In the adjusted analyses, comparing PrCDI and SrCDI outcomes to the reference group of non-CDI, PrCDI (odds ratio [OR] 0.52; 95% confidence interval [CI] 0.46, 0.58) and SrCDI (0.80; 95%CI 0.75, 0.85) were associated with a lower risk of death than non-CDI (Table 2). However, among both groups of rCDI patients we noted excess LOS (PrCDI 1.8 days; 95% CI 1.7, 2.0 and SrCDI 1.4 days; 95% CI 1.3, 1.5) and costs (PrCDI $1399; 95% CI $858, $1939 and SrCDI $2809; 95% CI $2307, $3311) relative to the non-CDI group (Table 2). Similar to mortality, however, adjusted 30-day readmission risk was lower in PrCDI (OR = 0.84; 95% CI 0.80, 0.88) and SrCDI (OR = 0.97; 95% CI 0.94, 1.01) than non-CDI (Table 2).
Table 1 (Continued).
Baseline characteristics, admission, sources, and hospital events.
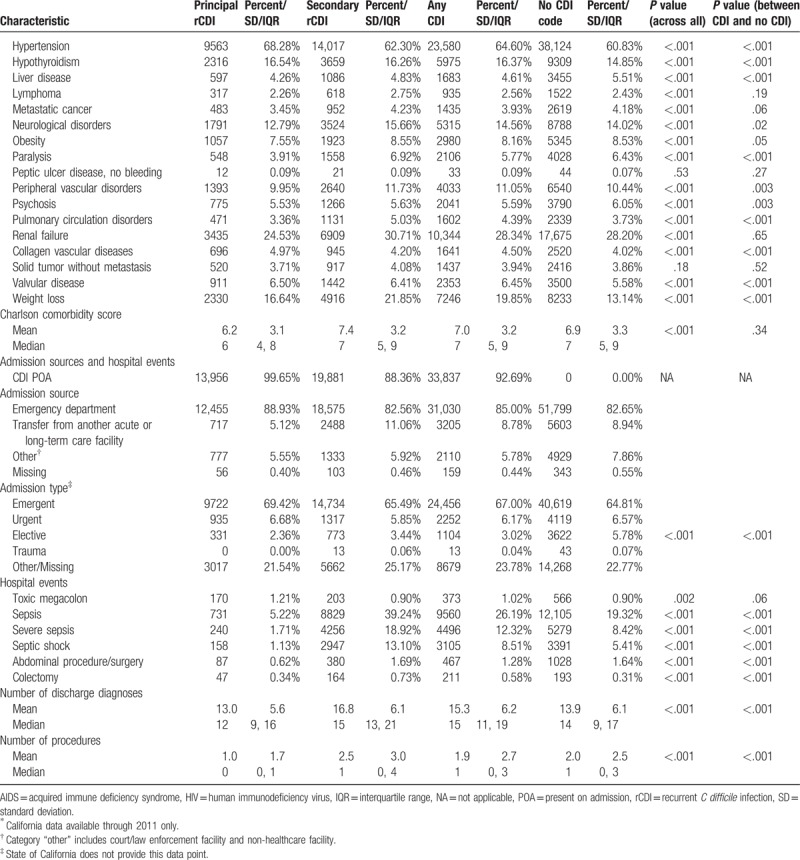
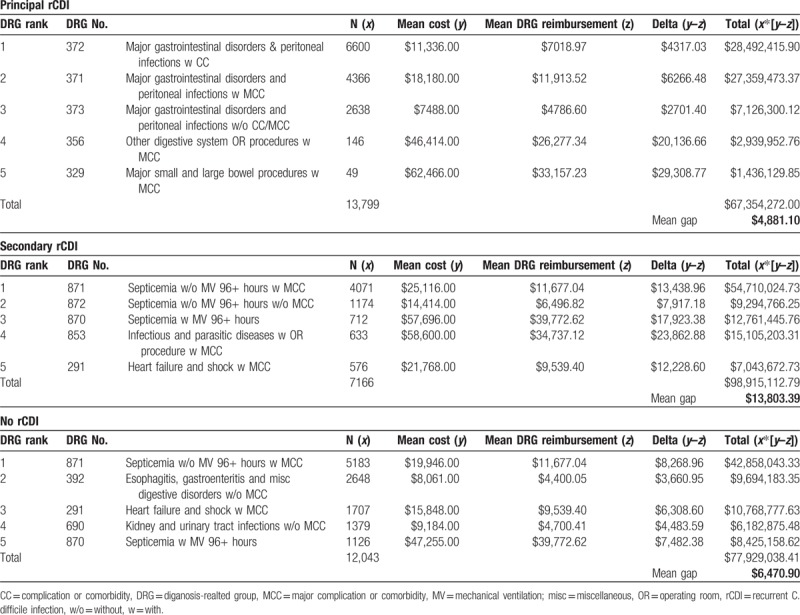
Among the top 5 DRGs, gastrointestinal disorders predominated in PrCDI, and sepsis did in SrCDI and non-CDI (Table 3). The mean gap between hospital costs and DRG-reimbursements was highest in SrCDI ($13,803) and lowest in PrCDI ($4881) (Table 3).
Table 2.
Adjusted outcomes for principal and secondary rCDI relative to no rCDI∗.
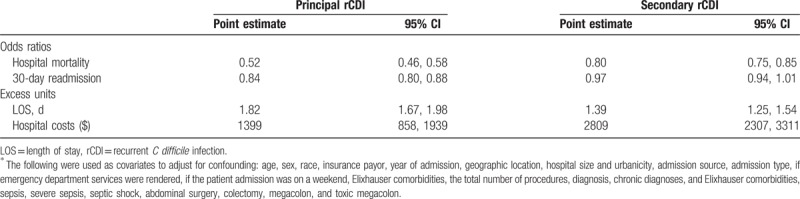
Table 3.
Reimbursement gap.
4. Discussion
We have demonstrated that in a cohort of patients who have survived an initial hospitalization with a CDI, a full one-quarter gets readmitted within 60 days, of whom over 1/3 has a diagnosis of rCDI during that readmission. While only approximately one-third of all rCDI is PrCDI, nearly all are considered to be POA. We further found that those patients who are readmitted with PrCDI are different demographically and clinically from those with SrCDI and those without CDI. Indeed, among those 3 groups, patients who are rehospitalized with rCDI as a secondary diagnosis tend to exhibit the highest severity of illness. Nevertheless, both SrCDI and PrCDI patients have a lower adjusted odds of hospital death and 30-day readmission than non-rCDI patients. However, even after adjustment, both PrCDI and SrCDI are associated with increased hospital LOS and costs relative to non-rCDI hospitalizations. Notably, SrCDI carries the highest mean reimbursement gap among the 3 groups examined; nearly $14,000 per hospitalization.
The difference in hospital mortality between those with SrCDI (11.5%) and PrCDI (2.9%) implies that, even in the setting of rCDI, some other factors are likely driving outcomes. For example, sepsis, present in 18.9% of SrCDI as compared with 1.7% of PrCDI, could explain much of the difference. Alternatively, it is possible that this reflects the limited space for billing codes in the HCUP databases. Hence there may be a coding bias wherein those patients with greater disease burden may be less likely to have a CDI code noted if the coder deems it to be less severe and hence less important than other conditions. This observation may further explain why our findings differ from those of others.[8]
At the same time, we observed a similar relationship between rCDI and death in a cohort of Medicare recipients whose initial CDI hospitalization required discharge to a chronic care facility.[4] In that study, approximately 25% of patients with and without rCDI died within 60 days of rCDI onset. The lower overall rates of death in the current analysis likely reflect a younger population than in other studies, coupled with a shorter observation period limited to the acute hospitalization. In contrast, Olsen et al[8] reported a 33% rise in the adjusted relative risk of death within 180 days in association with rCDI.
One novel aspect of our study is its exploration into the potential differences in outcomes between patients admitted to the hospital specifically to treat the recurrence itself (PrCDI), as opposed to where rCDI is a secondary reason for admission (SrCDI). This distinction appears important, as the outcomes diverge substantially. Therefore, different therapeutic strategies may be necessary in the 2 groups to optimize those outcomes. It is not surprising, for example, that mortality among PrCDI patients is substantially lower than SrCDI, since SrCDI patients were far more likely to be admitted with such high-risk conditions as sepsis.
Ours is not the first study to demonstrate the excess costs and LOS in association with rCDI. Over a 180-day period following index CDI, Olsen et al[9] found an excess of 11 hospital days among those with rCDI over those without, and the number of readmissions per patient was 1.72 versus 0.81 for the groups, respectively. In a Medicare cohort of older subjects, rCDI resulted in an excess of 20 days of acute hospitalization.[4] Although the number of excess days in the hospital is lower in the current study than in each of the prior 2, this again is likely due to the shorter observation period and a younger population we studied. Nevertheless, despite having no impact on in-hospital mortality, both PrCDI and SrCDI contributed substantially to an increase in the LOS. More importantly, this excess LOS translated into significant excess costs, consistent with prior reports.[4,11]
To the best of our knowledge, ours is the first study to examine 2 additional outcomes in the setting of rCDI hospitalization, namely, 30-day readmission rates and the reimbursement gap. These outcomes carry a particular importance to hospitals whose finances are already strained. It should be reassuring to both patients and institutions that the 30-day readmission rates do not appear to be higher with than without rCDI. However, rCDI admissions pose a major financial challenge since in both cases, patients hospitalized either with or for rCDI consume resources well beyond amounts covered by third party payors. This is particularly true in the instance of SrCDI, where we estimate each hospitalization nets the institution a $14,000 loss per admission. While the SrCDI-associated reimbursement gap is the largest, the other 2 groups’ reimbursement shortfalls are also substantial. Even when comparing similar DRG categories, such as 870 and 871 (sepsis) between SrCDI and no rCDI, there is almost twice the magnitude of this gap, defining these values may help hospitals shed a quantitative light on discrepancies they may encounter.
Our study has a number of limitations. As a retrospective study it is subject to a number of biases, most notably selection bias. To mitigate this we developed a priori inclusion criteria. Because we used administrative coding to identify rCDI, there is a possibility for misclassification. However, using ICD-9-CM codes to identify incident CDI is well validated in the hospitalized population.[18] Still, while this method of defining rCDI in the hospital has been used previously, it has not been widely validated.[4] In fact, the presence of this code may or may not signify the actual presence of active CDI. Wen et al[19] found a relatively low specificity of a combination of ICD-9 codes, stool testing procedure codes, and CDI treatment codes for recurrent CDI. This raises the possibility that at least in a proportion of those identified, rCDI reflects the patient having a documented history of CDI, rather than an active episode. However, this type of misclassification is likely to drive our effect estimates closer to the null and thus mute any differences that exist between comparator groups. This may in part account for our inability to find an association between rCDI and either mortality or readmission rates.
Confounding is an issue in observational studies. Although we dealt with the possibility of confounding by deriving regression models to estimate the effect of rCDI on the outcomes of interest using a large number of additional covariates, the possibility of residual confounding remains. At the same time, our analysis may also suffer from overadjustment.[20] In particular, it is possible that sepsis, for example, at least in some cases, was an intermediary between rCDI and hospital outcomes. In such a case examining it as a confounder may have shifted our effect estimates toward the null, implying that the actual impact of rCDI on the outcomes is likely to be greater than what we found. The risk of this is highest in the SrCDI group, where the prevalence of sepsis was far greater than in PrCDI.
These limitations notwithstanding, our study has a number of strengths that lend credibility to our results. Since we relied on a large geographically representative sample of rCDI discharges, our results are broadly generalizable to US hospitals. We applied rigorous statistical methodologies to derive attributable outcomes. The novel aspects of our study—examining PrCDI and SrCDI separately, computing rCDI's impact on 30-day readmission rates, and the calculation of the reimbursement gap—augment the usefulness and relevance of our data in underscoring the financial pressures that should drive institutions to target intensive preventive efforts.
In summary, a rehospitalization following an index CDI admission is a common occurrence, and a substantial proportion of those readmissions involve rCDI. PrCDI patients differ from those with SrCDI, the latter more similar to those rehospitalized without rCDI, but more severely ill and suffering worse economic outcomes. Although we found no evidence of an increase in mortality or 30-day readmission due to PrCDI or SrCDI relative to no CDI, both increase the LOS and hospital costs. Importantly, all groups, and SrCDI in particular, incurred a substantial deficit in reimbursements when compared with the expenditures, thus suggesting that more efficient models of care may be needed for these patients.
Acknowledgments
No persons other than the authors participated in data retrieval, analysis, interpretation, or manuscript preparation.
Author contributions
MDZ has participated in study design, results interpretation, manuscript drafting, and revision.
BHN has participated in analysis, and manuscript review and revision. Dr Nathanson had full access to all of the data in the study and takes responsibility for the integrity of the data and the accuracy of the data analysis.
SWM has participated in study design, analysis, and manuscript review and revision.
JJH has participated in study design, analysis, results interpretation, manuscript drafting and revision.
AFS has participated in study design, results interpretation, manuscript drafting and revision.
Conceptualization: Marya D. Zilberberg, Brian H. Nathanson, Stephen W. Marcella, John Jay Hawkshead, Andrew F. Shorr.
Data curation: Brian H. Nathanson.
Formal analysis: Brian H. Nathanson.
Funding acquisition: Marya D. Zilberberg.
Investigation: Marya D. Zilberberg, Andrew F. Shorr.
Methodology: Marya D. Zilberberg, Brian H. Nathanson, Stephen W. Marcella, Andrew F. Shorr.
Project administration: Marya D. Zilberberg.
Resources: Marya D. Zilberberg, Stephen W. Marcella, John Jay Hawkshead.
Supervision: Marya D. Zilberberg.
Validation: Marya D. Zilberberg.
Writing – original draft: Marya D. Zilberberg.
Writing – review & editing: Marya D. Zilberberg, Brian H. Nathanson, Stephen W. Marcella, John Jay Hawkshead, Andrew F. Shorr.
Supplementary Material
Footnotes
Abbreviations: AHRQ = Agency for Healthcare Research and Quality, CA = community-acquired, CO-HCFA = community-onset healthcare facility associated, GLM = generalized linear model, HCUP = Health Care Utilization Project, HO-HCFA = hospital-onset healthcare facility associated, ICD-9-CM = International Classification of Diseases, Ninth Revision, Clinical Modification, IQR = interquartile range, LOS = length of stay, MS-DRG = Medicare Severity Diagnosis Related Group, PrCDI = principal diagnosis rCDI, rCDI = recurrent Clostridium difficile infection, SD = standard deviation, SID = State Inpatient Databases, SrCDI = secondary diagnosis rCDI.
Key points: A rehospitalization following an index CDI admission is common, ∼1/3 of those readmissions involves rCDI, of which ∼1/3 carries principal diagnosis of CDI (PrCDI). Although neither PrCDI nor secondary (SrCDI) exhibited increased mortality or 30-day readmission relative to no CDI, both had increased the LOS and hospital costs. All groups incurred a substantial gap between reimbursements and expenditures, with SrCDI's deficit being the highest.
Disclaimer: The study was in part presented as a poster at ECCMID 2018. I certify that all coauthors have seen and agree with the contents of the manuscript. I certify that the submission is not under review by any other publication. Study supported by a grant from Merck & Co, Inc., Rahway, NJ.
Funding: This study was supported by a grant from Merck, Inc.
Dr Zilberberg has been a consultant to Pfizer, Rebiotix and ViroPharma.
Drs Marcella and Hawkshead∗ are employees of Merck, Inc.
No other ties to manufacturers with C difficile therapies
∗At the time of the project.
Supplemental Digital Content is available for this article.
The authors report no conflicts of interest
References
- [1].Louie TJ, Miller MA, Mullane KM, et al. Fidaxomicin versus vancomycin for Clostridium difficile infection. N Engl J Med 2011;364:422–31. [DOI] [PubMed] [Google Scholar]
- [2].Cornely OA, Crook DW, Esposito R, et al. Fidaxomicin versus vancomycin for infection with Clostridium difficile in Europe, Canada, and the USA: a double-blind, non-inferiority, randomised controlled trial. Lancet Infect Dis 2012;12:281–9. [DOI] [PubMed] [Google Scholar]
- [3].Garey KW, Sethi S, Yadav Y, et al. Meta-analysis to assess risk factors for recurrent Clostridium difficile infection. J Hosp Infect 2008;70:298–304. [DOI] [PubMed] [Google Scholar]
- [4].Zilberberg MD, Shorr AF, Jesdale WM, et al. Recurrent Clostridium difficile infection among Medicare patients in nursing homes: A population-based cohort study. Medicine (Baltimore) 2017;96:e6231. [DOI] [PMC free article] [PubMed] [Google Scholar]
- [5].Pichenot M, Héquette-Ruz R, Le Guern R, et al. Fidaxomicin for treatment of Clostridium difficile infection in clinical practice: a prospective cohort study in a French University Hospital. Infection 2017;45:425–31. [DOI] [PubMed] [Google Scholar]
- [6].Fehér C, Múñez Rubio E, Merino Amador P, et al. The efficacy of fidaxomicin in the treatment of Clostridium difficile infection in a real-worldclinical setting: a Spanish multi-centre retrospective cohort. Eur J Clin Microbiol Infect Dis 2017;36:295–303. [DOI] [PubMed] [Google Scholar]
- [7].Shah DN, Chan FS, Kachru N, et al. A multi-center study of fidaxomicin use for Clostridium difficile infection. Springerplus 2016;5:1224. [DOI] [PMC free article] [PubMed] [Google Scholar]
- [8].Olsen MA, Yan Y, Reske KA, et al. Recurrent Clostridium difficile infection is associated with increased mortality. Clin Microbiol Infect 2015;21:164–70. [DOI] [PubMed] [Google Scholar]
- [9].Olsen MA, Yan Y, Reske KA, et al. Impact of Clostridium difficile recurrence on hospital readmissions. Am J Infect Control 2015;43:318–22. [DOI] [PubMed] [Google Scholar]
- [10].Zilberberg MD, Shorr AF, Micek ST, et al. Clostridium difficile recurrence is a strong predictor of 30-day rehospitalization among patients in intensive care. Infect Control Hosp Epidemiol 2015;36:273–9. [DOI] [PubMed] [Google Scholar]
- [11].Dubberke ER, Schaefer E, Reske KA, et al. Attributable inpatient costs of recurrent Clostridium difficile infections. Infect Control Hosp Epidemiol 2014;35:1400–7. [DOI] [PubMed] [Google Scholar]
- [12].Leppin AL, Gionfriddo MR, Kessler M, et al. Preventing 30-day hospital readmissions: a systematic review and meta-analysis of randomized trials. JAMA Intern Med 2014;174:1095–107. [DOI] [PMC free article] [PubMed] [Google Scholar]
- [13].HCUP: Healthcare Cost and Utilization Project. Overview of State Inpatient Database (SID). Available at https://www.hcup-us.ahrq.gov/sidoverview.jsp; accessed January 26, 2018. [Google Scholar]
- [14].Goodwin AJ, Rice DA, Simpson KN, et al. Frequency, cost, and risk factors of readmissions among severe sepsis survivors. Crit Care Med 2015;43:738–46. [DOI] [PMC free article] [PubMed] [Google Scholar]
- [15].Cohen SH, Gerding DN, Johnson S, et al. Clinical practice guidelines for Clostridium difficile infection in adults: 2010 update by the society for healthcare epidemiology of America (SHEA) and the infectious diseases society of America (IDSA). Infect Control Hosp Epidemiol 2010;31:431–55. [DOI] [PubMed] [Google Scholar]
- [16].CMS.gov: Centers for Medicare and Medicaid Services. Inpatient Charge Data FY 2015. Available at: https://www.cms.gov/Research-Statistics-Data-and-Systems/Statistics-Trends-and-Reports/Medicare-Provider-Charge-Data/Inpatient2015.html; accessed January 26, 2018. [Google Scholar]
- [17].Williams RL. A note on robust variance estimation for cluster-correlated data. Biometrics 2000;56:645–6. [DOI] [PubMed] [Google Scholar]
- [18].Dubberke ER, Reske KA, McDonald LC, et al. ICD-9 codes and surveillance for Clostridium difficile-associated disease. Emerg Infect Dis 2006;12:1576–9. [DOI] [PMC free article] [PubMed] [Google Scholar]
- [19].Wen J, Barber GE, Anathakrishnan AN. Identification of recurrent Clostridium difficile infection using administrative codes: accuracy and implications for surveillance. Infect Control Hosp Epidemiol 2015;36:893–8. [DOI] [PubMed] [Google Scholar]
- [20].Schisterman EF, Cole SR, Platt RW. Overadjustment bias and unnecessary adjustment in epidemiologic studies. Epidemilogy 2009;20:488–95. [DOI] [PMC free article] [PubMed] [Google Scholar]
Associated Data
This section collects any data citations, data availability statements, or supplementary materials included in this article.