Abstract
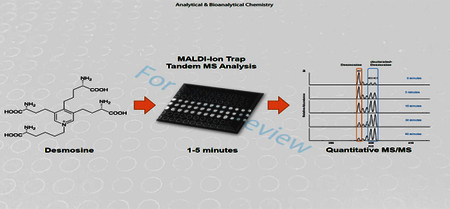
Desmosine (Des) and Isodesmosine (Isodes), cross-linking amino acids in the biomolecule elastin, may be used as biomarkers for various pathological conditions associated with elastin degradation. The current study presents a novel approach to quantify Des and Isodes using Matrix-Assisted Laser Desorption Ionization (MALDI)-tandem mass spectrometry (MS2) in a linear ion trap coupled to a vacuum MALDI source. MALDI-MS2 analysis of Des and Isodes are performed using stable-isotope labeled desmosine d4 (Labeled-Des) as an internal standard in different biological fluids, such as urine and serum. The method demonstrated linearity over two orders of magnitude with a detection limit of 0.02 ng/μL in both urine and serum without enrichment prior to mass spectrometry, and relative standard deviation of <5%. The method is used to evaluate the time-dependent degradation of Des upon UV radiation (254nm) and found to be consistent with quantification by 1H NMR. This is the first characterized MALDI-MS2 method for quantification of Des and Isodes and illustrates the potential of MALDI-ion trap MS2 for effective quantification of biomolecules. The reported method represents improvement over current liquid chromatography-based methods with respect to analysis time and solvent consumption, while maintaining similar analytical characteristics.
Keywords: MALDI-MS, Quantification, Desmosine, Isodesmosine, NMR, UV radiation
GRAPHICAL ABSTRACT
Introduction
The pyridinium-based amino acids, desmosine (Des) and its structural isomer isodesmosine (Isodes) stemming from the condensation of four lysine amino acid residues (Fig. 1), serve as cross-links between tropoelastin monomers, forming the complex polymer known as elastin [1, 2]. The elastin protein contributes to the structural foundation of lung, skin, and blood vessels and provides elasticity so that tissues can maintain their shape and normal physiological functions. In the progression of chronic obstructive pulmonary disease (COPD) [3, 4], along with other prevalent diseases such as aortic aneurysms [5, 6], atherosclerosis [7–9], skin lesions [10, 11], and cystic fibrosis [12, 13] protein degradation occurs whereby the Des/Isodes that bind elastin polymers are released in sputum, plasma and/or urine.
Fig. 1.

Structure of desmosine (Des), stable-isotope labeled desmosine-d4 (Labeled-Des) and isodesmosine (Isodes)
Studies have shown a correlation between the amounts of Des/Isodes detected in human body fluids with the degree of elastin degradation [14–16] and therefore, Des/Isodes have been considered as potential biomarkers to determine the extent of tissue damage and elastin breakdown. This is due to Des and Isodes being uniquely associated with mature elastin, not being metabolized after being released from tissue [17] and being independent from the diet [18]. A wide range of analytical techniques have been applied to detect Des/Isodes, which include enzyme-linked immunosorbent assays [19, 20], amino acid analysis [21], radioimmunoassay [22, 23], electrokinetic chromatography [24], electrophoresis [25–26], nuclear magnetic resonance, NMR [27, 28], high performance liquid chromatography, HPLC [13, 29–31], liquid chromatography- mass spectrometry, LC-MS and LC-tandem mass spectrometry, LC-MS/MS [3, 4, 32–34]. Among these methodologies, reported results show that LC-MS/MS gives the greatest selectivity and sensitivity for Des samples where Des detection limits on the order of 10−9 M have been obtained [21, 35]. One of the most recent techniques incorporating LC-MS to determine Des/Isodes amounts involve the use of deuterated Des as an internal standard [3, 4, 35, 36]. Ma et al. results, incorporating the quadruply deuterated (d4)-labeled-desmosine as an internal standard, demonstrated the concentrations of total Des + Isodes and free Des + Isodes in plasma were 0.51 and 0.09 ng/mL, respectively [35]. Another study conducted by Albarbarawi et al. to investigate total Des/Isodes content was performed on COPD urine samples utilized d5-Des internal standard. The data showed COPD patients on average (20.4 ng Des/mg creatinine) had three times the total amount of Des/Isodes than healthy patients (6.8 ng Des/mg creatinine) [3].
However, the analysis of Des/Isodes with LC-MS presents challenges such as relatively long chromatography runs as well as the labor-intensive process to prepare samples. One potential analytical technique to improve the Des/Isodes analysis times while maintaining sensitivity is to use Matrix-Assisted Laser Desorption/Ionization-Mass Spectrometry (MALDI-MS). MALDI has the benefit of rapid analysis times without the requirement for chromatographic separation.
In the present report, we have developed a MALDI-MS2 based quantification method to study Des samples mixed in serum or urine. The approach involves synthetic stable-isotope labeled d4-Desmosine (Labeled-Des) as an internal standard to quantify Des and Isodes by selectively monitoring an ion that arises from the removal of one of the side chains [M- CH2CH2CH2CH2CH(NH2)COOH]+, (130 Da). In the linear ion trap mass spectrometer, this transition yields a specific and sensitive method for the detection and quantification of Des and Isodes. In this study, the efficacy of the methodology is determined by evaluating linearity, detection limit, and run-to-run reproducibility of Des, Isodes, and 50:50 Des/Isodes mixtures in water, as well as in backgrounds of serum and urine. Furthermore, we have quantified time-dependent degradation of Des upon UV radiation using MALDI-MS2 and discuss the results in comparison to 1H NMR.
Materials and Methods
Chemicals
Des and Isodes standards were obtained from Elastin Products (Owensville, MO, USA). Labeled-Des was obtained from Toronto Research Chemicals (North York, ON, CANADA). α-cyano-4-hydroxycinnamic acid (CHCA) and deuterium oxide (D2O) were purchased from Sigma-Aldrich (St. Louis, MO, USA). Trifloroacetic acid was purchased from Thermo Scientific (Rockford, IL, USA). HPLC grade acetonitrile, water and new born calf serum were purchased from Fisher Scientific (Pittsburg, PA, USA). Human urine was obtained from healthy donors and sterile-filtered before use.
Mass Spectrometry
Samples were analyzed using Thermo LTQ XL linear ion trap mass spectrometer equipped with a vacuum MALDI source utilizing a nitrogen laser (337 nm) firing at 60 Hz (Thermo Scientific, Waltham, MA, USA). A saturated solution of CHCA was prepared as previously described [37] and was used as a matrix solution. MALDI-MS2 experiments were performed in positive ion mode using a 3.0 μJ laser energy. Mass spectra of samples were typically obtained using 400–600 scans (3–5 minutes) and processed with Xcalibur (2.0.7 SP1) software. The current study involves the use of Labeled-Des for quantification of Des and Isodes. To study the relative abundance of Des or Isodes in samples, the ratio of the generated fragment ion, m/z 397 (Des or Isodes) to m/z 400+401 (Labeled-Des) was utilized. The precursor ion (m/z 528), with isolation width of 6 Da, was chosen to perform MS2 experiment of Des or Isodes standard (m/z 526.2) mixed with Labeled-Des standard (m/z 530.2). Fragmentation of precursor ion was conducted with normalized collision energy 36, activation Q 0.25 and activation time 30 ms.
UV-irradiation of desmosine
The sample, prepared by dissolving Des in D2O solvent, was subjected to UV radiation using 12 low pressure mercury lamps of 254 nm in a Rayonet Photoreactor. UV-irradiated Des sample was analyzed using mass spectrometry (MALDI-MS2) and 1H NMR at different time intervals (0, 5, 15, 30, and 60 min). The enclosed system was used during UV-irradiation to ensure that Des sample was solely exposed to the specific wavelength of UV light.
Proton NMR
Liquid state 1H NMR spectra were recorded using Bruker DPX 400MHz FT NMR with automatic sampler. NMR spectra were acquired by accumulating 160 scans and chemical shifts (δ) were reported in parts per million (ppm). The peak at 8.44 ppm was observed in non-irradiated as well as UV-irradiated Des sample, was integrated in reference to the aliphatic region (1.00–5.25 ppm). The relative concentrations of Des were calculated from integration values of a peak at 8.44 ppm for different time intervals and used to determine the rate constant of UV-induced degradation of Des.
Sample preparation for detection limit study in urine and serum
To assess the detection limit of Des, an initial concentration of Des was prepared using urine and serum, using sterilized human urine from healthy donors and commercially prepared newborn calf serum without further dilution or purification. Successive dilutions of Des samples were prepared using HPLC-grade water. 1 μL of analyte solution was mixed directly with 9 μL of CHCA matrix solution without prior enrichment. For mass spectrometric analysis 1 μL of this mixture was deposited onto a stainless-steel plate using dried droplet method.
Results and discussion
The amounts of Des/Isodes have been shown to be elevated in many pathological disorders associated with elastin degradation [3, 4, 35]. Consequently, there is a need for a simple, reliable and sensitive method to quantify low levels of Des and Isodes. The present study introduces a MALDI-ion trap MS2 based quantification method for detection of Des and Isodes. Labeled-Des is employed as an internal standard for quantification of Des and Isodes. The single-stage MS analysis is inefficient to measure quantitative changes in the samples, due to the presence of intense matrix interference peak (m/z 379) which results in poor signal-to-noise ratio of the precursor ion of Des (m/z 526.2) and Labeled-Des (m/z 530.2) (see Electronic Supplementary Material (ESM) Fig. S1). Consequently, quantification is performed using the stable fragment ion (m/z 397) generated by removal of one of the side chains from Des molecule [M- CH2CH2CH2CH2CH(NH2)COOH]+, 130 Da, in tandem-MS mode. Linearity, dynamic range, detection limit, and reproducibility of the MALDI-MS2 method in water and different bodily fluids are presented in this report. To demonstrate the application of MALDI-MS2 method, quantification of Des degradation upon UV radiation (254 nm) at different time intervals is studied using both the MALDI-MS2 method and 1H NMR spectroscopy.
MALDI-MS2 analysis of Des, Isodes and Labeled-Des
Mass spectrometry is an analytical technique that separates ions based on their mass-to-charge (m/z) ratio. MALDI-mass spectrometry utilizes a small organic molecule (CHCA) as a matrix to assist in the energy transfer and ionization process of the analyte. Due to high background resulting from ions produced from matrix molecule itself, the precursor ions generated from Des samples were difficult to detect in single-stage MS. Therefore, MS2 spectra of the two structural isomers were then evaluated. The results showed both structural isomers indeed produce similar fragment ions. However, substantial differences in intensity of the fragment ions were observed. MS2 spectra of both structural isomers and Labeled-Des that used as an internal standard to quantify Des, Isodes and equimolar mixture of Des + Isodes are shown in Fig. 2a.
Fig. 2.
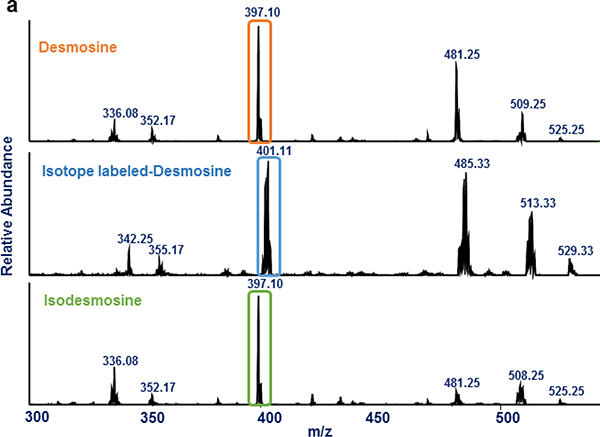
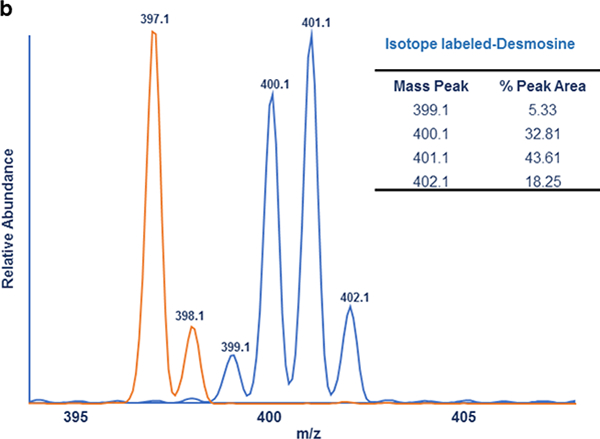
MALDI-MS2 analysis of Des, Isodes and Labeled-Des- (a) MS2 spectra of Des, Labeled-Des and Isodes are shown in a top, middle and bottom panel respectively. The highlighted fragment ions resulted from loss of a side chain of Des and Isodes (m/z 397) and Labeled-Des (m/z 401) were used for the quantification of Des/Isodes. (b) Isotope distribution of the fragment ion (m/z 401) of Labeled-Des and the fragment ion (m/z 397) of Des/Isodes are shown in blue and orange respectively. The result shows two major isotope peaks, m/z 400 and 401, represent greater than 75 percentage of total peak area of the fragment ion (m/z 401)
Since Labeled-Des was employed as an internal standard, it was important to evaluate its isotopic purity. To do this, the isotope distribution pattern of one of the most abundant fragment ions generated from Labeled-Des was evaluated. The selected fragment ion, m/z 401, was generated from loss of one of the side chains, [M-CH2CH2CH2CH2CH(NH2)COOH]+, of Labeled-Des molecule (Fig. 2b). The result of isotopic distribution pattern showed two major isotope peaks, m/z 400 and 401, representing greater than 75 percentage of total peak area of the fragment ion. Hence, to compensate for isotopic impurity, instead of incorporating peak area of any single isotope peak, we decided to incorporate the peak area of two most abundant isotope ions (m/z 401 and 400) of Labeled-Des in this investigation. To quantify Des/Isodes, ratio of peak area of fragment ions generated from Des/Isodes (m/z 397) to Labeled-Des (m/z 400+401) is determined. Linearity, detection limit, and reproducibility have been evaluated to assess the applicability, sensitivity and efficacy of the presented MALDI-MS2 quantification method.
Linearity and dynamic range
To evaluate the linearity of the MS response, 11 different concentrations of Des ranging from 125 ng/μL to 3.125 ng/μL were mixed in a 1:1 (v/v) ratio with 25 ng/μL of Labeled-Des. Two sets of each of these mixtures were analyzed in quadruplicate. The linear curve was obtained by plotting the average peak area ratio of Des/Labeled-Des vs. concentration of Des. Linear response of Des using Labeled-Des (R2= 0.998) over two orders of magnitude was obtained as shown in Fig. 3a. Relative standard deviation (RSD) obtained using MALDI-MS2 method was from 0.17% to 4.7% for the entire dilution range (data are shown in ESM Table S1).
Fig. 3.
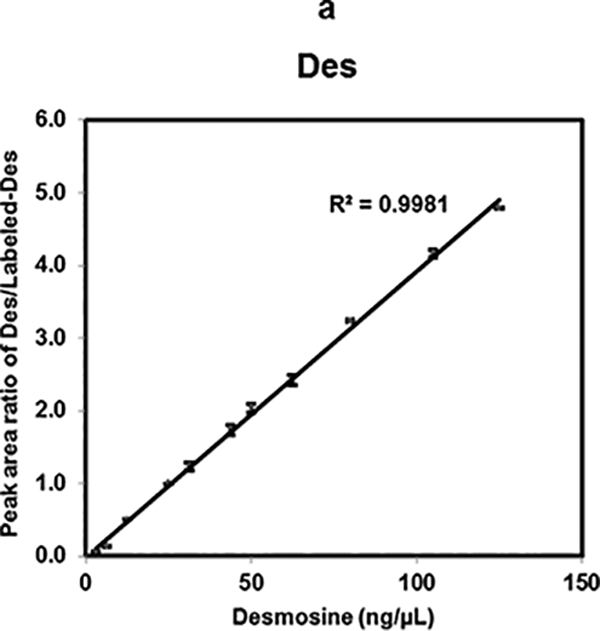
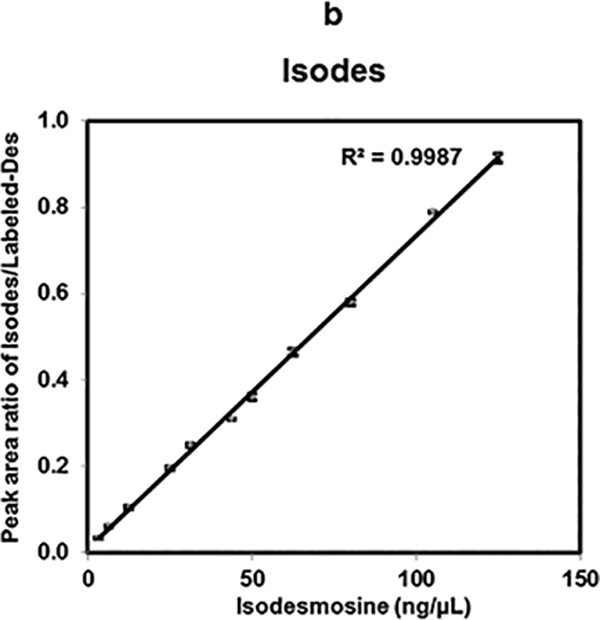
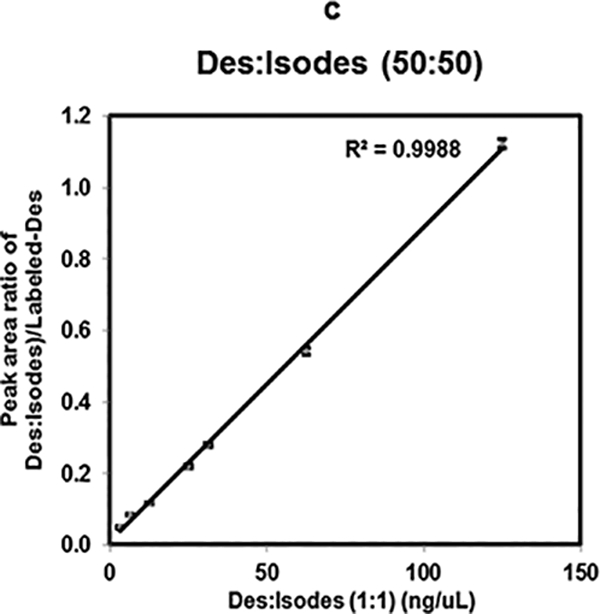
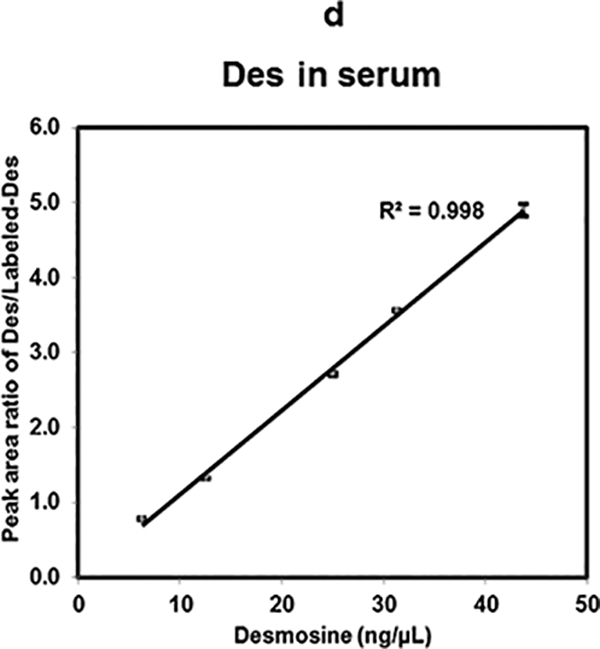
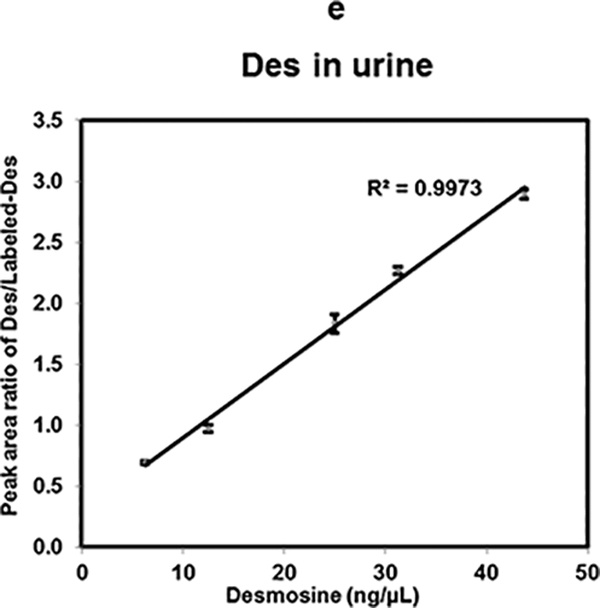
Linearity of Des, Isodes and equimolar concentration ratio of Des- Isodes were evaluated using MALDI-MS2 quantification method. Linearity of MS response over the dynamic range from 125 ng/μL to 3.125 ng/μL are shown for- Des (a), Isodes (b), and equimolar concentration ratio of Des: Isodes (c). Linearity of Des was also assessed in biological fluids- serum (d), and urine (e) over the dynamic range from 43.75 ng/μL to 6.25 ng/μL. Various concentrations of Des were mixed with 25 ng/μL of Labeled-Des.
A response curve for Isodes was generated for similar concentration ranges as of Des. Linear response (R2= 0.998) was also obtained from response curve of Isodes (Fig. 3b). Each of these dilutions was analyzed in quadruplicate. Moreover, because in vivo, Des and Isodes occur in equimolar amounts [38], we mimicked this condition by investigating equimolar concentration ratios of Des and Isodes. These were studied over a concentration range of 125 ng/μL to 3.125 ng/μL mixed with 25 ng/μL of Labeled-Des. A linear response with R2 value of 0.998 was obtained for equimolar ratio of Des and Isodes as shown in Fig. 3c.We note that quantitatively reproducible differences in MS2 fragment intensities could in principle be used to independently quantify Des and Isodes; however prior studies indicate that using the combined concentration of Des and Isodes give a better assessment of elastin breakdown [3].
Furthermore, the linearity of Des response in biological fluids was assessed. Both urine and serum were spiked (as described in sample preparation) using concentration ranges from 43.75 ng/μL to 6.25 ng/μL of Des mixed with 25 ng/μL of Labeled-Des standard. The linear curves with R2 values of 0.998 (Fig. 3d) and 0.997 (Fig. 3e) were obtained in serum and urine respectively. Results derived from these linearity assays using MALDI-MS2 quantification methods are consistent for Des, Isodes and their equimolar mixtures in water as well as in spiked biological fluids.
Limits of Detection and Quantification
To determine the detection limit of MALDI-MS2 quantification method, six successive five-fold dilutions of Des spiked into in serum and urine. We were able to detect a peak corresponding to Des at concentrations down to 0.0040 ng/μL. The limit of quantification was calculated as 10σ/s, where σ is the standard error of the estimate, and s is the slope of the calibration line, using the dilutions from 0.50 down to 0.0040 ng/ μL (ESM Table S2), and determined to be 0.022 and 0.011 for urine and serum, respectively. This result was consistent with the result obtained when evaluating the accuracy of the Des concentration as determined by the MALDI-MS2 method as a function of concentration (Table 1). In the concentration range down to 0.020 ng/ μL, percent error was observed from −7.0% to 4.4%, well within the range deemed acceptable by the US Food and Drug Administration (±20%)[39]. These two independent measures indicate an LOQ for the MALDI-MS2 method on the order of 0.02 ng/μL in complex biological matrices without prior enrichment. Conventional solid-phase extraction methods, which are typically applied in LC-MS/MS analysis would be expected to add 1 to 2 orders of magnitude improvement in sensitivity due to concentration of sample.
Table 1.
Detection and quantification limit of MALDI-MS2 method- Successive 5-fold dilutions of 12.5 ng/μL Des mixed with 25 ng/μL of Labeled-Des in serum and urine were evaluated to assess the detection and quantification limit of MALDI-MS2 method.
| Serum | Urine | |||
|---|---|---|---|---|
| Desmosine (ng/μL) |
Observed (ng/ μL) | % error | Observed (ng/ μL) | % error |
| 12.5 | 12.50 ± 0.32 | 0.0 | 12.50 ± 0.10 | 0.0 |
| 2.50 | 2.46 ± 0.04 | −1.5 | 2.46 ± 0.02 | −1.4 |
| 0.50 | 0.500 ± 0.015 | 0.0 | 0.478 ± 0.007 | −4.4 |
| 0.10 | 0.104 ± 0.004 | 4.0 | 0.094 ± 0.001 | −6.0 |
| 0.020 | 0.0206 ± 0.0003 | 3.0 | 0.0186 ± 0.0009 | −7.0 |
| 0.0040 | 0.0045 ± 0.0004 | 12.5 | 0.0048 ± 0.0002 | 20 |
Reproducibility
To evaluate the reproducibility of the present method, we conducted triplicate studies performed by different lab personnel. Response curves for Des in water were generated following a similar approach as described in the linearity and dynamic range sections, over the time span of two weeks. The run-to-run RSD values for entire concentration range were less than 5% (Fig. 4) demonstrating the reliability of the current MALDI-MS2 method (data are shown in ESM Table S3). During the two weeks test period, Des, Isodes, and Labeled-Des underwent more than three freeze/thaw cycles. Thus, these results also demonstrate the stability of Des, Isodes and Labeled-Des standards.
Fig. 4.
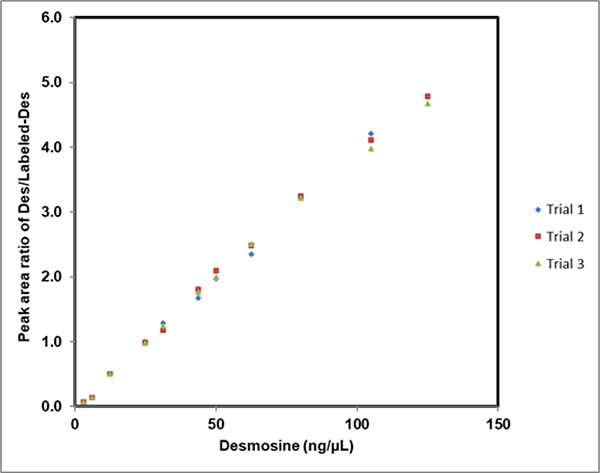
Assessment of reproducibility of MALDI-MS2 method- Reproducibility of the present method was determined by evaluating the response curve of Des in HPLC water in triplicate by different lab personnel. Various concentrations of Des were mixed with 25 ng/μL of LabeledDes. The run-to-run %RSD values for entire concentration range were < 5
UV-irradiation of Des
Detrimental effects of UV radiation on skin such as loss of elasticity, premature aging and wrinkled appearance have been discussed in previous reports [28, 40, 41] may occur as a result of reduction in Des cross-linking of elastin. Moreover, the results of photolysis study performed by Baurain et al. showed maximum breakdown of Des and Isodes at 274 nm and 285 nm respectively [41]. We therefore, utilize the current MALDI-MS2 method to evaluate UV-induced breakdown of Des.
To study the effect of UV radiation on Des degradation, samples were aliquoted and analyzed at different time intervals using MALDI-MS2 (Fig. 5a). Additionally, to validate the change in concentration observed using our method, we have also quantified Des using 1H NMR spectroscopy, and compared the results of the two methodologies. The results of MS2 analysis distinctly demonstrate decrease in relative abundance of Des fragment ion (m/z 397) with time. The peak area of 25 ng/μL Labeled-Des fragment ions (m/z 400+401) was used as a reference to determine the concentration of Des standard at zero-time point. In the NMR study, a peak in the aromatic region (8.44ppm) observed in the non-irradiated control spectrum, as well as the spectra of all time points, was used to track the UV-induced breakdown Des (ESM Fig. S2). The concentration of Des obtained from MALDI-MS2 and 1H NMR analysis at different time points are shown in Fig. 5b. The results from both analyses indicate that Des concentration reduces to roughly half after 5 min of UV radiation. Furthermore, a similar pattern of decrease in concentration of Des with different time intervals was observed from 1H NMR and MALDI-MS2 method. The first-order rate constants estimated using MALDI-MS2 method and 1H NMR spectroscopy are 0.110 ± 0.021 min−1 and 0.124 ± 0.008 min−1 respectively.
Fig. 5.
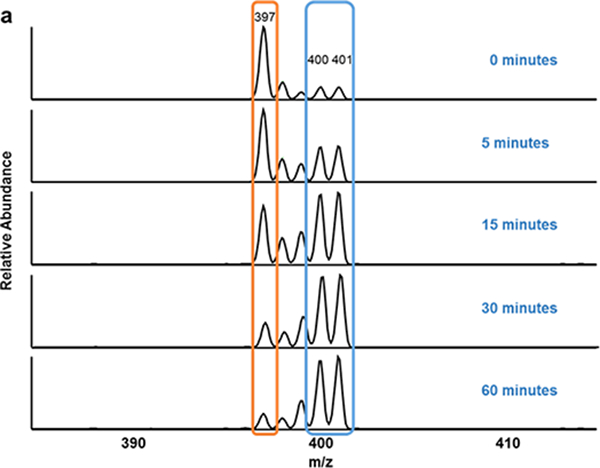
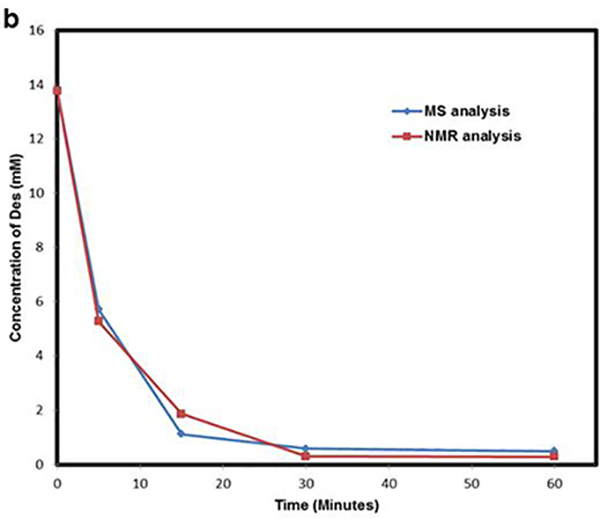
UV-induced degradation of Des- Degradation of Des was studied by irradiating the sample to UV light at 254 nm for different time intervals (0, 5, 15, 30 and 60 minutes). (a) Represents the MS2 spectra of UV-irradiated Des mixed with 25 ng/μL of Labeled-Des. The fragment ion generated from Des (decrease with time) and Labeled-Des are highlighted in orange and blue box respectively. (b) Represents the UV-induced breakdown by measuring concentration of Des at different time intervals using MALDI-MS2 and NMR spectroscopy
Comparison to existing methods
The current state of the art in detection of desmosines utilizes LC-MS/MS methods either with or without stable isotope-labeled standards [35, 43,44]. The approach presented here shows similar performance characteristics, such as precision, accuracy and sensitivity, while leveraging the strengths unique to MALDI. For example, current LC-MS run times range from 12 minutes [43] and longer and require column equilibration between runs. We typically take a conservative approach and interrogate our MALDI spots for 3–5 minutes, but even with 1 minute scans, we are able to maintain accuracy and reproducibility (ESM Table S4). Additionally MALDI requires no equilibration between samples; the time to move between MALDI spots is about 5 seconds. In addition, the MALDI approach reduces the expense and environmental impact of solvent usage by multiple orders of magnitude. Each MALDI spot requires 10 microliters or less of solvent to prepare.
The MALDI approach also has the benefit that spectra do not need to be extracted from an LC run, and detection and quantification of peaks can be fully automated via software. Additionally, our MALDI approach consumes only a small fraction of each spot, and therefore unlike destructive LC-MS approaches, our samples can be re-analyzed for Des or for other purposes. The tolerance of MALDI towards moderate amounts of contaminants allows fewer cleanup steps. For example, no purification is required before the analysis of urine or serum; we have used similar MALDI approaches to quantify desmosines directly from hydrolysates of elastin without purification [27,28]. Therefore we believe that our MALDI approach represents a robust, novel methodology that can complement existing LC-MS techniques.
Conclusions
Although the application of LC-MS/MS methods for determination of Des/Isodes in various body fluids has met a certain amount of success, there is still a need for a simpler, more rapid, reliable and sensitive quantification method. A MALDI-MS based method offers these traits, including excellent sensitivity and shorter analysis time due to the elimination of chromatographic separation, while maintaining similar analytical characteristics. Here, for the first time, we fully characterize a MALDI-MS2 method for the quantification of Des/Isodes directly from bodily fluids. We have evaluated concentration ranges from >100 ng/μL down to 0.02 ng/μL without prior concentration steps like solid-phase extraction and found the MALDI-MS2 to perform similarly to existing LC-MS/MS methods with the increase in speed and reduction in per-run expense associated with chromatography-free MALDI ionization. These results demonstrate that MALDI-linear ion trap tandem MS is suitable for quantifying biomolecules. The case study performed on the quantification of Des breakdown by irradiation of UV light using MALDI-MS2 explicitly demonstrates consistency between results derived from 1H NMR spectra and the current quantification method. We therefore believe MALDI-MS2 has potential to be applied in a clinical lab setting to diagnose conditions which induce elastin degradation
Supplementary Material
Acknowledgements
The authors acknowledge Dr. Sanjai Kumar and Ashif Bhuiyan from Queens College/City University of New York for their assistance in conducting the 1H NMR study. G.B. acknowledges support from the NIH award 2SC1GM086268.
Footnotes
Compliance with ethical standards
All human specimens were provided with informed consent of the donor. These studies were conducted under the guidance of the Human Research Protection Program of the City University of New York, and have been performed in accordance with ethical standards.
Conflict of interest
The authors declare that they have no conflict of interest.
REFERENCES
- 1.Mithieux SM, Wise SG, Raftery MJ, Starcher B, Weiss AS. A model two- component system for studying the architecture of elastin assembly in vitro. J Struct Biol. 2005;149(3):282–9. [DOI] [PubMed] [Google Scholar]
- 2.Bode DC, Pagani ED, Cumiskey WR, Von Roemeling R, Hamel L, Silver PJ. Comparison of urinary desmosine excretion in patients with chronic obstructive pulmonary disease or cystic fibrosis. Pulm Pharmacol Ther. 2000; 13(4): 175–80. [DOI] [PubMed] [Google Scholar]
- 3.Albarbarawi O, Barton A, Lin Z, Takahashi E, Buddharaju A, Brady J, Miller D, Palmer CN, Huang JT. Measurement of urinary total desmosine and isodesmosine using isotope-dilution liquid chromatography-tandem mass spectrometry. Anal Chem. 2010;82(9):3745–50. [DOI] [PubMed] [Google Scholar]
- 4.Ma S, Turino GM, Lin YY. Quantitation of desmosine and isodesmosine in urine, plasma, and sputum by LC-MS/MS as biomarkers for elastin degradation. J Chromatogr B. 2011;879(21):1893–8. [DOI] [PubMed] [Google Scholar]
- 5.Watanabe M, Sawai T. Alteration of cross-linking amino acids of elastin in human aorta in association with dissecting aneurysm: analysis using high performance liquid chromatography. Tohoku J Exp Med. 1999;187(4):291–303. [DOI] [PubMed] [Google Scholar]
- 6.Marque V, Kieffer P, Gayraud B, Lartaud-Idjouadiene I, Ramirez F, Atkinson J. Aortic wall mechanics and composition in a transgenic mouse model of Marfan syndrome. Arterioscler Thromb VasC Biol. 2001;21(7):1184–9. [DOI] [PubMed] [Google Scholar]
- 7.Galis ZS, Sukhova GK, Lark MW, Libby P. Increased expression of matrix metalloproteinases and matrix degrading activity in vulnerable regions of human atherosclerotic plaques. J Clin Investig. 1994;94(6):2493–503. [DOI] [PMC free article] [PubMed] [Google Scholar]
- 8.Dollery CM, Owen CA, Sukhova GK, Krettek A, Shapiro SD, Libby P. Neutrophil elastase in human atherosclerotic plaques: production by macrophages. Circulation. 2003; 107(22):2829–36. [DOI] [PubMed] [Google Scholar]
- 9.Umeda H, Aikawa M, Libby P. Liberation of desmosine and isodesmosine as amino acids from insoluble elastin by elastolytic proteases. Biochem Biophys Res Commun. 2011;411(2):281–6. [DOI] [PMC free article] [PubMed] [Google Scholar]
- 10.Schwartz E, Cruickshank FA, Lebwohl M. Determination of desmosines in elastin-related skin disorders by isocratic high-performance liquid chromatography. Exp Mol Pathol. 1990;52(1):63–8. [DOI] [PubMed] [Google Scholar]
- 11.Annovazzi L, Viglio S, Gheduzzi D, Pasquali-Ronchetti I, Zanone C, Cetta G, Iadarola P. High levels of desmosines in urine and plasma of patients with pseudoxanthoma elasticum. Eur J Clin Invest. 2004;34(2):156–64. [DOI] [PubMed] [Google Scholar]
- 12.Viglio S, Iadarola P, Lupi A, Trisolini R, Tinelli C, Balbi B, Grassi V, Worlitzsch D, Doring G, Meloni F, Meyer KC. MEKC of desmosine and isodesmosine in urine of chronic destructive lung disease patients. Eur Respir J. 2000; 15(6): 1039–45. [DOI] [PubMed] [Google Scholar]
- 13.Stone PJ, Konstan MW, Berger M, Dorkin HL, Franzblau C, Snider GL. Elastin and collagen degradation products in urine of patients with cystic fibrosis. Am J Respir Crit Care Med. 1995;152(1):157–62. [DOI] [PubMed] [Google Scholar]
- 14.Tanigawa T, Komatsu A, Usuki T. [13C3, 15N1]-labeled isodesmosine: A potential internal standard for LC-MS/MS analysis of desmosines in elastin degradation. Bioorganic Med Chem Lett. 2015;25(10):2046–9. [DOI] [PubMed] [Google Scholar]
- 15.Umeda H, Aikawa M, Libby P. Liberation of desmosine and isodesmosine as amino acids from insoluble elastin by elastolytic proteases. Biochem Biophys Res Commun. 2011;411(2):281–6. [DOI] [PMC free article] [PubMed] [Google Scholar]
- 16.Ongay S, Sikma M, Horvatovich P, Hermans J, Miller BE, ten Hacken NH, Bischoff R. Free urinary desmosine and isodesmosine as COPD biomarkers: the relevance of confounding factors. COPD. 2016;3(2):560. [DOI] [PMC free article] [PubMed] [Google Scholar]
- 17.Laguna TA, Wagner BD, Starcher B, Luckey Tarro HK, Mann SA, Sagel SD, Accurso FJ. Urinary desmosine: a biomarker of structural lung injury during CF pulmonary exacerbation. Pediatr Pulmonol. 2012;47(9):856–63. [DOI] [PMC free article] [PubMed] [Google Scholar]
- 18.Starcher BC. Lung elastin and matrix. Chest. 2000;117(5):229S–34S. [DOI] [PubMed] [Google Scholar]
- 19.Watanabe T, Ishimori K, Verplanke AJ, Matsuki H, Kasuga H. An enzyme-linked immunosorbent assay (ELISA) for the quantitation of urinary desmosine. Tokai J Exp Clin Med. 1989;14(4):347–56. [PubMed] [Google Scholar]
- 20.Cocci F, Miniati M, Monti S, Cavarra E, Gambelli F, Battolla L, Lucattelli M, Lungarella G. Urinary desmosine excretion is inversely correlated with the extent of emphysema in patients with chronic obstructive pulmonary disease. Int J Biochem Cell Biol. 2002;34(6):594–604. [DOI] [PubMed] [Google Scholar]
- 21.Luisetti M, Ma S, Iadarola P, Stone PJ, Viglio S, Casado B, Lin YY, Snider GL, Turino GM. Desmosine as a biomarker of elastin degradation in COPD: current status and future directions. Eur Respir J. 2008;32(5):1146–57. [DOI] [PubMed] [Google Scholar]
- 22.McClintock DE, Starcher B, Eisner MD, Thompson BT, Hayden DL, Church GD, Matthay MA. Higher urine desmosine levels are associated with mortality in patients with acute lung injury. Am J Physiol Lung Cell Mol Physiol. 2006;291(4):L566–71. [DOI] [PMC free article] [PubMed] [Google Scholar]
- 23.Darnule TV, McKee M, Darnule AT, Turino GM, Mandl I. Solid-phase radioimmunoassay for estimation of elastin peptides in human sera. Anal Biochem. 1982;122(2):302–7. [DOI] [PubMed] [Google Scholar]
- 24.Viglio S, Zanaboni G, Luisetti M, Trisolini R, Grimm R, Cetta G, Iadarola P. Micellar electrokinetic chromatography for the determination of urinary desmosine and isodesmosine in patients affected by chronic obstructive pulmonary disease. J Chromatogr B Biomed Sci Appl. 1998;714(1):87–98. [DOI] [PubMed] [Google Scholar]
- 25.Annovazzi L, Viglio S, Perani E, Luisetti M, Baraniuk J, Casado B, Cetta G, Iadarola P. Capillary electrophoresis with laser-induced fluorescence detection as a novel sensitive approach for the analysis of desmosines in real samples. Electrophoresis. 2004;25(4–5):683–91. [DOI] [PubMed] [Google Scholar]
- 26.Stolk J, Veldhuisen B, Annovazzi L, Zanone C, Versteeg EM, Van Kuppevelt TH, Nieuwenhuizen W, Iadarola P, Luisetti M. Short-term variability of biomarkers of proteinase activity in patients with emphysema associated with type Z alpha-1-antitrypsin deficiency. Respir Res. 2005;6(1):47. [DOI] [PMC free article] [PubMed] [Google Scholar]
- 27.Papaioannou A, Louis M, Dhital B, Ho HP, Chang EJ, Boutis GS. Quantitative comparison of structure and dynamics of elastin following three isolation schemes by 13C solid state NMR and MALDI mass spectrometry. Biochim Biophys Acta, Proteins Proteomics. 2015;1854(5):391–401. [DOI] [PMC free article] [PubMed] [Google Scholar]
- 28.Dhital B, Durlik P, Rathod P, Gul-E-Noor F, Wang Z, Sun C, Chang EJ, Itin B, Boutis GS. Ultraviolet radiation reduces desmosine cross-links in elastin. Biochem Biophys Rep. 2017;10:172–7. [DOI] [PMC free article] [PubMed] [Google Scholar]
- 29.Stone PJ, Gottlieb DJ, O’connor GT, Ciccolella DE, Breuer R, Bryan-Rhadfi J, Shaw HA, Franzblau C, Snider GL. Elastin and collagen degradation products in urine of smokers with and without chronic obstructive pulmonary disease. Am J Respir Crit Care Med. 1995;151(4):952–9. [DOI] [PubMed] [Google Scholar]
- 30.Stone PJ, Bryan-Rhadfi J, Lucey EC, Ciccolella DE, Crombie G, Faris B, Snider GL, Franzblau C. Measurement of urinary desmosine by isotope dilution and high performance liquid chromatography: correlation between elastase-induced air-space enlargement in the hamster and elevation of urinary desmosine. Am Rev Respir Dis. 1991;144(2):284–90. [DOI] [PubMed] [Google Scholar]
- 31.Cumiskey WR, Pagani ED, Bode DC. Enrichment and analysis of desmosine and isodesmosine in biological fluids. J Chromatogr B Biomed Sci Appl. 1995;668(2):199–207. [DOI] [PubMed] [Google Scholar]
- 32.Ma S, Lieberman S, Turino GM, Lin YY. The detection and quantitation of free desmosine and isodesmosine in human urine and their peptide-bound forms in sputum. Proc Natl Acad Sci. 2003;100(22): 12941–3. [DOI] [PMC free article] [PubMed] [Google Scholar]
- 33.Ma S, Lin YY, Turino GM. Measurements of desmosine and isodesmosine by mass spectrometry in COPD. Chest. 2007; 131(5): 1363–71. [DOI] [PubMed] [Google Scholar]
- 34.Boutin M, Berthelette C, Gervais FG, Scholand MB, Hoidal J, Leppert MF, Bateman KP, Thibault P. High-Sensitivity NanoLC-MS/MS Analysis of Urinary Desmosine and Isodesmosine. Anal Chem. 2009;81(5):1881–7. [DOI] [PMC free article] [PubMed] [Google Scholar]
- 35.Ma S, Turino GM, Hayashi T, Yanuma H, Usuki T, Lin YY. Stable deuterium internal standard for the isotope-dilution LC-MS/MS analysis of elastin degradation. Anal Biochem. 2013;440(2):158–65. [DOI] [PubMed] [Google Scholar]
- 36.Huang JT, Chaudhuri R, Albarbarawi O, Barton A, Grierson C, Rauchhaus P, Weir CJ, Messow M, Stevens N, McSharry C, Feuerstein G. Clinical validity of plasma and urinary desmosine as biomarkers for chronic obstructive pulmonary disease. Thorax. 2012;67(6):502–8. [DOI] [PMC free article] [PubMed] [Google Scholar]
- 37.Ho HP, Rathod P, Louis M, Tada CK, Rahaman S, Mark KJ, Leng J, Dana D, Kumar S, Lichterfeld M, Chang EJ. Studies on quantitative phosphopeptide analysis by matrix-assisted laser desorption/ionization mass spectrometry without label, chromatography or calibration curves. Rapid Commun Mass Spectrom. 2014;28(24):2681–9. [DOI] [PMC free article] [PubMed] [Google Scholar]
- 38.Devenport NA, Reynolds JC, Parkash V, Cook J, Weston DJ, Creaser CS. Determination of free desmosine and isodesmosine as urinary biomarkers of lung disorder using ultra performance liquid chromatography-ion mobility-mass spectrometry. J Chromatogr. B 2011;879(32):3797–801. [DOI] [PubMed] [Google Scholar]
- 39.Shrivastava A, Gupta VB. Methods for the determination of limit of detection and limit of quantitation of the analytical methods. Chron Young Sci. 2011;2(1):21. [Google Scholar]
- 40.Braverman IM, Fonferko E. Studies in cutaneous aging: I. The elastic fiber network. J Invest Dermatol. 1982;78(5):434–43. [DOI] [PubMed] [Google Scholar]
- 41.Imayama S, Nakamura K, Takeuchi M, Hori Y, Takema Y, Sakaino Y, Imokawa G. Ultraviolet-B irradiation deforms the configuration of elastic fibers during the induction of actinic elastosis in rats. J Dermatol Sci. 1994;7(1):32–8. [DOI] [PubMed] [Google Scholar]
- 42. Baurain R, Larochelle JF, Lamy F. Photolysis of desmosine and isodesmosine by ultraviolet light. The FEBS J. 1976;67(1):155–64. [DOI] [PubMed] [Google Scholar]
- 43.Shiraishi K, Matsuzaki K, Matsumoto A, Hashimoto Y, Iba K. Development of a robust LC-MS/MS method for determination of desmosine and isodesmosine in human urine. J Oleo Sci. 2010;59(8):431–9. [DOI] [PubMed] [Google Scholar]
- 44.Miliotis T, Lindberg C, Semb KF, van Geest M, Kjellström S. Quantitative high- performance liquid chromatography-tandem mass spectrometry method for the analysis of free desmosines in plasma and urine. J Chromatogr A. 2013;1308:73–8. [DOI] [PubMed] [Google Scholar]
Associated Data
This section collects any data citations, data availability statements, or supplementary materials included in this article.


