

SUMMARY
By functioning as an enzyme cofactor, hemoglobin component and gene regulator, heme is vital for life. One mode of heme-regulated transcription involves amplifying the activity of GATA-1, a key determinant of erythrocyte differentiation. To discover biological consequences of the metal cofactor-transcription factor mechanism, we merged GATA-1/heme-regulated sectors of the proteome and transcriptome. This multi-omic analysis revealed a GATA-1/heme circuit involving hemoglobin subunits, ubiquitination components, and proteins not implicated in erythrocyte biology, including the zinc exporter Slc30a1. Though GATA-1 induced expression of Slc30a1 and the zinc importer Slc39a8, Slc39a8 dominantly increased intracellular zinc, which conferred erythroblast survival. Subsequently, a zinc transporter switch, involving decreased importer and sustained exporter expression, reduced intracellular zinc during terminal differentiation. Downregulating Slc30a1 increased intracellular zinc and, strikingly, accelerated differentiation. This analysis established a conserved paradigm in which a GATA-1/heme circuit controls trace metal transport machinery and trace metal levels as a mechanism governing cellular differentiation.
In-Brief/eTOC BLURB
Zinc deficiency causes anemia through poorly understood mechanisms. Tanimura et al. report that GATA-1, a major determinant of red blood cell development, and heme, an essential cofactor for hemoglobin synthesis, control zinc levels. Zinc levels in turn regulate red blood cell development, thereby establishing a paradigm that informs anemia mechanisms.
INTRODUCTION
Concerted enzymatic reactions in mitochondria synthesize the iron-protoporphyrin molecule heme that controls essential cellular processes (Dailey and Meissner, 2013). Mutations of ALAS2, encoding the rate-limiting enzyme of heme synthesis aminolevulinic acid synthase II, disrupt heme synthesis and elicit deleterious phenotypes including anemia (Campagna et al., 2014; Cotter et al., 1994; Kaneko et al., 2014). Beyond the canonical heme functions as an iron-containing enzyme cofactor and oxygen-binding hemoglobin component, heme also controls gene expression. However, the physiological and pathological mechanisms underlying heme-regulated gene expression are incompletely understood.
Iron and heme regulate gene expression transcriptionally and post-transcriptionally. Iron activates iron response element binding proteins (IRPs) that form complexes on iron response elements (IREs) of target mRNAs (Muckenthaler et al., 2008). This system represses ALAS-2 protein translation (Cox et al., 1991; Dandekar et al., 1991). As s imbalance between hemoglobin polypeptides and heme is pathogenic (Sankaran and Weiss, 2015), coordinating globin gene expression and heme synthesis is critical. This coordination is accomplished, in part, via heme-mediated activation of an EIF2α kinase that suppresses globin translation (Han et al., 2001). Heme binds the repressor Bachl, inducing its degradation by the proteasome (Zenke-Kawasaki et al., 2007). In a low heme environment, Bach1 accumulates and occupies c/s-elements at target genes, including Hbb-b1 encoding β-globin, to repress transcription (Sun et al., 2004; Tanimura et al., 2016). Besides pathologies caused by insufficient heme, ablation of a heme exporter (FLVCR1) increases intracellular heme and impairs erythrocyte development (Doty et al., 2015).
In GATA-1-null erythroid precursor cells (G1E-ER-GATA-1) (Grass et al., 2003; Gregory et al., 1999), we used CRISPR/Cas9 to delete Alas2 intron 1 and 8 GATA motifs that bind GATA-1 (double mutants) (Tanimura et al., 2016), the master regulator of erythrocyte differentiation (Evans and Felsenfeld, 1989; Katsumura et al., 2017; Pevny et al., 1991; Tsai et al., 1989). These cells stably express a β-estradiol-activated allele encoding the estrogen receptor hormone binding domain fused to GATA-1. In this genetic complementation system, the GATA motif mutations abrogated GATA-1-mediated activation of Alas2 transcription, decreased heme ~30 fold and attenuated activation of a GATA-1 target gene cohort (Tanimura et al., 2016). Bach1 accumulates in low-heme conditions and opposes GATA-1-mediated activation of a gene cohort including β-globin (Tanimura et al., 2016). Heme amplification of additional GATA-1-activated genes was Bach1-independent (Tanimura et al., 2016). Through Bach1-dependent and -independent mechanisms, heme establishes/maintains the erythroblast transcriptome and controls differentiation.
To achieve a global perspective on how metal-containing cofactors intermesh with transcriptional regulatory machinery and to unveil new dimensions into how cellular processes are regulated and de-regulated in disease, we deployed a GATA/heme multi-omics strategy. Using the Alas2-enhancer mutant cells, we previously performed RNA-seq to elucidate the GATA-1/heme-regulated transcriptome, and in this study, quantitative proteomics was performed to compare proteomic and transcriptomic profiles. Mechanistic studies with the unique multi-omics resource that emerged established a paradigm in which intracellular zinc confers cellular survival, and a GATA/heme circuit instigates a zinc transporter switch that regulates cellular differentiation.
RESULTS
GATA/heme multi-omics
To decipher how GATA factor and heme mechanisms intersect and function independently, we utilized high-resolution mass spectrometry to measure global protein abundances in a system that allows GATA-1 genetic complementation in cells with normal and subphysiological heme levels (Figures 1A and S1). We compared the proteomic profiles with the transcriptomes obtained from our previous RNA-seq analysis. Heme was rendered ~30-fold lower by genetic editing of GATA motifs in Alas2 enhancers in G1E-ER-GATA-1 cells (Tanimura et al., 2016). Nanoflow LC-MS/MS analysis of complex peptide mixtures, generated by digestion of the whole proteomes with trypsin, was performed using a quadrupole-Orbitrap-dual cell linear ion trap hybrid mass spectrometer. Raw mass spectral data were searched with the MaxQuant proteomics software package against a database of mouse proteins concatenated with reverse sequences as decoy targets (Cox and Mann, 2008; Elias and Gygi, 2007). Our analysis yielded 1,069,305 peptide spectral matches, 111,385 unique peptide identifications, and 7,168 detected proteins (1% false discovery rate). Label-free quantitation, also calculated with MaxQuant, yielded quantitative data for 6,017 proteins across all samples.
Figure 1. GATA/heme multi-omics in a GATA-1 genetic complementation system with normal and sub-physiological heme.
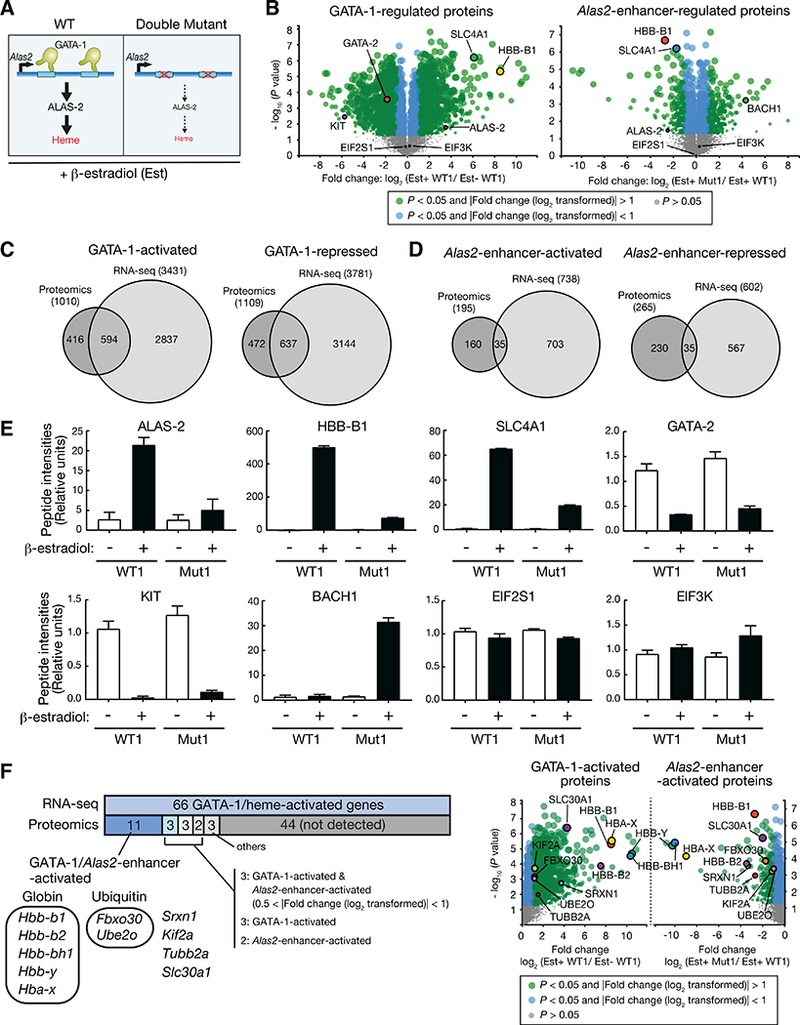
(A) Genetic complementation assay. β-estradiol activation of ER-GATA-1 in GATA-1-null G1E-ER-GATA-1 cells induces Alas2 expression, which increases heme biosynthesis in WT cells. Alas2 intron 1/8 mutations in mutant cells (double mutant) severely reduced Alas2 expression and heme levels.
(B) Volcano plots of quantitative proteomics data depicting GATA-1-regulated proteins identified by comparing uninduced and β-estradiol-treated WT G1E-ER-GATA-1 cell proteomes and Alas2-enhancer-regulated proteins identified by comparing β-estradiol-treated WT and double mutant cell proteomes (n = 3 biological replicates). Est = β-estradiol.
(C) Venn diagrams depict overlap between GATA-1-activated and -repressed proteins and mRNA.
(D) Venn diagrams depict overlap between A/as2-enhancer-activated and –repressed proteins and mRNA.
(E) Peptide intensities of representative proteins (n = 3 biological replicates, mean +/− SE).
(F) 11 genes are activated by both GATA-1 and A/as2 enhancer at the protein and mRNA levels. 11 proteins activated by GATA-1/A/as2 enhancer are shown in volcano plots. Est = β-estradiol.
The GATA-1-regulated sector of the erythroblast proteome was determined by comparing uninduced (undifferentiated) and β-estradiol-treated (differentiated) wild type G1E-ER-GATA-1 cell proteomes (Figure 1B). This analysis revealed 1010 and 1109 GATA-1-upregulated and -downregulated proteins (p < 0.01), respectively (Figure 1C and Table S1). To identify co-regulated mRNAs and proteins, we compared the results with our RNA-seq data (Tanimura et al., 2016). GATA-1 upregulated and downregulated 594 and 637 mRNAs/proteins, respectively (Table S2).
To establish the heme contribution to GATA-1-regulated and -insensitive proteome sectors, we compared β-estradiol-treated (differentiated) wild type and Alas2-enhancer mutant G1E-ER-GATA-1 cells (Figure 1B). Differentially expressed proteins (>2-fold) conforming to each regulatory mode were parsed into upregulated and downregulated cohorts. Of the Alas2-enhancer-upregulated (195) and -downregulated (265) proteins, 35 and 35, respectively, of the mRNAs were regulated (Figure 1D and Tables S1–S2).
GATA-1/Alas2-enhancer-induced genes and proteins included the erythroid genes Hbb-b1 and Slc4a1 (Figure 1E). GATA-1-mediated repression of the well-characterized repressed genes Gata2 (Grass et al., 2003) and Kit (Munugalavadla et al., 2005) and their encoded proteins was insensitive to Alas2 enhancer mutations. Whereas Bach1 mRNA was induced in β-estradiol-treated WT and double-mutant cells, Bach1 protein increased only in β-estradiol-treated double-mutant cells (Figure 1E), highlighting the post-translational control of Bach1 levels (Zenke-Kawasaki et al., 2007). The prior RNA-seq analysis identified 66 GATA-1/Alas2 enhancer-co-activated genes (Tanimura et al., 2016). Eleven of the encoded proteins [5 hemoglobin subunits, 2 ubiquitination components (Fbxo30 and Ube2o), Srxn1, Kif2a, Tubb2a and the zinc exporter Slc30a1] were GATA-1/Alas2-enhancer-upregulated (Figure 1F). Of the remaining 55 GATA-1/Alas2 enhancer-activated genes, 11 of the encoded proteins did not meet all criteria to be deemed GATA-1/Alas2 enhancer-co-regulated, and 44 were not definitively identified. We also identified nine Alas2-enhancer-repressed mRNAs/proteins out of 637 GATA-1-repressed mRNAs/proteins detected by RNA-seq and proteomics (GATA-1/Alas2-enhancer-repressed mRNAs/proteins, Figure S1B). The percentage of GATA-1/Alas2-enhancer-repressed mRNAs/proteins (9/637=1.4%) was comparable to that of GATA-1/Alas2-enhancer-activated mRNAs/proteins (11/594 = 1.9%).
GATA/heme circuit reconfigures zinc transport machinery during differentiation: evidence for a zinc transporter switch
As the multi-omic analysis revealed essential hemoglobin components and the critical regulator of late-stage erythroid maturation UBE2O (Nguyen et al., 2017), a ubiquitin-conjugating enzyme, we considered whether proteins regulated similarly also have vital roles in erythrocyte biology. The zinc finger transcription factors GATA-1 (Evans and Felsenfeld, 1989; Pevny et al., 1991; Tsai et al., 1989) and KLF1 (Miller and Bieker, 1993; Perkins et al., 1995) control erythrocyte differentiation, and zinc is a critical cofactor of the heme biosynthetic enzyme delta-aminolevulinic acid dehydratase (ALAD) (Mills-Davies et al., 2017). How these factors sense changes in environmental and intracellular zinc and whether alterations in intracellular zinc impact the activity of these proteins are unclear. Zinc transport machinery had not previously been linked to erythrocyte differentiation (or other types of differentiation) or to GATA factor networks.
The mammalian Solute Carrier (SLC) family consists of 9 zinc exporters [Slc30 family, also termed ZnT (Zinc Transporter) family] and 14 zinc importers [Slc39 family, also termed ZIP (Zrt-, Irt-like protein) family] (Lichten and Cousins, 2009). Slc30a1, Slc39a8, and Slc39a10 were detected in erythrocyte membrane fractions (Ryu et al., 2008). The targeted deletion of murine Slc30a1 is embryonic lethal shortly after implantation (Andrews et al., 2004). Slc39a8 deletion is lethal shortly after birth, and although the mutants are severely anemic, no mechanistic analyses were reported (Galvez-Peralta et al., 2012).
Database mining (https://gexc.riken.jp/; http://haemosphere.org/; http://servers.binf.ku.dk/bloodspot/) revealed differential expression of zinc exporters and importers during mouse and human hematopoiesis. To determine which exporters and importers were expressed and regulated, we compared transcriptomes of untreated and β-estradiol-treated G1E-ER-GATA-1 cells. Slc30a1 and Slc39a8 were the most highly expressed exporter and importer, respectively, and both were GATA-1-activated (Figure 2A). qRT-PCR confirmed GATA-1 regulation in two wild type and double-mutant clones (Figure 2B). As Slc30a1, but not Slc39a8, expression declined in heme-deficient double-mutant clones, these genes have shared (GATA-1-induced) and unique regulatory modes.
Figure 2. GATA-1/heme circuit confers expression of the predominant zinc exporter and importer in erythroblasts.
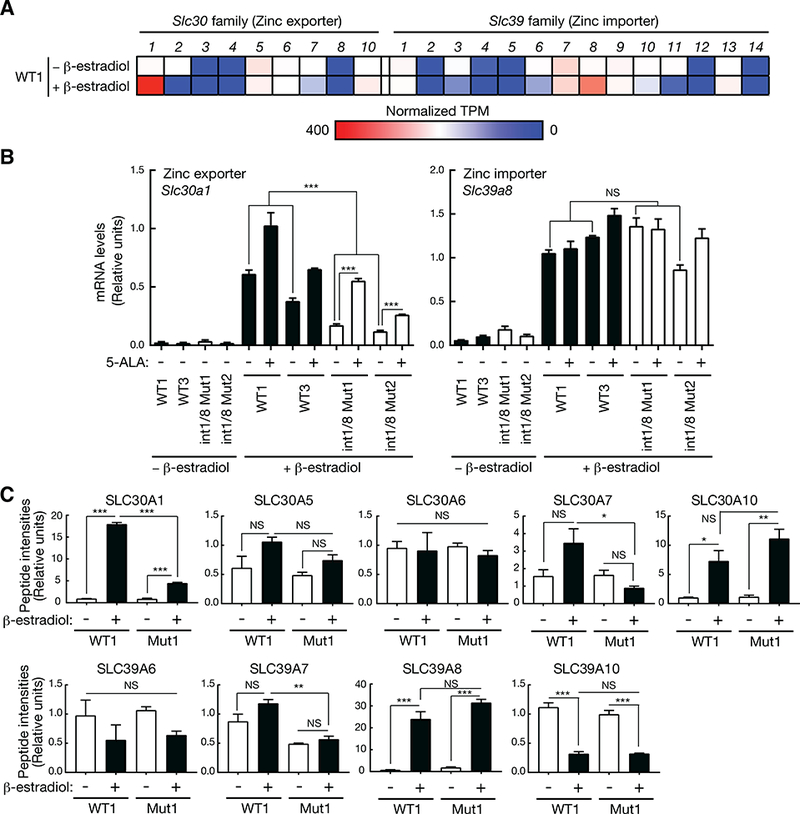
(A) Expression heatmap for zinc exporters (S/c30 family) and importers (S/c39 family) identified by comparing untreated (undifferentiated) and β-estradiol-treated (differentiated) WT G1E-ER-GATA-1 cell transcriptomes.
(B) Real-time RT-PCR analysis of mRNA levels of S/c30a1 and S/c39a8 in two WT and double mutant G1E-ER-GATA-1 clones (n = 4 biological replicates from two independent experiments, mean +/− SE). All values of β-estradiol-treated WT1 and 3 were compared to all values of β-estradiol-treated double mutant 1 and 2 clones. P values were calculated by unpaired two-tailed f-test. *** P < 0.001, NS: not significant.
(C) Peptide intensities of zinc transporter proteins are shown (n = 3 biological replicates from one experiment, mean +/− SE). P values were calculated by one-way ANOVA, followed by Tukey’s test. *P < 0.05, ** P < 0.01, *** P < 0.001, NS: not significant.
See also Figure S2.
In principle, reduced heme may reversibly or irreversibly impact a process, and the Alas2 enhancer mutations might indirectly impact genes sharing the Alas2 subnuclear neighborhood. To rigorously ascribe heme regulation, we used the heme precursor 5-ALA to bypass ALAS-2 function and rescue heme biosynthesis (Tanimura et al., 2016). 5-ALA increased Slc30a1, but not Slc39a8, expression, providing further evidence for differential heme-regulation (Figure 2B). The proteomics analysis detected 5 zinc exporters and 4 importers (Figure 2C). Whereas Slc30a1 was GATA-1/Alas2-enhancer-induced, Slc39a8 was GATA-1-induced, but not Alas2-enhancer-regulated (Figure 2C).
To further dissect mechanisms of GATA-1- and heme-mediated regulation, we tested whether GATA-1 occupies Slc30a1 and Slc39a8 loci and whether functional consequences of occupancy include changes in local chromatin accessibility. GATA-1 occupancy and chromatin accessibility (via ATAC-seq) was analyzed using wild type and heme-deficient double-mutant G1E-ER-GATA-1 cells. ATAC-seq detected multiple sites of accessible chromatin at Slc30a1. ChIP-seq data from G1E-ER-GATA-1, as well as primary mouse and human erythroblasts (mouse Ter119+ and human peripheral blood-derived erythroblasts (PBDE)) (Kang et al., 2012) revealed GATA-1 occupancy at sites 51 and 31kb upstream of Slc30a1 (Figure S2A), which contained conserved GATA motifs (Figure S2B). β-estradiol-induced GATA-1 occupancy increased chromatin accessibility at these sites, suggesting that GATA-1 functions through these sites to regulate Slc30a1 transcription (Figure S2C). Furthermore, GATA-1 occupied the Slc39a8 promoter, which also contained conserved GATA motifs. GATA-1 occupancy at the promoter increased chromatin accessibility (Figures S2A-C). Deletion of the two intronic GATA motifs in Alas2 abrogated chromatin accessibility at these sites in β-estradiol-treated double-mutant cells, indicating that these GATA motifs are required for GATA-1-induced chromatin accessibility (Figures S2A and C). In heme-deficient double-mutant cells, chromatin accessibility decreased, in comparison with wild type cells, at all Slc30a1 sites (−53 kb, −51 kb, −31 kb, −26 kb, and promoter), but not at the Slc39a8 promoter (Figure S2C). Thus, heme activity to amplify GATA-1-mediated activation of Slc30a1 transcription involved heme-instigated chromatin opening. By contrast, GATA-1-mediated activation of the heme-insensitive gene Slc39a8 did not involve heme-dependent alterations in chromatin accessibility. This analysis provides further evidence for a mechanism in which direct GATA-1 target genes are either sensitive or insensitive to intracellular heme levels, and heme integrates into GATA-1 function by enhancing chromatin accessibility at select GATA-1 occupancy sites.
We asked whether the zinc transporter genes Slc30a1 and Slc39a8 that share GATA-1 regulation and differ in heme regulation are controlled similarly in primary cells. Lineage-depleted hematopoietic precursors from E14.5 murine fetal livers were cultured for 72 hours, and flow cytometry was used to isolate cell populations based on erythroid surface marker (CD71 and Ter119) expression (Figure 3A) (McIver et al., 2014; McIver et al., 2016; Zhang et al., 2003). Hbb-b1 expression increased as immature erythroid precursors (R1) matured into terminally differentiated reticulocytes and erythrocytes (R4/5) (Figure 3B, left). Whereas Slc30a1 expression also increased, Slc39a8 increased during the initial differentiation, but was downregulated thereafter (Figure 3B, right). Analysis of all zinc exporters and importers indicated that Slc30a1 was the predominant zinc exporter expressed in murine orthochromatic erythroblasts, while Slc39a8 was the predominant importer expressed in immature proerythroblasts (Figure S3).
Figure 3. A zinc transporter switch during primary mouse and human erythroid differentiation.
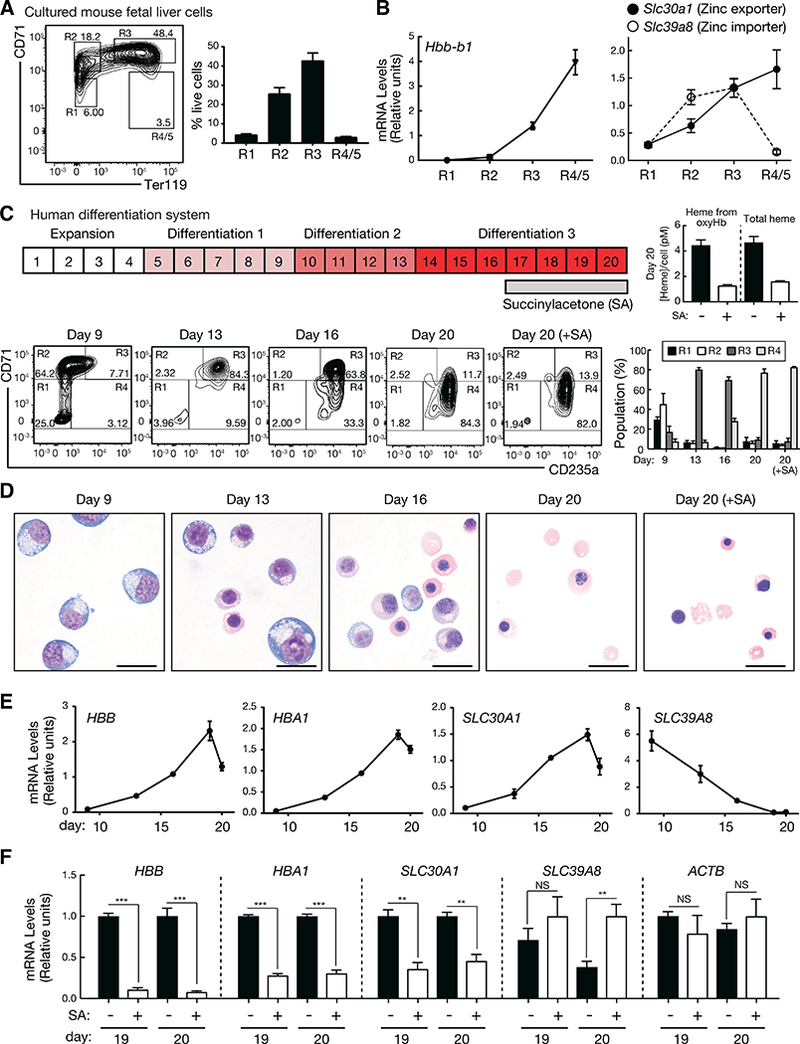
(A) Representative flow cytometric plots of CD71 and Ter119 from lineage-negative cells isolated from E14.5 fetal livers and cultured for 3 days. The percentage of each population was shown (n = 6 biological replicates from two independent experiments, mean +/− SE).
(B) Relative expression of Hbb-b1, Slc30a1, and Slc39a8 in each population (n = 6 biological replicates from two independent experiments, mean +/− SE).
(C) Schematic diagram for differentiation of human mononuclear cells from G-CSF-mobilized peripheral blood. Representative flow cytometric plots of CD71 and CD235a, and the percentage of each population at each stage were shown (n = 4 biological replicates from two independent experiments, mean +/− SE). Concentration of heme per cell treated with or without succinylacetone (SA) at day 20 was quantitated (n = 2 biological replicates from one experiment, mean +/− SD).
(D) Representative photomicrographs of Wright-Giemsa staining of cells treated with or without SA. Scale bar, 20 μm.
(E) Relative expression of HBB, HBA1, SLC30A1, and SLC39A8 during differentiation (n = 4 biological replicates from two independent experiments, mean +/− SE).
(F) Relative expression of HBB, HBA1, SLC30A1, SLC39A8, and ACTB with SA treatment in comparison with no treatment at day 19 and 20 (n = 4 biological replicates from two independent experiments, mean +/− SE). P values were calculated by unpaired two-tailed f-test. ** P < 0.01, *** P < 0.001, NS: not significant.
See also Figures S3 and S4.
To test whether the zinc transporter expression pattern is evolutionarily conserved, we utilized a human system (Lee et al., 2015) in which mononuclear cells from G-CSF-mobilized peripheral blood are cultured for four days and subjected to erythroid differentiation for 16 days (Figure 3C). The erythroid maturation stage was quantified by flow cytometry with CD71 and CD235a surface markers (Figure 3C, bottom). Wright-Giemsa staining revealed a major increase in mature erythroid cells at days 16 and 20 (Figure 3D). Resembling the globin genes HBB and HBA1, SLC30A1 expression increased 14-fold during differentiation (Figure 3E). SLC39A8 expression declined 59-fold during differentiation (Figure 3E). The early Slc39a8 upregulation detected in murine G1E-ER-GATA-1 cells and fetal liver cells was not evident in the human system, since the day nine human culture already contained R2 and R3 cells, in which SLC39A8 expression would be expected to be high (Figure 3C). Analysis of all zinc exporters and importers revealed SLC30A1 as the predominant zinc exporter expressed in human orthochromatic erythroblasts, and SLC39A8 as the predominant importer expressed in immature proerythroblasts (Figure S3). Thus, the major zinc exporter and importer genes were upregulated early in erythroid differentiation, and the importer was downregulated during terminal differentiation in mouse and human cells.
Using wild type and Alas2 enhancer mutant G1E-ER-GATA-1 cells, we tested whether Slc39a8 downregulation during primary mouse and human erythroid cell differentiation occurs in this system and mechanistically, if this reflects heme accumulation during erythroid maturation. We conducted an extended time-course analysis (beyond the usual 48-hour ER-GATA-1 induction time) to ask whether GATA-1-mediated activation of Slc39a8 is sustained or downregulated (Figure S4). In wild type G1E-ER-GATA-1 cells, Slc30a1 and Hbb-b1 expression was sustained from 72 to 96 hours. By contrast, Slc39a8 expression declined from 72 to 96 hours. In heme-deficient double mutant cells, Slc39a8 expression also declined from 72 to 96 hours. However, 5-ALA treatment, which rescues heme levels in double-mutant cells, decreased Slc39a8 expression at 72 hours. Thus, although heme is not required for the downregulation, heme facilitates downregulation. Since heme accumulates upon erythroid maturation and promotes degradation of the repressor Bach1 through the ubiquitin-proteasome system, Bach1 is not expressed in maturing erythroid cells in which Slc39a8 downregulation occurs. Thus, Bach1 is not responsible for the late reduction in Slc39a8 expression.
To determine if SLC30A1 is heme-regulated in the human system, we used the heme biosynthesis inhibitor succinylacetone (Lindblad et al., 1977) to reduce heme during the last four days of culture, which did not impact cellularity (Figures 3C and D). Succinylacetone decreased heme in oxyhemoglobin and total heme 3.4- and 2.9-fold, respectively, (Figure 3C, right) and reduced SLC30A1 expression, as well as other heme-dependent GATA-1 target genes HBB and HBA1 (Tanimura et al., 2016) (Figure 3F). ACTB, encoding β-actin, was unaffected (Figure 3F). These primary mouse and human cell studies revealed an evolutionarily conserved mechanism to differentially control zinc transporter genes during erythroid differentiation, culminating in a switch from importer and exporter expression to solely exporter expression.
Establishing/maintaining zinc levels as a new paradigm of regulating cellular differentiation
The GATA-1-regulation and differential heme-regulation of Slc30a1 and Slc39a8 suggested that intracellular zinc may constitute a previously unrecognized mechanism to control erythroid differentiation. To determine how the GATA/heme-instigated circuit involving a zinc transporter switch impacts zinc levels during erythroid maturation, we used the fluorescent zinc indicator FluoZin-3 (Haase et al., 2006). Using a flow cytometric assay with uncultured E14.5 murine fetal liver cells, we quantified zinc, CD71 and Ter119 (Figures 4A and B). Ter119+ cells were analyzed by gating for CD71highFSC-Ahigh (immature, large erythroblasts), CD71highFSC-Alow (more mature erythroblasts), and CD71lowFSC-Alow (mature erythroblasts, reticulocytes, and erythrocytes) populations. The FluoZin-3 signal increased 8.4-fold during early maturation and decreased 70-fold thereafter (Figure 4B), as predicted by the zinc transporter switch, in which expression of the zinc exporter and importer was sustained and decreased, respectively, during terminal differentiation. Similarly, in uncultured bone marrow, the FluoZin-3 signal increased 3-fold during early erythroblast maturation and decreased 77-fold in more mature erythroblasts (Figures 4C and D). The rise in intracellular zinc during initial erythroid maturation, followed by a steep decline during terminal differentiation, was recapitulated in the primary human erythroblast culture system (Figures 4E and S5A).
Figure 4. The zinc transporter switch dynamically controls intracellular zinc during erythroid maturation.
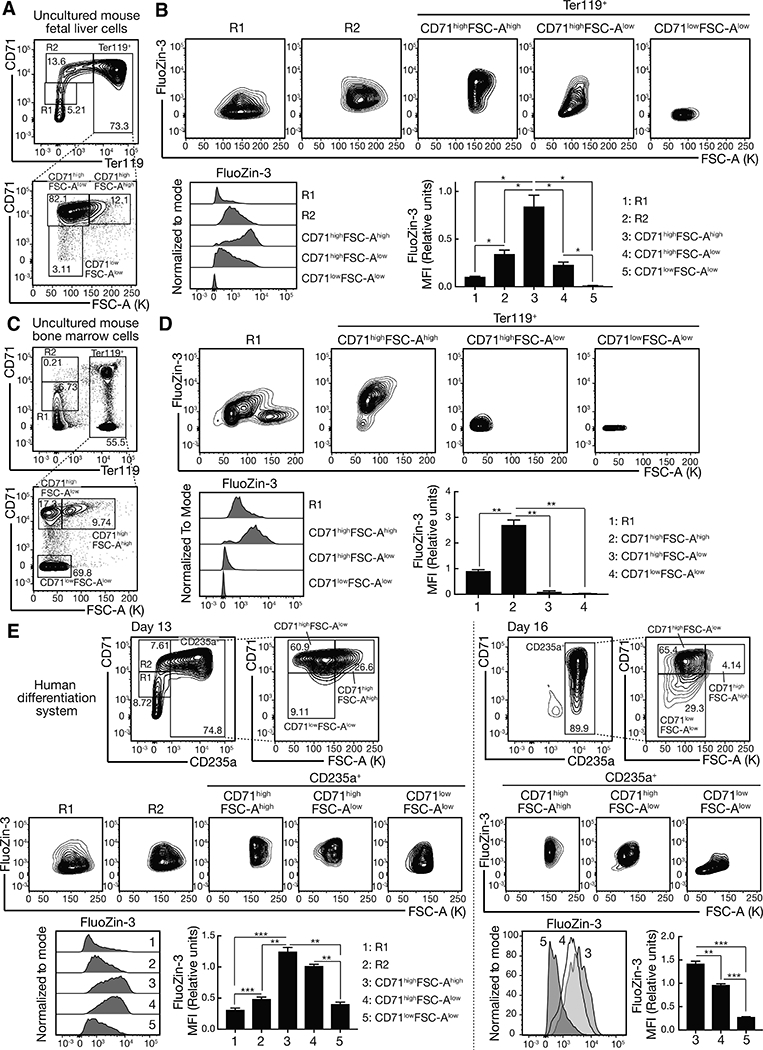
(A) Representative flow cytometric plots of CD71, Ter119 and FSC-A from uncultured E14.5 fetal liver cells.
(B) Representative flow cytometric plots of FluoZin-3 and FSC-A and histograms of FluoZin-3 in each population. Quantitation of FluoZin-3 MFI (Median Fluorescence Intensity) in each population (n = 4 biological replicates from two independent experiments, mean +/− SE). P values were calculated by repeated-measures one-way ANOVA, followed by Tukey’s test. *P < 0.05.
(C) Representative flow cytometric plots of CD71, Ter119 and FSC-A from uncultured bone marrow cells.
(D) Representative flow cytometric plots of FluoZin-3 and FSC-A and histograms of FluoZin-3 in each population. FluoZin-3 MFI in each population was quantitated (n = 4 mice from two independent experiments, mean +/− SE). P values were calculated by repeated-measures one-way ANOVA, followed by Tukey’s test. **P < 0.01.
(E) Representative flow cytometric plots of CD71, CD235a, and FSC-A from differentiated human mononuclear cells from G-CSF-mobilized peripheral blood at day 13 and 16. Representative flow cytometric plots of FluoZin-3 and FSC-A and histograms of FluoZin-3 in each population are shown. FluoZin-3 MFI in each population was quantified (n = 4 biological replicates from two independent experiments, mean +/− SE). P values were calculated by repeated-measures one-way ANOVA, followed by Tukey’s test. **P < 0.01, *** P < 0.001.
See also Figure S5A.
To analyze the consequences of the progressive rise in intracellular zinc, prior to the zinc transporter switch, we used the zinc chelator TPEN to reduce zinc levels in a culture of lineage-negative fetal liver-derived hematopoietic precursors (Figures 5A and B). TPEN reduced intracellular zinc levels in erythroid precursors of varying maturation stage (Figure 5C) and considerably decreased the live cell population (Figure 5D). TPEN decreased the percentage of cells with the highest intracellular zinc levels (R2 and CD71highFSC-Ahigh) (Figure 5E), and adding ZnCl2 to the media negated the actions of TPEN (Figures 5B-E). Intracellular zinc positively correlated with sensitivity to TPEN-induced cell killing (Figure 5F), thus supporting a model in which GATA-1-mediated induction of the zinc importer Slc39a8 elevates intracellular zinc as a novel survival mechanism.
Figure 5. Zinc-dependent cellular survival mechanism.
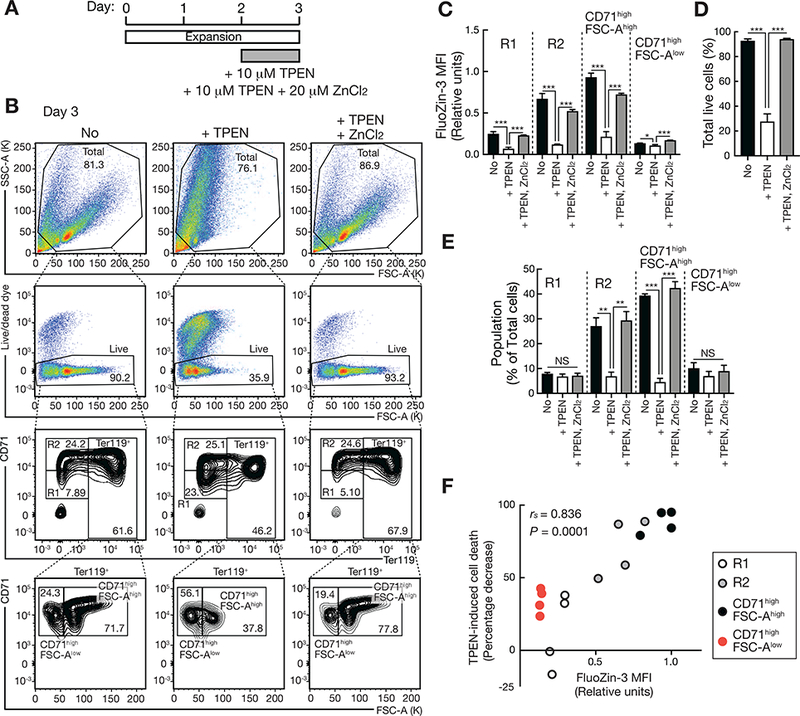
(A) Schematic of the experiments using the zinc chelator TPEN and ZnCl2.
(B) Representative flow cytometric plots of FSC-A, SSC-A, Live/dead dye, CD71, and Ter119 at day 3.
(C) Quantitation of FluoZin-3 MFI in each population of untreated and TPEN- or TPEN/ZnCl2-treated cells. P values were calculated by one-way ANOVA followed by Tukey’s test (n = 4 biological replicates from two independent experiments, mean +/− SE). *P < 0.05, *** P < 0.001.
(D) Quantitation of total live populations of untreated and TPEN- or TPEN/ZnCl2-treated cells. P values were calculated by one-way ANOVA followed by Tukey’s test (n = 4 biological replicates from two independent experiments, mean +/− SE). *** P < 0.001.
(E) The percentage of R1, R2, CD71highFSC-Ahigh, and CD71highFSC-Alow populations in untreated and TPEN- or TPEN/ZnCl2-treated cells. P values were calculated by one-way ANOVA followed by Tukey’s test (n = 4 biological replicates from two independent experiments, mean +/− SE). ** P < 0.01, *** P < 0.001, NS: not significant.
(F) Spearman rank correlation between intracellular zinc levels and sensitivity to TPEN-induced cell death represented as percentage decrease of each population caused by TPEN treatment. Each symbol represents one biological replicate (n = 4 biological replicates from two independent experiments). rs: Spearman’s rank correlation coefficient.
To test whether reconfiguring the mechanism governing intracellular zinc impacts differentiation and to elucidate Slc30a1 and Slc39a8 function, we conducted shRNA-based loss-of-function analyses. Lineage-negative hematopoietic precursors from fetal livers (E14.5) were expanded for two days or were expanded and then differentiated for three days. Cells were infected with retroviruses expressing shRNAs targeting Slc30a1, or Slc39a8 (Luciferase as a control), which downregulated Slc30a1 and Slc39a8 mRNA 73 and 86%, respectively, at day two and 65 and 71% at day five (Figure 6A). The Slc30a1 loss did not impact Slc39a8 mRNA levels and vice versa. The high- and low-zinc populations in the cells expressing each shRNA decreased and increased, respectively, during differentiation (Figure 6B). Cells were expanded for two days, CD71 and Ter119 were quantified, and populations were analyzed by gating for R1 (immature erythroblast), R2 (proerythroblast), and R3 (early and late basophilic erythroblasts) populations. The Ter119+ population generated by differentiation at day 5 included CD71highFSC-Ahigh, CD71highFSC-Alow and CD71lowFSC-Alow populations (Figure 6C). Flow cytometric analysis of control cells expanded for two days revealed a 5.6-fold increase in intracellular zinc as R1 differentiated into R3 (Figure S5B). At day five, zinc was 2.8-fold higher in less mature CD71highFSC-Ahigh cells relative to the other populations (Figure S5B). These results resembled those with uncultured cells (Figures 4A and B).
Figure 6. Corrupting zinc regulation promotes erythroid differentiation.
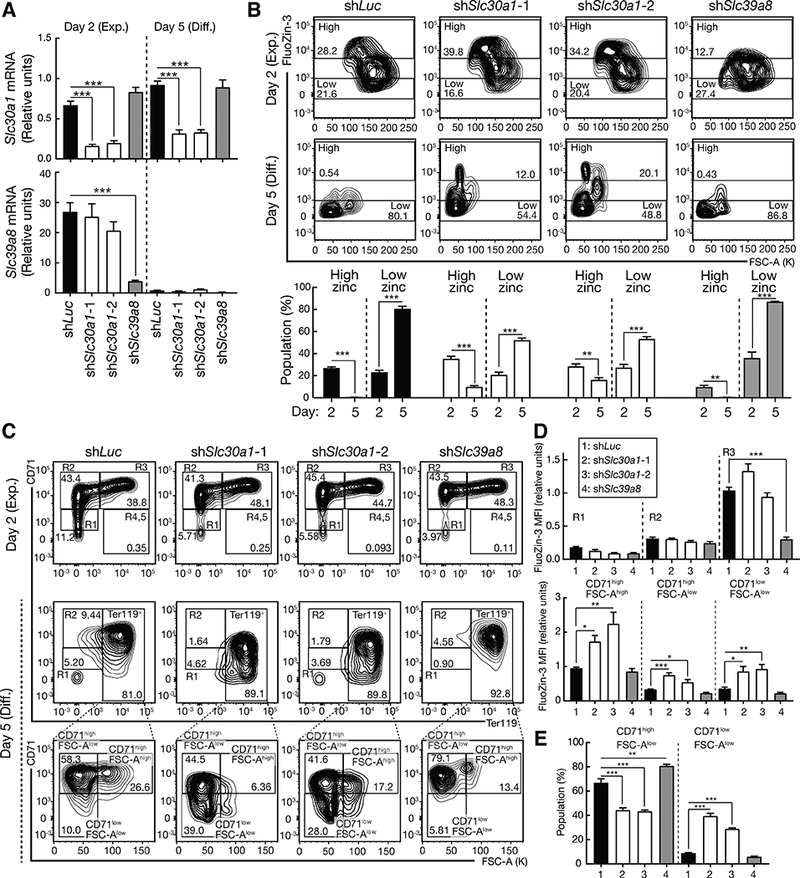
(A) Slc30a1 and Slc39a8 knockdown in lineage-negative fetal liver hematopoietic precursors (E14.5) expanded for 2 days or expanded for 2 days and then differentiated for 3 days (n = 4 biological replicates from two independent experiments, mean +/− SE). P values were calculated by one-way ANOVA followed by Dunnett’s test (n = 4 biological replicates from two independent experiments, mean +/− SE). *** P < 0.001.
(B) Representative flow cytometric plots of FluoZin-3 and FSC-A in Slc30a1- or Slc39a8-knockdown lineage-negative hematopoietic precursors expanded for 2 days (day 2) or expanded for 2 days and then differentiated for 3 days (day 5). The percentage of high- and low-zinc populations at day 2 and 5 were shown (n = 4 biological replicates from two independent experiments, mean +/− SE). P values were calculated by unpaired two-tailed f-test. ** P < 0.01, *** P < 0.001.
(C) Representative flow cytometric plots of CD71, Ter119, and FSC-A at day 2 and 5.
(D) Quantitation of FluoZin-3 MFI in each population of control and Slc30a1- or Slc39a8-knockdown cells at day 2 (top) and day 5 (bottom) were performed. P values were calculated by one-way ANOVA followed by Dunnett’s test (n = 4 biological replicates from two independent experiments, mean +/− SE). *P < 0.05, ** P < 0.01, *** P < 0.001.
(E) The percentage of CD71highFSC-Alow and CD71lowFSC-Alow populations in control and Slc30a1- or S/c39a8-knockdown cells. P values were calculated by one-way ANOVA followed by Dunnett’s test (n = 4 biological replicates from two independent experiments, mean +/− SE). ** P < 0.01, *** P < 0.001.
See also Figures S5B, S6, and S7.
In expansion culture, Slc39a8 downregulation decreased intracellular zinc 3.3-fold in R3 cells (Figure 6D, top), demonstrating Slc39a8 function to establish and/or maintain intracellular zinc levels in immature erythroblasts. Whereas Slc30a1 mRNA decreased by 73% in the knockdown cells, the downregulation did not impact intracellular zinc in these cells in which intracellular zinc was already high (Figure 6D, top).
In an erythroid differentiation culture, Slc30a1 downregulation increased intracellular zinc in all populations. In this context, Slc39a8 downregulation had no effect (Figure 6D, bottom). Thus, Slc30a1 establishes and/or maintains intracellular zinc in more mature erythroblasts.
Within Ter119+ populations, Slc30a1 loss increased intracellular zinc 2.2-fold, decreased the percentage of CD71highFSC-Alow population 1.5-fold and increased the percentage of the more mature CD71lowFSC-Alow population 3.9-fold. Strikingly, the terminally differentiated CD71lowFSC-Alow population constituted 35% of the total Ter119+ population (Figure 6E). Downregulating Slc39a8 did not alter zinc in the more mature populations (Figure 6D, bottom) and did not impact cellularity (Figure 6E). Thus, corrupting the zinc exporter mechanism that restricts intracellular zinc in more mature erythroblasts increases intracellular zinc and promotes differentiation.
To further analyze how reconfiguring zinc transport machinery impacts differentiation, we used the DNA- and RNA-binding dye thiazole orange (TO) to discriminate between nucleated erythroblasts and enucleated progeny (Dumitriu et al., 2006) (Figure S6A). Slc30a1 downregulation decreased the percentage of CD71highTOhigh population (nucleated erythroblasts) 2.3-fold, while increasing the percentage of CD71lowTOhigh (more mature nucleated erythroblasts) and CD71lowTOlow (enucleated reticulocytes and erythrocytes) cells 2.5 and 4.8-fold, respectively (Figures S6B-D). Slc39a8 downregulation did not influence the cell populations.
Our results demonstrate that Slc30a1 downregulation increases intracellular zinc and promotes terminal differentiation. As an alternative approach that does not rely upon shRNA expression to further evaluate this mechanism, we used the zinc chelator TPEN to deprive terminally differentiating primary erythroid cells (from lineage-negative fetal liver-derived hematopoietic precursors) of zinc (Figures S7A and B). Since shRNA-mediated Slc30a1 downregulation increased zinc and accelerated terminal differentiation, we reasoned that zinc deprivation would restrict differentiation. TPEN reduced intracellular zinc (Figure S7C), increased the percentage of CD71highFSC-Alow population cells and decreased the percentage of the more mature CD71lowFSC-Alow population cells (Figure S7D). Adding ZnCl2 to the media rescued the TPEN inhibitory activity (Figures S7B-D). These results confirm the concept derived from the exporter knockdown analysis (Figure 6E) and provide further evidence that zinc is an important determinant of terminal erythroid maturation. The decline in intracellular zinc during late-stage differentiation restricts terminal differentiation, while ectopically elevated zinc accelerates terminal differentiation.
In aggregate, these results establish a paradigm in which GATA-1 induces a zinc importer that increases intracellular zinc early in erythroid differentiation to confer cell survival. As differentiation proceeds and heme increases, heme amplifies GATA-1-dependent induction of a zinc exporter, and importer expression declines. This GATA/heme-instigated zinc transporter switch expels intracellular zinc. As downregulating the exporter elevates intracellular zinc and accelerates terminal differentiation, and chelating zinc lowers intracellular zinc and restricts terminal differentiation, these further support a paradigm in which a GATA/heme/zinc circuit is a vital determinant of erythrocyte development.
DISCUSSION
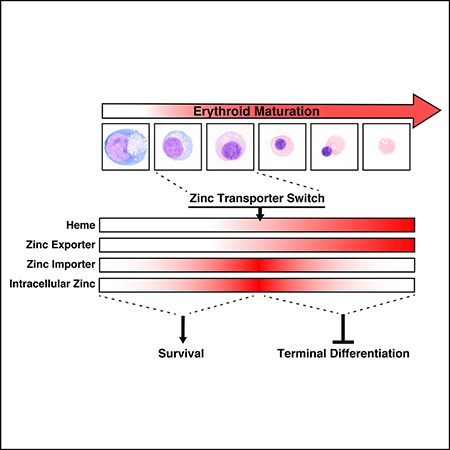
Here, we developed a GATA/heme multi-omics resource that enabled the discovery of a zinc transporter switch and a trace metal-dependent cellular differentiation mechanism. Whereas trace metals are critical nutritional constituents, many questions remain regarding their requirements and mechanisms in fundamental aspects of cell regulation. We provide evidence for an evolutionarily conserved GATA/heme-dependent mechanism that dynamically regulates intracellular zinc during erythrocyte differentiation (Figure 7). GATA-1 activates expression of the predominant zinc importer and exporter of the erythroblast. As differentiation proceeds and heme accumulates, heme amplifies GATA-1-dependent exporter induction. Sustained exporter expression with importer loss constitutes a zinc transporter switch that reduces intracellular zinc during terminal differentiation. Corrupting this mechanism by zinc-deprivation compromises erythroblast survival, exporter downregulation elevates intracellular zinc, mimicking the levels of early differentiation, and promotes terminal differentiation, and chelating zinc restricts terminal differentiation. By regulating erythroblast survival and differentiation, the GATA/heme/zinc controls erythrocyte differentiation.
Figure 7. GATA-1/heme-dependent zinc transporter switch controls intracellular zinc as a mechanism governing cellular differentiation.
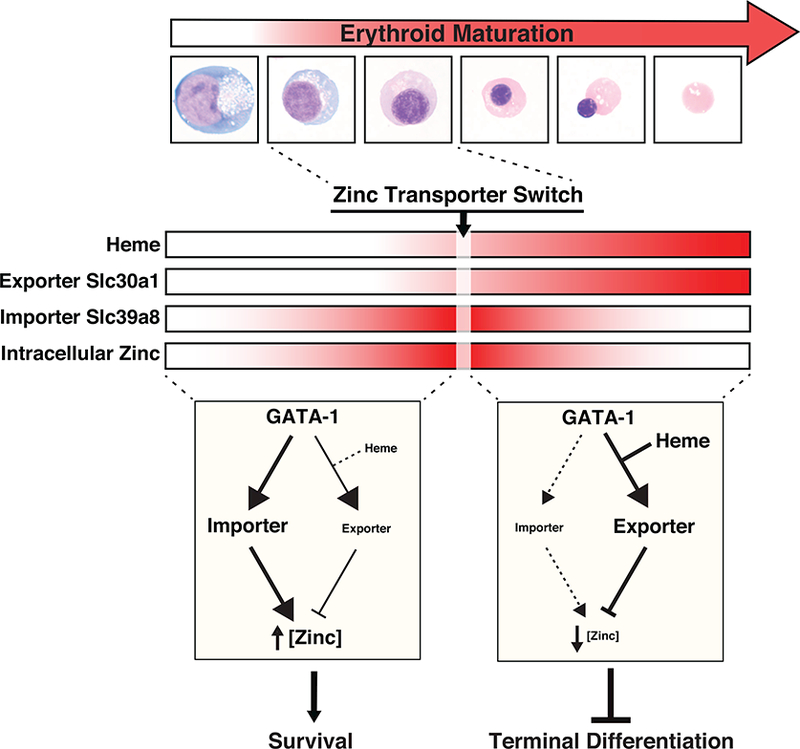
Changes in heme, Slc30a1, Slc39a8 and intracellular zinc levels during erythroid differentiation are depicted as heat maps. The circuits at the bottom illustrate the heme-independent, GATA-1-mediated induction of the zinc importer Slc39a8 early in erythroid differentiation to increase intracellular zinc. Reducing intracellular zinc via chelation severely compromised cell survival. As GATA-1 activates A/as2 transcription, which greatly increases heme, heme amplifies GATA-1 activity to induce the zinc exporter Slc30a1. Subsequently, Slc30a1 expression persists and Slc39a8 expression declines, which we term a zinc transporter switch. This switch is responsible for a steep decline in intracellular zinc during terminal differentiation. Corrupting the switch by downregulating Slc30a1 increases intracellular zinc and promotes terminal differentiation. By decommissioning zinc-dependent pro-differentiation processes, this decline may ensure high fidelity of the final cellular remodeling steps required to form the reticulocyte, while ensuring that precursors are not depleted upon differentiation, thus avoiding anemia. These results support a model in which the transcription factor GATA-1 and the cofactor heme regulate levels of a trace metal to differentially control fundamental activities of erythrocyte precursors - to survive and to differentiate
The essential trace metal zinc has important structural, catalytic and signaling functions (Kambe et al., 2015). Our results raise the question of how the intracellular zinc binding protein ensemble senses intracellular zinc changes, such as those driven by GATA/heme that control differentiation. The key transcriptional regulators of erythrocyte differentiation, GATA-1 and KLF1, contain zinc fingers that mediate sequence-specific DNA binding and/or protein-protein interactions with coregulators (Crispino et al., 1999; Liew et al., 2005), but whether intracellular zinc levels regulate the activities of these transcription factors is unknown. Zinc increases activity of the zinc-finger transcription factor Metal Transcription Factor 1 (MTF-1), which activates transcription of zinc-regulatory genes, including metallothioneins, intracellular zinc-chelating proteins (Gunther et al., 2012). The octameric ALAD heme biosynthesis enzyme contains eight zinc atoms required for enzymatic activity (Mills-Davies et al., 2017). While iron insertion into protoporphyrin IX forms heme physiologically, in iron deficiency, zinc replaces iron to yield zinc protoporphyrin IX. This zinc-containing heme analogue inhibits heme oxygenase, an enzyme that mediates heme catabolism and confers cytoprotection (Labbe et al., 1999).
Since erythroid differentiation involves a progressive increase, and terminal differentiation involves a sharp decline in intracellular zinc, it is of considerable interest to consider how variable zinc levels in differentiating systems impact members of the ensemble of zinc binding proteins (zinc sensors) and, presumably, unknown effectors. It is attractive to propose that the zinc accumulation early in differentiation commissions specific components of the ensemble to confer survival, while the zinc transporter switch decommissions factors that restrict differentiation. This decommissioning may function to balance zinc-stimulated processes early in differentiation with subsequent zinc-inhibited processes required for terminal differentiation. Accordingly, the dynamic regulation of intracellular zinc by GATA/heme is proposed to be a determinant of the precursor/progeny balance that ensures the generation of billions of erythrocytes daily without precursor depletion or inadequate progeny genesis, both of which would yield anemia.
Zinc deficiency in humans can be associated with anemia, is an independent risk factor for anemia in New Zealand children (Houghton et al., 2016) and plasma zinc correlates with hemoglobin levels in pregnant women from southern Ethiopia (Gibson et al., 2008). Although zinc replacement has been deployed with apparent benefits as an anemia treatment in specific contexts (Alarcon et al., 2004; Nishiyama et al., 1999) (Prasad et al., 1999), complexities arise with interpreting such studies, as zinc may exert a panoply of erythroid non-autonomous and cell-autonomous activities. Zinc deficiency in mice reduces erythroid and lymphoid cells, while increasing myeloid cells (King and Fraker, 2002). Acute blood loss, which instigates protective mechanisms, increases bone marrow zinc levels (Huber and Cousins, 1993). In aggregate, the zinc-dependent biochemical processes and correlative studies in humans suggest the precise control of zinc is important for erythrocyte differentiation. However, whether the links between zinc deficiency and anemia, and potential efficacy of zinc replacement reflect direct zinc actions in erythroid cells or non-erythroid-autonomous activities is unclear.
It is instructive to consider if altering the zinc exporter/importer balance impacts differentiation in diverse systems, including cancer cells with differentiation blockades that underlie malignant phenotypes. Furthermore, modulation of the zinc-dependent differentiation mechanism may surmount ineffective erythropoiesis, for example in the context of resistance to erythropoiesis-stimulating agents that can occur in MDS and other pathologies. Leveraging the mechanism to regulate intracellular zinc may have utility to promote terminal erythroid differentiation of pluripotent cells to achieve cell engineering goals for regenerative medicine. The discoveries described herein will enable additional multi-omic and mechanistic analyses to elucidate how the unique GATA/heme/zinc mechanism intermeshes with broader sectors of the metallome, and such studies will unveil further unexplored facets of developmental and cell biology, physiology and pathology, as well as biomedical applications.
STAR Methods
CONTACT FOR REAGENT AND RESOURCE SHARING
Further information and requests for resources and reagents should be directed to and will be fulfilled by the Lead Contact, Emery H. Bresnick (ehbresni@wisc.edu).
EXPERIMENTAL MODEL AND SUBJECT DETAILS
Mice
C57BL/6J mice (The Jackson Laboratory) were used. For analysis of uncultured bone marrow cells, two male and two female mice were used. All animals were handled according to approved institutional animal care and use committee (IACUC) protocols (#M02230) of the University of Wisconsin-Madison. All animal experiments were performed with the ethical approval of the AAALAC International (Association for the Assessment and Accreditation of Laboratory Animal Care) at the University of Wisconsin-Madison.
Cell Lines and Primary Cultures
G1E-ER-GATA-1 cells derived from male murine ES cells were cultured in Iscove’s modified Dulbecco’s medium (IMDM; Gibco) containing 15% FBS (Gemini), 1% penicillin-streptomycin (Gemini), 2 U/ml erythropoietin (Amgen), 120 nM monothioglycerol (Sigma), and 0.6% conditioned medium from a Kit ligand-producing CHO cell line, and 1 mg/ml puromycin (Gemini). ER-GATA-1 activity was induced by adding 1 μΜ β-estradiol (Steraloids) to media. To rescue heme synthesis, 1 mM 5-aminolevulinic acid hydrochloride (5-ALA; Sigma) was added to media. HEK293T cells derived from a female fetus were cultured in DMEM (Corning, 10013CV) containing 10% FBS and 1% penicillin-streptomycin (Gemini).
Primary erythroid precursors from E14.5 murine fetal livers were cultured in StemPro-34 (Gibco) supplemented with 10% nutrient supplement (Gibco), 1× L-glutamine (Cellgro), 1% penicillin-streptomycin (Gemini), 0.1 mM monothioglycerol (Sigma), 1 βM dexamethasone (Sigma), 0.5 U/ml erythropoietin (Amgen), and 1% conditioned medium from a Kit ligand-producing CHO cell line (expansion culture). After two days, cells were differentiated in IMDM (Gibco) □containing 10% FBS (Gemini), 10% plasma-derived serum (PDS; Animal Technologies), 5% protein-free hybridoma medium II (PFHM II; Gibco), 1% penicillin-streptomycin (Gemini), 0.1 mM monothioglycerol (Sigma) and 6 U/ml of erythropoietin (Amgen). To chelate zinc, 10 μM N,N,N’,N’-Tetrakis(2-pyridylmethyl)ethylenediamine (TPEN, Sigma, P4413) was added to the media, and 20 mM ZnCl2 (Fisher Scientific) was added back.
Primary human mononuclear cells were isolated from G-CSF-mobilized peripheral blood using Histopaque (Sigma). Cells were maintained in StemSpan SFEM medium (Stem Cell Technologies) supplemented with 1× CC100 cytokine mix (Stem Cell Technologies) for 4 days. To induce differentiation, cells were cultured in basal differentiation media [IMDM containing 15% FBS, 2 mM L-glutamine, 1% BSA (Sigma), 500 μg/ml holo human transferrin (Sigma), and 10 μg/ml insulin (Sigma)] supplemented with 1 μM dexamethasone (Sigma), 1 μM β-estradiol (Steraloids), 5 ng/ml IL-3, 100 ng/ml SCF, and 6 U/ml erythropoietin (Amgen) for 5 days, followed by four days in basal differentiation media supplemented with 50 ng/ml SCF and 6 U/ml erythropoietin and then seven days in basal differentiation media containing 2 U/ml erythropoietin.
Cells were cultured in a humidified 5% CO2 incubator at 37°C.
METHOD DETAILS
qRT-PCR
Total RNA was purified from 0.4–2 × 10⁶ cells with TRIzol (Life Technologies). RNA was treated with DNase I (Life Technologies) for 15 min at room temperature. DNase I was inactivated by EDTA and heating at 65°C for 10 min. DNase I-treated RNA was incubated with 125 ng of a 5:1 mixture of oligo (dT) primers and random hexamer at 68°C for 10 min. RNA/primers were incubated with Moloney MLV reverse transcriptase (Life Technologies), 10 mM DTT (Life Technologies), RNAsin (Promega), and 0.5 mM deoxynucleoside triphosphates at 42°C for 1 h, and then heat inacti vated at 98°C for 5 min. Real-time PCR reactions were conducted with Power SYBR Green Master Mix (Applied Biosystems) using ViiA 7 Real-Time PCR system (Applied Biosystems). Primer sequences are described in Table S3A.
Heme Quantitation
Cells (2.8–3.9 × 10⁶) from two biological replicates per treatment were resuspended in cold hypotonic buffer (8.1 mM Na2HPO4, pH 7.4, 10 mM NaCl) and lysed via three successive rounds of freezing at −78°C, followed by thawing on ice. Cell lysates were centrifuged at 17,000 × g for 30 min at 4°C, and supernatants were centrifuged at 100,000 × g for 60 min at 4°C. Electronic absorption spectra of cleared lysates were recorded on a Varian Cary 4 Bio spectrophotometer, and the oxyhemoglobin concentration of each cleared lysate was calculated using extinction coefficients at 542 nm and 577 nm for human oxyhemoglobin monomers (Waterman, 1978). Total heme in each cleared lysate was determined for two technical replicates using the pyridine hemochrome assay in which 200 μl of a stock solution of 0.1 N NaOH and 33% (v/v) pyridine was combined with 100 μl of the cleared lysate. Upon addition of 2–5 mg of sodium dithionite, electronic absorption spectra were recorded, and total heme concentrations were calculated using known extinction coefficients of the ferrous bis(pyridine) protoheme complex at 525 nm and 556 nm (Tanimura et al., 2016).
Flow Cytometry
For intracellular zinc quantitation in mouse cells, cells were washed twice with PBS and incubated with 1 μl/ml Ghost Dye Red 780 (TONBO biosciences) for 30 min at 4°C. Cells were washed once with PBS containing 2% FBS and twice with HBSS, and treated with HBSS containing 1 μM FluoZin-3 AM (Invitrogen), 0.02% Pluronic F-127 (Invitrogen), BV421-conjugated anti-mouse CD71 (0.2 μg in 100 μl, Biolegend, 113813), and APC-conjugated anti-mouse Ter119 (0.2 μg in 100 μl, Biolegend, 116212) for 30 min at room temperature. Cells were washed once with HBSS and incubated for 15 min at room temperature. Cells were then washed twice with PBS and analyzed. To distinguish enucleated cells from nucleated erythroblasts, cells stained with Ghost Dye Red 780 were incubated with 2 μg/ml thiazole orange (Sigma, 390062) in PBS for 40 min at room temperature. Cells were washed once with PBS and stained with BV421-conjugated anti-mouse CD71 and APC-conjugated anti-mouse Ter119 for 30 min at 4°C. Cells were then washed twice with PBS and analyzed. For intracellular zinc quantitation in human cells, cells were washed twice with HBSS and incubated with HBSS containing 1 μM FluoZin-3 AM, 0.02% Pluronic F-127, PE-conjugated anti-human CD71 (0.024 μg in 100 μl, eBioscience, 12–0719-42), and APC-conjugated anti-human CD235a (0.006 μg in 100 μl, eBioscience 17–9987-42) for 30 min at room temperature. Cells were washed once with HBSS and incubated for 15 min at room temperature. Cells were then washed twice with PBS, stained with DAPI, and analyzed. Samples were analyzed using a BD LSR II (BD Biosciences).
Primary Murine Erythroid Precursor Cell Isolation
E14.5 murine fetal liver cells were incubated with biotin-conjugated anti-mouse CD3𝛆 3 ml/ml, Biolegend, 100304), anti-mouse/human CD11b (3 ml/ml, Biolegend, 101204), anti-mouse CD19 (3 μl/ml, Biolegend, 115504), anti-mouse/human CD45R (3 μl/ml, Biolegend, 103204), anti-mouse GR-1 (3 μl/ml, Biolegend, 108404), anti-mouse CD71 (3 μl/ml, Biolegend, 113803), and anti-mouse Ter119 (5 ml/ml, Biolegend, 116204) for 15 min at 4°C. Cells were washed with PBS containing 2% FBS, 2.5 mM EDTA, and 10 mM glucose. Cells were incubated with MojoSort Streptavidin Nanobeads (75 μl/ml, Biolegend, 480016) for 15 min at 4°C. Cells were washed with P BS containing 2% FBS, 2.5 mM EDTA, and 10 mM glucose. Cells were resuspended in 3 ml PBS containing 2% FBS, 2.5 mM EDTA, and 10 mM glucose and incubated for 6 min with a magnet. Unbound cells were collected.
shRNA-mediated Knockdown
shRNAs were cloned into MSCV-PIG vector (from Dr. Mitchell Weiss) using Bgl II and Xho I sites. Sequences of oligonucleotides used to construct shRNA plasmids are described in Table S3B. shRNA-PuroR-IRES fragment was ligated into pMSCV-IRES-mCherry FP (Addgene, #52114) using Bgl II and Nco I sites. 293T cells transfected with 15 μg of pMSCV-PuroR-IRES-mCherry vector and pCL-Eco packaging vector produced retrovirus expressing shRNA. Cells were added to 100 μl viral supernatant, polybrene (8 mg/ml), and HEPES buffer, and spinoculated at 2,600 rpm for 90 min at 30°C.
Preparing Microscope Slides
0.5 × 10⁵ (less mature cells) or 4 × 10⁵ cells (more mature cells) in 200 μl PBS were centrifuged at 280 rpm or 250 rpm, respectively, for 10 min using cytospin. The slides were stained with Wright-Giemsa Stain (Sigma, WG16–500ML).
Quantitative Proteomics
Cell samples were suspended in 100 μl guanidinium chloride (6 M) and homogenized with a cup horn sonicator (Qsonica) until fully in solution. Protein was precipitated in 900 μl methanol and pelleted (5,000 × g, 15 min). Pellets were resuspended in 500 μl lysis buffer (8 M urea, 100 mM tris pH 8, 10 mM TCEP, 40 mM 2-chloroacetamide) and diluted to >1.5 M urea with 50 mM tris pH 8. Trypsin was added (1:50::g:g) and incubated overnight at ambient temperature with gentle rocking. Additional trypsin (1:200:g:g) was added in the morning and after an additional hour, peptides were isolated and desalted with StrataX polymeric reverse phase resin (Phenomenex). Peptide yield was calculated by bicinchoninic acid (BCA) assay (Thermo Pierce). Samples were resolved with an Acquity BEH C18 reverse phase column at 60°C (130 Å pore size, 1.7 μm particle size, 2.1 × 100 mm, Waters Corp) using a 1260 Infinity liquid chromatograph (600 μl/min flow rate, Thermo Scientific). Mobile phase A consisted of 20 mM ammonium bicarbonate in H2O. Mobile phase B consisted of 20 mM ammonium bicarbonate in ACN/H2O. Elution was achieved with a gradient, and 8 fractions were collected from 5–23 min with concatenation of fraction 1 and 9, 2 and 10,...8 and 16. Concentrated fractions of sample four were resuspended in 16 μl 0.2% formic acid. All other samples were resuspended to 1 μg/ml. Each sample (2 μl) was analyzed on a Q-LTQ-OT mass spectrometer (Thermo Scientific Fusion Lumos) following LC separation. Injections were made onto a 75–360 μm inner-out diameter fused silica capillary column with a laser-pulled electrospray tip packed with BEH C18 (130A pore, 1.7 μm particle size, 35 cm, Waters Corp) with a Dionix Ultimate 3000 uHPLC. Peptides were resolved on a gradient, and eluted peptides entered the mass spectrometer following positive mode electrospray ionization. MS1 survey scans were performed in the orbitrap (240K resolution, AGC target - 1e6, 50 ms max injection time). MS2 analysis of HCD-generated (30% NCI) fragment ions were performed in the ion trap (turbo resolution, AGC target - 3e4, 11 ms max injection time). Monoisotopic precursor selection and dynamic exclusion (15 s) were enabled. Thermo RAW files were processed with the MaxQuant quantitative software suite. Searches were performed with precursor mass tolerance of 50 ppm and product ion mass tolerance of 0.2 Da. Carbamidomethylation of cysteines was imposed as a fixed modification. Oxidation of methionines was set as a variable modification. ‘Match between runs’ and ‘label free quantitation’ were enabled using a match time window of 0.7 min and minimum ratio count of 1. Search results were filtered to a false discovery rate of 1%.
ATAC-seq
ATAC-seq was performed as previously described with modifications (Liu et al., 2017). Specifically, 5 × 10⁴ cells were washed twice in PBS and resuspended in 500 μl cell lysis buffer (10 mM Tris-HCl, 10 mM NaCl, 3 mM MgCl2, 0.1% NP-40, pH 7.4). Nuclei were harvested by centrifuge at 500 × g for 10 min at 4°C, resuspended in 50 μl of tagmentation mix (10 mM TAPS (Sigma), 5 mM MgCl2, pH 8.0 and 2.5 μl Tn5), and incubated at 37°C for 30 min. Tagmentation was terminated by incubating nuclei at room temperature for 2 min followed by adding 10 μl of 0.2% SDS and incubation at 55°C for 7 min. Tn5 transposase-tagged DNA was purified using QIAquick MinElute PCR Purification kit (Qiagen), amplified using KAPA HiFi Hotstart PCR Kit (KAPA), and sequenced on an Illumina Nextseq500 system using the 75 bp high output sequencing kit. After sequencing, ATAC-seq raw reads were trimmed to remove adaptor sequence and aligned to mouse (mm9) genome assembly using Bowtie2 (Langmead et al., 2009) with default parameters. Only tags that uniquely mapped to the genome were used for further analysis.
QUANTIFICATION AND STATISTICAL ANALYSIS
No data were excluded from the analysis. Enumeration of nucleated and enucleated erythroblasts was conducted by a blinded analysis. All attempts of replication were successful. Representative images from the experiments are shown. Exact numbers of sample sizes and independent experiments are stated in the corresponding figure legends. Data are presented as stated in the respective figure legends. Statistical analyses were performed with GraphPad Prism 7. To compare the difference between two groups, unpaired or paired two-tailed t-tests were performed. For multiple comparisons, one-way ANOVA was conducted with Dunnett’s test or Tukey’s test.
DATA AND SOFTWARE AVAILABILITY
The accession number for the ATAC-seq data is GEO: GSE114996.
Supplementary Material
Table S1. GATA-1- and Alas2-enhancer-regulated proteins detected by proteomics, Related to Figure 1.
Table S2. GATA-1- and Alas2-enhancer-regulated genes detected by proteomics and RNA-seq, Related to Figure 1.
Figure S1. Principle component analysis of the proteomes and GATA-1/Alas2-enhancer-repressed mRNAs/proteins, Related to Figure 1.
Figure S2. Mechanistic dissection of GATA-1/heme-regulated gene expression, Related to Figure 2.
Figure S3. Expression levels of all Slc30 (zinc exporter) and Slc39 (zinc importer) family members in mouse and human proerythroblasts and orthochromatic erythroblasts, Related to Figure 3.
Figure S4. Slc39a8 downregulation during erythroid maturation of wild type and Alas2 enhancer-mutant G1E-ER-GATA-1 cells, Related to Figure 3.
Figure S5. Increased and decreased intracellular zinc during cultured primary human and mouse erythroblast maturation, Related to Figures 4 and 6.
Figure S6. Intracellular zinc as a determinant of terminal differentiation, Related to Figure 6.
Figure S7. Reducing intracellular zinc restricts terminal differentiation, Related to Figure 6.
Table S3. Primers for RT-qPCR and oligonucleotides for construction of shRNAplasmids, Related to STAR Methods.
HIGHLIGHTS.
Multi-omic analysis yields resource for exploring erythrocyte development regulation
GATA-1/heme induce a zinc transporter switch that controls intracellular zinc levels
Zinc confers erythroblast survival
Decreased zinc restricts and increased zinc promotes terminal differentiation
ACKNOWLEDGMENTS
This work was funded by National Institutes of Health grant DK50107 to E.H.B. and by the Carbone Cancer Center P30CA014520. The mass spectrometry work was supported by the NIGMS National Center for Quantitative Biology of Complex Systems, GM108538.
Footnotes
DECLARATION OF INTERESTS
The authors declare no competing interests.
Publisher's Disclaimer: This is a PDF file of an unedited manuscript that has been accepted for publication. As a service to our customers we are providing this early version of the manuscript. The manuscript will undergo copyediting, typesetting, and review of the resulting proof before it is published in its final citable form. Please note that during the production process errors may be discovered which could affect the content, and all legal disclaimers that apply to the journal pertain.
REFERENCES
- Alarcon K, Kolsteren PW, Prada AM, Chian AM, Velarde RE, Pecho IL, and Hoeree TF (2004). Effects of separate delivery of zinc or zinc and vitamin A on hemoglobin response, growth, and diarrhea in young Peruvian children receiving iron therapy for anemia. Am J Clin Nutr 80, 1276–1282. [DOI] [PubMed] [Google Scholar]
- An X, Schulz VP, Li J, Wu K, Liu J, Xue F, Hu J, Mohandas N, and Gallagher PG (2014). Global transcriptome analyses of human and murine terminal erythroid differentiation. Blood 123, 3466–3477. [DOI] [PMC free article] [PubMed] [Google Scholar]
- Andrews GK, Wang H, Dey SK, and Palmiter RD (2004). Mouse zinc transporter 1 gene provides an essential function during early embryonic development. Genesis 40, 74–81. [DOI] [PubMed] [Google Scholar]
- Campagna DR, de Bie CI, Schmitz-Abe K, Sweeney M, Sendamarai AK, Schmidt PJ, Heeney MM, Yntema HG, Kannengiesser C, Grandchamp B, et al. (2014). X-linked sideroblastic anemia due to ALAS2 intron 1 enhancer element GATA-binding site mutations. Am J Hematol 89, 315–319. [DOI] [PMC free article] [PubMed] [Google Scholar]
- Cotter PD, Rucknagel DL, and Bishop DF (1994). X-linked sideroblastic anemia: identification of the mutation in the erythroid-specific delta-aminolevulinate synthase gene (ALAS2) in the original family described by Cooley. Blood 84, 3915–3924. [PubMed] [Google Scholar]
- Cox J, and Mann M (2008). MaxQuant enables high peptide identification rates, individualized p.p.b.-range mass accuracies and proteome-wide protein quantification. Nat Biotechnol 26, 1367–1372. [DOI] [PubMed] [Google Scholar]
- Cox TC, Bawden MJ, Martin A, and May BK (1991). Human erythroid 5-aminolevulinate synthase: promoter analysis and identification of an iron-responsive element in the mRNA. EMBO J 10, 1891–1902. [DOI] [PMC free article] [PubMed] [Google Scholar]
- Crispino JD, Lodish MB, MacKay JP, and Orkin SH (1999). Use of altered specificity mutants to probe a specific protein-protein interaction in differentiation: the GATA-1:FOG complex. Mol Cell 3, 219–228. [DOI] [PubMed] [Google Scholar]
- Dailey HA, and Meissner PN (2013). Erythroid heme biosynthesis and its disorders. Cold Spring Harb Perspect Med 3, a011676. [DOI] [PMC free article] [PubMed] [Google Scholar]
- Dandekar T, Stripecke R, Gray NK, Goossen B, Constable A, Johansson HE, and Hentze MW (1991). Identification of a novel iron-responsive element in murine and human erythroid delta-aminolevulinic acid synthase mRNA. EMBO J 10, 1903–1909. [DOI] [PMC free article] [PubMed] [Google Scholar]
- Doty RT, Phelps SR, Shadle C, Sanchez-Bonilla M, Keel SB, and Abkowitz JL (2015). Coordinate expression of heme and globin is essential for effective erythropoiesis. J Clin Invest 125, 4681–4691. [DOI] [PMC free article] [PubMed] [Google Scholar]
- Dumitriu B, Patrick JP, Petschek JP, Cherukuri S, Klingmuller U, Fox PL, and Lefebvre V (2006). Sox6 cell-autonomously stimulates erythroid cell survival, proliferation, and terminal maturation and is thereby an important enhancer of definitive erythropoiesis during mouse development. Blood 108, 1198–1207. [DOI] [PubMed] [Google Scholar]
- Elias JE, and Gygi SP (2007). Target-decoy search strategy for increased confidence in large-scale protein identifications by mass spectrometry. Nat Methods 4, 207–214. [DOI] [PubMed] [Google Scholar]
- Evans T, and Felsenfeld G (1989). The erythroid-specific transcription factor Eryf1: a new finger protein. Cell 58, 877–885. [DOI] [PubMed] [Google Scholar]
- Galvez-Peralta M, He L, Jorge-Nebert LF, Wang B, Miller ML, Eppert BL, Afton S, and Nebert DW (2012). ZIP8 zinc transporter: indispensable role for both multiple-organ organogenesis and hematopoiesis in utero. PLoS One 7, e36055. [DOI] [PMC free article] [PubMed] [Google Scholar]
- Gibson RS, Abebe Y, Stabler S, Allen RH, Westcott JE, Stoecker BJ, Krebs NF, and Hambidge KM (2008). Zinc, gravida, infection, and iron, but not vitamin B-12 or folate status, predict hemoglobin during pregnancy in Southern Ethiopia. J Nutr 138, 581–586. [DOI] [PMC free article] [PubMed] [Google Scholar]
- Grass JA, Boyer ME, Pal S, Wu J, Weiss MJ, and Bresnick EH (2003). GATA-1-dependent transcriptional repression of GATA-2 via disruption of positive autoregulation and domain-wide chromatin remodeling. Proc Natl Acad Sci U S A 100, 8811–8816. [DOI] [PMC free article] [PubMed] [Google Scholar]
- Gregory T, Yu C, Ma A, Orkin SH, Blobel GA, and Weiss MJ (1999). GATA-1 and erythropoietin cooperate to promoter erythroid cell survival by regulating bcl-xl expression. Blood 94, 87–96. [PubMed] [Google Scholar]
- Gunther V, Lindert U, and Schaffner W (2012). The taste of heavy metals: gene regulation by MTF-1. Biochim Biophys Acta 1823, 1416–1425. [DOI] [PubMed] [Google Scholar]
- Haase H, Hebel S, Engelhardt G, and Rink L (2006). Flow cytometric measurement of labile zinc in peripheral blood mononuclear cells. Anal Biochem 352, 222–230. [DOI] [PubMed] [Google Scholar]
- Han AP, Yu C, Lu L, Fujiwara Y, Browne C, Chin G, Fleming M, Leboulch P, Orkin SH, and Chen JJ (2001). Heme-regulated eIF2alpha kinase (HRI) is required for translational regulation and survival of erythroid precursors in iron deficiency. EMBO J 20, 6909–6918. [DOI] [PMC free article] [PubMed] [Google Scholar]
- Houghton LA, Parnell WR, Thomson CD, Green TJ, and Gibson RS (2016). Serum Zinc Is a Major Predictor of Anemia and Mediates the Effect of Selenium on Hemoglobin in School-Aged Children in a Nationally Representative Survey in New Zealand. J Nutr 146, 1670–1676. [DOI] [PubMed] [Google Scholar]
- Huber KL, and Cousins RJ (1993). Zinc metabolism and metallothionein expression in bone marrow during erythropoiesis. Am J Physiol 264, E770–775. [DOI] [PubMed] [Google Scholar]
- Kambe T, Tsuji T, Hashimoto A, and Itsumura N (2015). The Physiological, Biochemical, and Molecular Roles of Zinc Transporters in Zinc Homeostasis and Metabolism. Physiol Rev 95, 749–784. [DOI] [PubMed] [Google Scholar]
- Kaneko K, Furuyama K, Fujiwara T, Kobayashi R, Ishida H, Harigae H, and Shibahara S (2014). Identification of a novel erythroid-specific enhancer for the ALAS2 gene and its loss-of-function mutation which is associated with congenital sideroblastic anemia. Haematologica 99, 252–261. [DOI] [PMC free article] [PubMed] [Google Scholar]
- Kang YA, Sanalkumar R, O’Geen H, Linnemann AK, Chang CJ, Bouhassira EE, Farnham PJ, Keles S, and Bresnick EH (2012). Autophagy driven by a master regulator of hematopoiesis. Mol Cell Biol 32, 226–239. [DOI] [PMC free article] [PubMed] [Google Scholar]
- Katsumura KR, Bresnick EH, and Group GFM (2017). The GATA factor revolution in hematology. Blood 129, 2092–2102. [DOI] [PMC free article] [PubMed] [Google Scholar]
- King LE, and Fraker PJ (2002). Zinc deficiency in mice alters myelopoiesis and hematopoiesis. J Nutr 132, 3301–3307. [DOI] [PubMed] [Google Scholar]
- Labbe RF, Vreman HJ, and Stevenson DK (1999). Zinc protoporphyrin: A metabolite with a mission. Clin Chem 45, 2060–2072. [PubMed] [Google Scholar]
- Langmead B, Trapnell C, Pop M, and Salzberg SL (2009). Ultrafast and memory-efficient alignment of short DNA sequences to the human genome. Genome Biol 10, R25. [DOI] [PMC free article] [PubMed] [Google Scholar]
- Lee HY, Gao X, Barrasa MI, Li H, Elmes RR, Peters LL, and Lodish HF (2015). PPAR-alpha and glucocorticoid receptor synergize to promote erythroid progenitor self-renewal. Nature 522, 474–477. [DOI] [PMC free article] [PubMed] [Google Scholar]
- Lichten LA, and Cousins RJ (2009). Mammalian zinc transporters: nutritional and physiologic regulation. Annu Rev Nutr 29, 153–176. [DOI] [PubMed] [Google Scholar]
- Liew CK, Simpson RJY, Kwan AHY, Crofts LA, Loughlin FE, Matthews JM, Crossley M, and MacKay JP (2005). Zinc fingers as protein recognition motifs: structural basis for the GATA-1/Friend of GATA interaction. Proc Natl Acad Sci U S A 102, 583–588. [DOI] [PMC free article] [PubMed] [Google Scholar]
- Lindblad B, Lindstedt S, and Steen G (1977). On the enzymic defects in hereditary tyrosinemia. Proc Natl Acad Sci U S A 74, 4641–4645. [DOI] [PMC free article] [PubMed] [Google Scholar]
- Liu X, Zhang Y, Chen Y, Li M, Zhou F, Li K, Cao H, Ni M, Liu Y, Gu Z, et al. (2017). In Situ Capture of Chromatin Interactions by Biotinylated dCas9. Cell 170, 1028–1043 e1019. [DOI] [PMC free article] [PubMed] [Google Scholar]
- McIver SC, Kang YA, DeVilbiss AW, O’Driscoll CA, Ouellette JN, Pope NJ, Camprecios G, Chang CJ, Yang D, Bouhassira EE, et al. (2014). The exosome complex establishes a barricade to erythroid maturation. Blood 124, 2285–2297. [DOI] [PMC free article] [PubMed] [Google Scholar]
- Mclver SC, Katsumura KR, Davids E, Liu P, Kang YA, Yang D, and Bresnick EH (2016). Exosome complex orchestrates developmental signaling to balance proliferation and differentiation during erythropoiesis. Elife 5. [DOI] [PMC free article] [PubMed] [Google Scholar]
- Miller IJ, and Bieker JJ (1993). A novel, erythroid cell-specific murine transcription factor that binds to the CACCC element and is related to the Kruppel family of nuclear proteins. Mol Cell Biol 13, 2776–2786. [DOI] [PMC free article] [PubMed] [Google Scholar]
- Mills-Davies N, Butler D, Norton E, Thompson D, Sarwar M, Guo J, Gill R, Azim N, Coker A, Wood SP, et al. (2017). Structural studies of substrate and product complexes of 5-aminolaevulinic acid dehydratase from humans, Escherichia coli and the hyperthermophile Pyrobaculum calidifontis. Acta Crystallogr D Struct Biol 73, 9–21. [DOI] [PubMed] [Google Scholar]
- Muckenthaler MU, Galy B, and Hentze MW (2008). Systemic iron homeostasis and the iron-responsive element/iron-regulatory protein (IRE/IRP) regulatory network. Annu Rev Nutr 28, 197–213. [DOI] [PubMed] [Google Scholar]
- Munugalavadla V, Dore LC, Tan BL, Hong L, Vishnu M, Weiss MJ, and Kapur R (2005). Repression of c-kit and its downstream substrates by GATA-1 inhibits cell proliferation during erythroid maturation. Mol Cell Biol 25, 6747–6759. [DOI] [PMC free article] [PubMed] [Google Scholar]
- Nguyen AT, Prado MA, Schmidt PJ, Sendamarai AK, Wilson-Grady JT, Min M, Campagna DR, Tian G, Shi Y, Dederer V, et al. (2017). UBE2O remodels the proteome during terminal erythroid differentiation. Science 357, eaan0218 doi:0210.1126/science.aan0218. [DOI] [PMC free article] [PubMed] [Google Scholar]
- Nishiyama S, Kiwaki K, Miyazaki Y, and Hasuda T (1999). Zinc and IGF-I concentrations in pregnant women with anemia before and after supplementation with iron and/or zinc. J Am Coll Nutr 18, 261–267. [DOI] [PubMed] [Google Scholar]
- Perkins AC, Sharpe AH, and Orkin SH (1995). Lethal beta-thalassaemia in mice lacking the erythroid CACCC- transcription factor EKLF. Nature 375, 318–322. [DOI] [PubMed] [Google Scholar]
- Pevny L, Simon MC, Robertson E, Klein WH, Tsai SF, D’Agati V, Orkin SH, and Costantini F (1991). Erythroid differentiation in chimaeric mice blocked by a targeted mutation in the gene for transcription factor GATA-1. Nature 349, 257–260. [DOI] [PubMed] [Google Scholar]
- Prasad AS, Beck FW, Kaplan J, Chandrasekar PH, Ortega J, Fitzgerald JT, and Swerdlow P (1999). Effect of zinc supplementation on incidence of infections and hospital admissions in sickle cell disease (SCD). Am J Hematol 61, 194–202. [DOI] [PubMed] [Google Scholar]
- Ryu MS, Lichten LA, Liuzzi JP, and Cousins RJ (2008). Zinc transporters ZnT1 (Slc30a1), Zip8 (Slc39a8), and Zip10 (Slc39a10) in mouse red blood cells are differentially regulated during erythroid development and by dietary zinc deficiency. J Nutr 138, 2076–2083. [DOI] [PMC free article] [PubMed] [Google Scholar]
- Sankaran VG, and Weiss MJ (2015). Anemia: progress in molecular mechanisms and therapies. Nat Med 21, 221–230. [DOI] [PMC free article] [PubMed] [Google Scholar]
- Sun J, Brand M, Zenke Y, Tashiro S, Groudine M, and Igarashi K (2004). Heme regulates the dynamic exchange of Bach1 and NF-E2-related factors in the Maf transcription factor network. Proc Natl Acad Sci U S A 101, 1461–1466. [DOI] [PMC free article] [PubMed] [Google Scholar]
- Tanimura N, Miller E, Igarashi K, Yang D, Burstyn JN, Dewey CN, and Bresnick EH (2016). Mechanism governing heme synthesis reveals a GATA factor/heme circuit that controls differentiation. EMBO Rep 17, 249–265. [DOI] [PMC free article] [PubMed] [Google Scholar]
- Tsai SF, Martin DI, Zon LI, D’Andrea AD, Wong GG, and Orkin SH (1989). Cloning of cDNA for the major DNA-binding protein of the erythroid lineage through expression in mammalian cells. Nature 339, 446–451. [DOI] [PubMed] [Google Scholar]
- Waterman MR (1978). Spectral characterization of human hemoglobin and its derivatives. Methods Enzymol 52, 456–463. [DOI] [PubMed] [Google Scholar]
- Zenke-Kawasaki Y, Dohi Y, Katoh Y, Ikura T, Ikura M, Asahara T, Tokunaga F, Iwai K, and Igarashi K (2007). Heme induces ubiquitination and degradation of the transcription factor Bach1. Mol Cell Biol 27, 6962–6971. [DOI] [PMC free article] [PubMed] [Google Scholar]
- Zhang J, Socolovsky M, Gross AW, and Lodish HF (2003). Role of Ras signaling in erythroid differentiation of mouse fetal liver cells: functional analysis by a flow cytometry-based novel culture system. Blood 102, 3938–3946. [DOI] [PubMed] [Google Scholar]
Associated Data
This section collects any data citations, data availability statements, or supplementary materials included in this article.
Supplementary Materials
Table S1. GATA-1- and Alas2-enhancer-regulated proteins detected by proteomics, Related to Figure 1.
Table S2. GATA-1- and Alas2-enhancer-regulated genes detected by proteomics and RNA-seq, Related to Figure 1.
Figure S1. Principle component analysis of the proteomes and GATA-1/Alas2-enhancer-repressed mRNAs/proteins, Related to Figure 1.
Figure S2. Mechanistic dissection of GATA-1/heme-regulated gene expression, Related to Figure 2.
Figure S3. Expression levels of all Slc30 (zinc exporter) and Slc39 (zinc importer) family members in mouse and human proerythroblasts and orthochromatic erythroblasts, Related to Figure 3.
Figure S4. Slc39a8 downregulation during erythroid maturation of wild type and Alas2 enhancer-mutant G1E-ER-GATA-1 cells, Related to Figure 3.
Figure S5. Increased and decreased intracellular zinc during cultured primary human and mouse erythroblast maturation, Related to Figures 4 and 6.
Figure S6. Intracellular zinc as a determinant of terminal differentiation, Related to Figure 6.
Figure S7. Reducing intracellular zinc restricts terminal differentiation, Related to Figure 6.
Table S3. Primers for RT-qPCR and oligonucleotides for construction of shRNAplasmids, Related to STAR Methods.