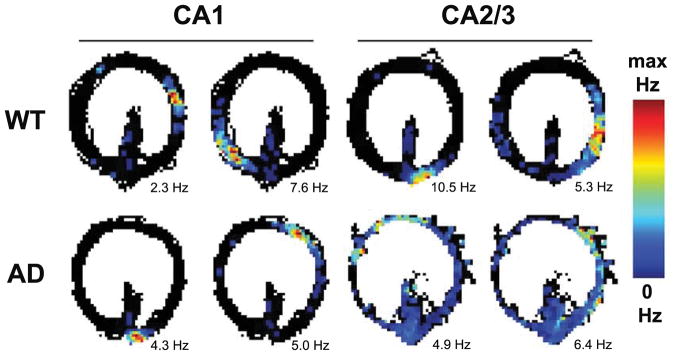
Figure 4.
Example place cells recorded from WT and AD rats in hippocampal regions CA1 or CA2/3. The examples were taken from the control (no drug) condition. The color bar indicates the colors used to plot firing rates across locations of the circle track. Maximum firing rates are noted below each example. The examples depict that CA2/3 place cells (but not CA1 place cells) in AD rats showed less spatial specificity as compared to place cells in WT rats.

