

Abstract
This manuscript presents an NMR strategy to investigate conformational differences in protein-inhibitor complexes, when the inhibitors tightly bind to a protein at sub-nanomolar dissociation constants and are highly analogous to each other. Using HIV-1 protease (PR), we previously evaluated amide chemical shift differences, ∆CSPs, of PR bound to darunavir (DRV) compared to PR bound to several DRV analogue inhibitors, to investigate subtle but significant long-distance conformation changes caused by the inhibitor’s chemical moiety variation [Khan, S. N., Persons, J. D, Paulsen, J. L., Guerrero, M., Schiffer, C. A., Kurt-Yilmaz, N., and Ishima, R., Biochemistry, (2018), 57, 1652-1662]. However, ∆CSPs are not ideal for investigating subtle PR-inhibitor interface differences because intrinsic differences in the electron shielding of the inhibitors affect protein ∆CSPs. NMR relaxation is also not suitable as it is not sensitive enough to detect small conformational differences in rigid regions among similar PR-inhibitor complexes. Thus, to gain insight into conformational differences at the inhibitor-protein interface, we recorded 15N-half filtered NOESY spectra of PR bound to two highly analogous inhibitors and assessed NOEs between PR amide protons and inhibitor protons, between PR amide protons and hydroxyl side chains, and between PR amide protons and water protons. We also verified the PR amide-water NOEs using 2D water-NOE/ROE experiments. Differences in water-amide proton NOE peaks, possibly due to amide-protein hydrogen bonds, were observed between subunit A and subunit B, and between the DRV-bound form and an analogous inhibitor-bound form, which may contribute to remote conformational changes.
Keywords: NMR, water, relaxation, protein, HSQC, NOE, deuteration
1. Introduction
In medicinal chemistry, technologies for drug-screening, structure-based drug design, and quantitative analysis of structure-function relationships have advanced tremendously during the last two decades [1–5]. With these advances, we have learned that a slight change in one chemical moiety of an enzyme inhibitor can significantly improve the inhibitory potency without substantially altering the rigid inhibitor-bound enzyme structure; often in these cases, only a small number of inhibitor-side chain interactions are changed [6–9]. MD simulations have provided insight into the small, but critical conformational differences in protein-inhibitor complexes [10–14]. Still, experimental verification of the MD observations or direct detection of small conformational changes in solution is important for a comprehensive picture of inhibitor-protein interaction mechanisms.
HIV-1 PR, a symmetric homodimer with 99 residues in each subunit, is an aspartic hydrolase that is essential for viral maturation [15,16]. Because it is essential for viral replication, tremendous effort has been put into the development of PR inhibitors. One FDA-approved PR inhibitor, darunavir (DRV), binds wild-type (WT) PR extremely tightly, exhibiting a pico-molar inhibition constant at the substrate-binding site [17]. Previously, the group of Celia Schiffer developed a series of darunavir (DRV)-analogue inhibitors, UXs (here, UX = U1 - U10), that have modified P1′ and P2′ moieties compared to DRV ([11], see Fig. 1A). These inhibitors bind PR at an inhibition constant similar to or better than DRV; in addition, the crystal structures of PR-UX forms are similar to each other, with a root-mean-square deviation (rmsd) of Cα atoms less than 0.16 Å [11]. Recently, 300 ns MD simulations of PR-UX complexes demonstrated that changes in the P1′ or P2′ moieties do not affect van der Waals interactions at the P2 moiety, which is the major inhibitor interaction interface on Subunit A [14]. The MD data also suggested the formation of water-mediated hydrogen bonds between the inhibitor and PR residues I50A, I50B, and D29B [14]. Here, A or B after the residue number indicates subunit A or B, respectively, in the PR homodimer.
Fig. 1.
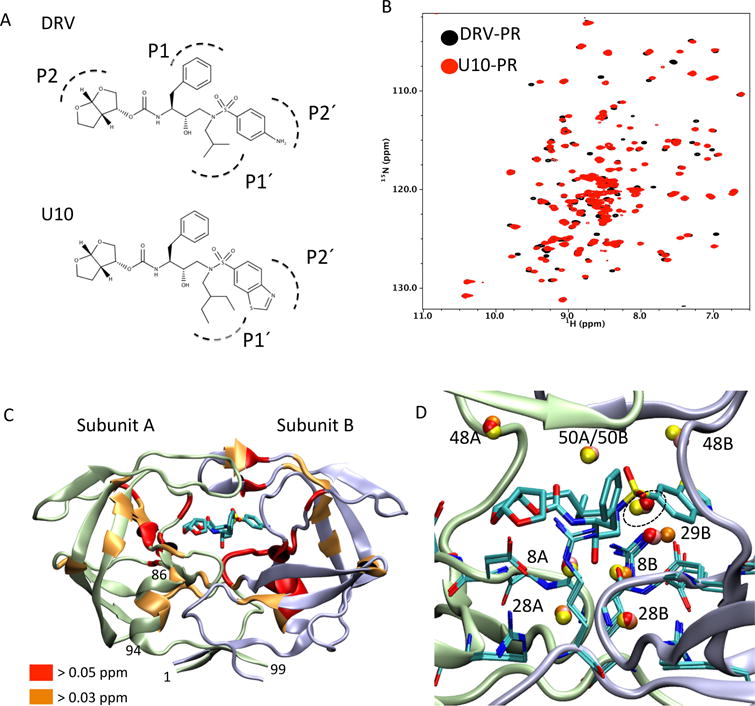
(A) Chemical structures of the HIV-1 PR inhibitor DRV and its analogue U10 (adopted from reference [11]), (B) comparison of DRV-PR (black) and U10-PR (red) 1H-15N NMR spectra [18], (C) graphical presentation of differences in 1H-15N combined chemical shift between DRV-PR and U10-PR (red, > 0.05 ppm; orange, 0.03 ppm) [18], and (D) conserved crystallographic water molecule positions at and around the PR-inhibitor interaction site. Protein graphics in (C) and (D) were generated using U10-bound PR crystal structure (PDB: 3O9I, [11]). In (C), residues numbers at the N- and C-termini and in an α-helix region are shown for Subunit A. In (D), residues at the subsequent region of the active site (residues 27 to 31), R87 (known to interact with D29), K8 (known to interact with two water molecules at the active site region), and the U10 inhibitor are shown as stick representation. Note, alphabet after the residue number, A or B, indicates the subunit A or B. Spheres (red, orange, pink, and yellow) indicate water molecule positions conserved in U2-, U3-, U7-, and U10-bound PR crystal structures (PDB: 3O9A, 3O9B, 3O9F, and 3O9I, respectively, [11]). Residue numbers near the water molecules are shown, and a water cluster near the inhibitor is highlighted with a dashed circle, without residue number indicated.
We recently carried out 1H-15N NMR experiments and evaluated amide chemical shift differences, ∆CSPs, of PR bound to DRV and a subset of the DRV-analogue inhibitors, U2, U3, U7, and U10, with an aim to understand how one or two chemical moiety changes in an inhibitor affects PR interaction in solution [18]. The UX inhibitors are highly analogous to DRV, and even though both P1′ and P2′ moieties in U10 are different from DRV, a 1H-15N correlation spectrum of PR in the U10 bound form is very similar to that of the DRV bound form (Fig. 1B). However, our previous ∆CSP data demonstrated that changes at the P1′ and/or P2′ moieties cause subtle, but detectable, effects at a single α-helix, more than 10 Å away from the modified chemical groups, in both subunit A and B of PR (Fig. 1C) [18]. Hydrogen bond probability, calculated using the previous MD simulation data [14], predicted that such long distance effects to the α-helix (residues 86 – 94, [19]) occur through changes in tertiary interactions and are not due to instability of the helix itself [18].
In our previous analysis of DRV analogue inhibitor interactions with PR, we applied ∆CSPs to assess small differences in the way that the analogues interact with PR. Such an analysis of ∆CSP is only useful for detection of changes distant from the inhibitor interaction site; since the inhibitor-bound forms of PR are highly analogous, ∆CSP is expected to negate most of chemical shielding caused by differences in inhibitor chemical-structure, except for those proximal to the modified moiety. On the other hand, ∆CSPs cannot be used to investigate conformational changes at the direct inhibitor interaction site, because ∆CSPs reflect differences in the intrinsic electron shielding of the chemical moieties of the inhibitors. NMR relaxation is not sensitive enough to detect small conformational differences in a rigid region in similar PR-inhibitor complexes. Also, these experiments do not elucidate whether water molecules conserved among these UX-PR complex structures actually reside in solution [11] (Fig. 1D).
Therefore, in the present study, we carry out 15N half-filtered NOESY experiments, in which 15N-bonded protons are filtered out in the F1 dimension, using a perdeuterated 15N-labeled PR complexed with DRV or U10. The experiments detect NOEs between 1) PR amide protons and inhibitor protons, 2) PR amide protons and labile side chain protons, and 3) PR amide protons and water protons. The experiment is suitable to study conformational difference in similar PR-inhibitor complexes for a couple of reasons: hydrogen bond formation is known to be important for protein-protein and protein-ligand interactions [20–27] and water molecules are expected to have critical roles in protein-inhibitor interactions [14,28–32]. In addition, in our experiments that aim to detect subtle differences in inhibitor-protein interactions, 13C-half filter using a 13C-labeled protein was not used because residual aliphatic 13C-H protein signals may overlap with the inhibitor signals. Observed NH-water NOE peaks are distinguished from the exchange peaks by comparing 2D water-amide NOE and ROE experiments and are verified by comparing 2D water-amide NOE experiments of some of UX-bound forms. We find asymmetric water-PR interaction between subunits A and B and also differences in water-amide NOEs between DRV- and U10- bound forms, especially in the regions that bridge PR-inhibitor binding sites and the remote α-helix site. Finally, we discuss an NMR strategy to investigate conformational differences in protein-inhibitor complexes when inhibitors tightly bind to a protein, at sub-nanomolar dissociation constants, and are highly analogues to each other.
2. Materials and methods
In the present NMR studies, we utilized 15N-labeled PR, containing Q7K, L33I, C67A, and C95A mutations, in complex with DRV, U2, U3, U7 and U10, which were previously prepared [18]. We newly prepared 15N-labeled deuterated PR in complex with DRV and U10. Perdeuterated 15N-labeled PR was prepared by expressing the protein in E. coli using 15NH4Cl, D-glucose-1,2,3,4,5,6,6-d7 (97-98%), and 99.8% D2O (Cambridge Isotope Laboratories, Inc, Tewksbury, MA) and purified using the same purification protocol described previously [18]. Protein samples for NMR experiments were prepared, using inhibitors synthesized in Schiffer’s group [11], as described previously [18]. All NMR samples contained PR at ~250 μM in 20 mM phosphate buffer in 5% D2O at pH 5.8, with an approximately 2-fold greater inhibitor concentration.
All NMR data were collected at 20 °C. 15N transverse relaxation and {1H}-15N heteronuclear NOE (het-NOE) experiments were performed on a Bruker Avance 600 MHz spectrometer, similarly to those performed previously [12]. 3D 15N-half filtered experiments, which detect NOEs from unlabeled protons to 15N-attached protons, were performed using the Bruker pulse sequence noesyhsqcf3gpwgx13d, with a 120 ms NOE mixing time on a Bruker 900 Avance spectrometer.
2D water-amide NOE experiments [33] were performed using an in-house pulse program, with an 80 ms NOE mixing period, also on a Bruker 900 Avance spectrometer (attached in the supplement). In each 2D water-NOE experiment, a set of two spectra, one with water magnetization along +Z and the other with water magnetization along –Z at the starting of the NOE mixing period, were recorded. An NOE spectrum is obtained by subtracting the two datasets in the data processing [34]. The experiment was repeated by replacing the NOE period with a 30 ms spin lock at 9.6 kHz B1/2π field, to record a ROE spectrum to distinguish NOE from water-NH exchange peaks on a Bruker 800 Avance spectrometer. These B1/2π field strength and the ROE mixing time are similar to those employed previously [33]. Weak B1/2π field strength was not used to avoid uneven off-resonance effect at 800 MHz. Instead, the ROE mixing time was shortened to 30 ms. When a longer NOE > 100 ms is used, it may be ideal to use a longer ROE > 50 ms for comparison.
Comparison of 2D water-NOE of DRV, U2, U3, U7, or U10-bound PRs was performed using non-deuterated 15N-labeled proteins. First, using a PR-DRV sample, four water-NOE experiments were carried out at T2-filter times [35], 7.2, 14, 20, and 26 ms from the start of the water 90° pulse to the end of the T2-filter time, to estimate the efficiency of the T2-filter. Next, two 2D water-NOE experiments, at 7.2 ms and 20 ms T2-filter, were recorded, each for DRV, U2, U3, U7, or U10-bound PRs. The ratio of the two NOE intensities was calculated in Eq. (1).
| (1) |
Here, [wNOE_unfiltered] is the NOE intensity at 7.2 ms T2-filter, which is almost occupied by water shaped pulses (Fig. S1), and [wNOE_filtered] is the NOE intensity either at 14, 20, or 26 ms T2-filter. Note, NOE intensities themselves were obtained in an individual 2D water-NOE spectrum as described above. Taking the ratio in Eq. (1) discards magnitude information of HN-water NOE but is used to assess whether the NOE is from Hα that is inverted together with water protons, or from water protons. Thus, when the filtered/unfiltered ratio is close to 1, the observed NOE is expected mostly from HN-water NOE, and when the filtered/unfiltered ratio is close to 0, the observed NOE is expected mostly from Hα-HN NOE. Such a T2-filtering is effective on α-protons that are excited by the water-selective pulses. Other α-protons that are not excited by the water-selective pulses do not contribute to wNOE anyway, and are thus ignored. Data were processed using nmrPipe [34] and analyzed using nmrPipe and CCPNMR [36]. VMD software was used for graphical presentation of the protein [37].
3. Results
3.1. A rigid feature of DRV or U10-bound PR
As expected from previous studies [12,38], 15N transverse relaxation rates, R2s, of U10-bound PR were very similar to those of DRV-bound PR, with a correlation coefficient between the two data sets, excluding residues that exhibit 2-standard deviation from the mean, of 0.79 (Fig. 2A-B). Het-NOE of U10-PR also showed a similar profile to that of DRV-PR (Fig. 2C). The lower correlation coefficient between the two sets of het-NOE, 0.73 (Fig. 2D), was expected, due to the lower uncertainty of the het-NOE compared to that of R2, 5% vs. 2.5%. Since NMR relaxation data contain errors (caused by insufficient suppression of cross correlation between 1H-15N dipolar coupling and 15N chemical shift anisotropy, spatial B1 inhomogeneity, and/or water saturation [39–45]), small conformational differences between U10- and DRV-bound forms, especially at the rigid inhibitor-PR interface, are not likely obtained. Thus, we decided to record 1H-1H NOEs using a 15N half-filtered NOESY with perdeuterated 15N-labeled PR complexed with DRV or U10. The half-filtered NOESY detects NOEs (or exchange crosspeaks) of PR amide protons with inhibitor protons, labile side chains, and water protons, and are useful to gain insight into the PR-inhibitor interface.
Fig. 2.
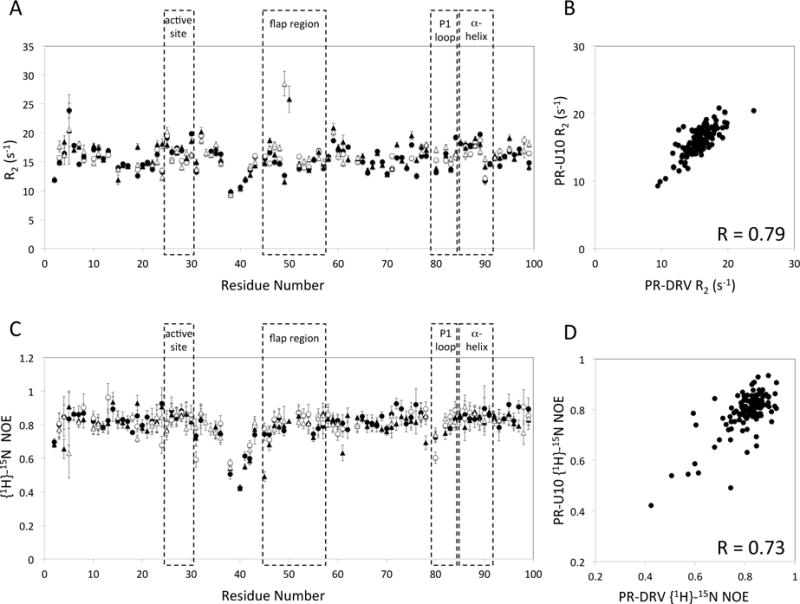
(A) 15N transverse relaxation rates, R2, of PR-DRV (circles) and PR-U10 (triangles), (B) its correlation, (C) het-NOE of PR-DRV (circles) and PR-U10 (triangles), and (D) its correlation. In (A and C), the data points in subunit A and subunit B are shown as black and open symbols, respectively. For comparison purpose, resonances that were not identified as either subunit were tentatively assigned to one of the two subunits.
3.2. Comparison of half-filtered NOESY data for the PR inhibitor binding site in the presence of DRV or U10
Assignment of the NOE cross peaks in the half-filtered NOESY spectra was performed based on the chemical shifts of the PR-inhibitor complexes [18] and the inhibitors alone [11,46] and atomic distances calculated from the crystal structures of the complexes [11]. Overall, the half-filtered NOESY at the active site region, from D25 to D31, in subunit A showed similar NOE patterns for both the PR-DRV and PR-U10 complexes (Fig. 3A). Inter-subunit NOEs between T26A NH and T26B OH (2.1 Å, distance calculated from the crystal structure, PDB code, 1T3R) and the intra-subunit NOEs of T26A NH and T26A OH (2.6 Å), which form a ‘fireman’s grip’[47,48], were observed with the peak intensities reflecting the distance differences of the two in both U10 and DRV bound PRs (Fig. 3A and 4A). Also, NOEs between the a bis-tetrahydrofuran (bis-THF) proton in the inhibitors and backbone amide protons in PR, at residues D29A and D30A, were similarly detected in both U10 and DRV bound forms (Fig. 3A and 4A). These observations are consistent with a previous MD study showing that a P1′ or P2′ moiety change does not affect van der Waals interactions at P2, the major interface in subunit A [14]. In the NOE data for subunit B, an NOE pattern at the fireman’s grip was detected in the T26B strips, symmetrical to that in Subunit A, both in PR-DRV and U10 complexes (Fig. 3B and 4A). Similarly, amide protons of D29B and D30B showed expected NOEs to phenylamine or benzothiazole in DRV or U10, respectively (Fig. 3B and 4A).
Fig. 3.
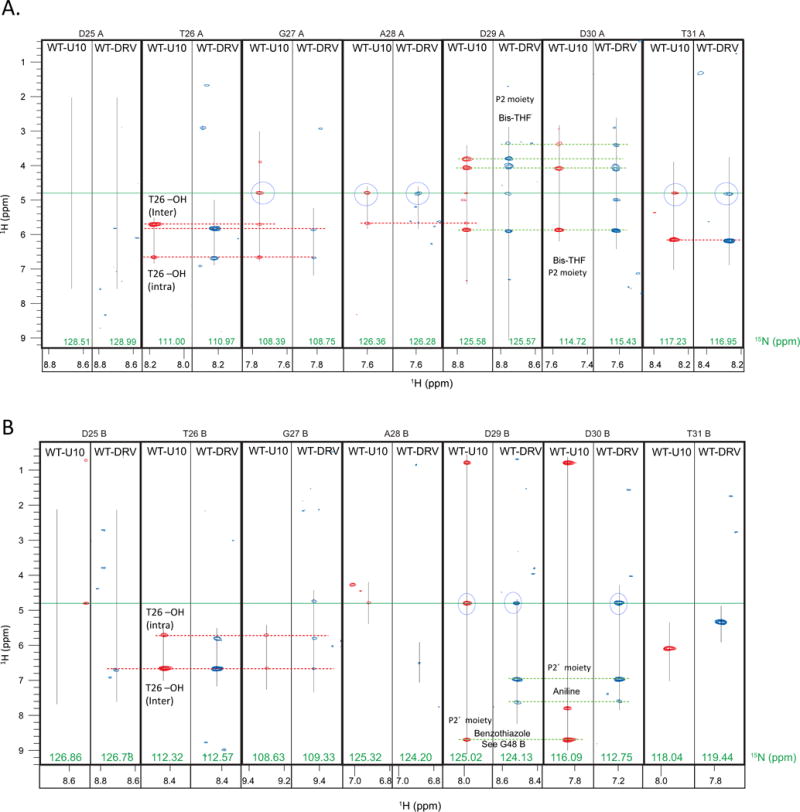
15N half-filtered NOESY strips for the residues at the active site region of U10- and DRV-bound PR in (A) subunit A and (B) subunit B. Blue-circles indicate the water-NH NOEs. Red and green dashed horizontal lines indicate NOEs between PR and inhibitor, respectively.
Fig. 4.
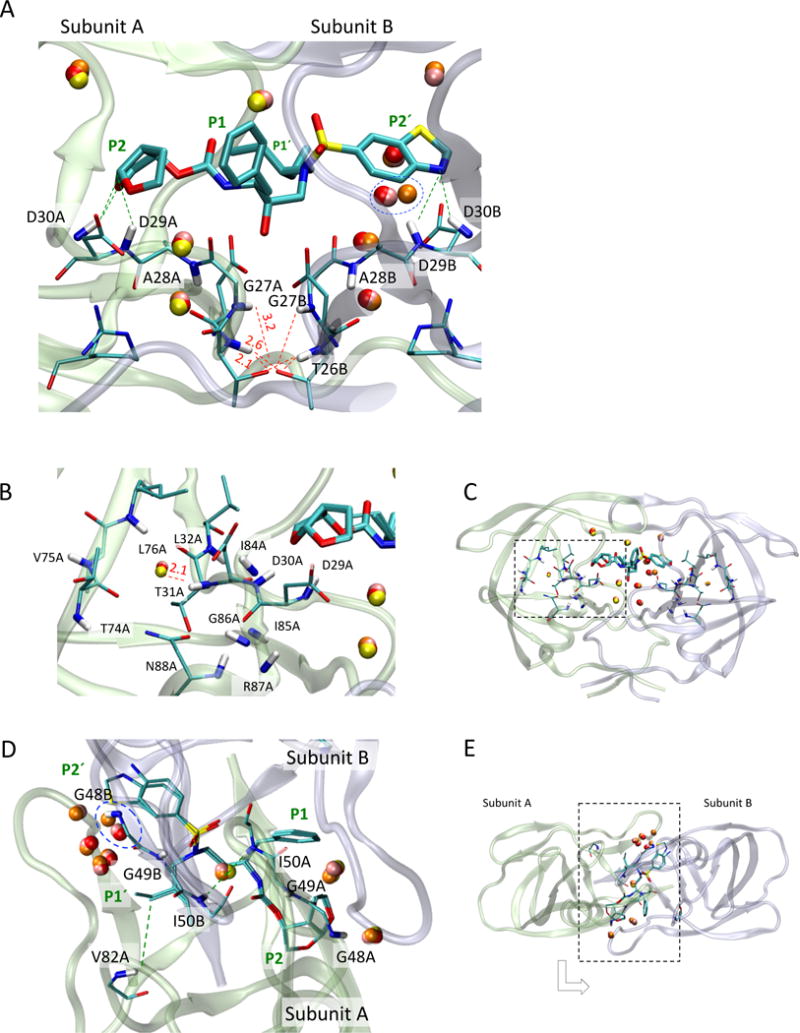
Graphical presentation of (A) the active-site region of PR, showing the sites that have inhibitor-PR NOE connectivity (green dashed line) and intra-PR NOE connectivity (red dashed line) observed in Fig. 3, (B) a position of the conserved crystallographic water near T31A (orange dashed line), (C) its relative location in the PR-inhibitor complex, (D) the flap and the surrounding regions, showing the sites that have inhibitor-PR NOE (green dashed line), and the (E) its relative location in the PR-inhibitor complex. In (A-C), the graphics were generated using PR-U10 complex (PDB: 3O9I, [11]). In (A), stick shows residues of the active site region (residues 25-30). In (D and E), the graphics were generated using PR-U10 and PR-DRV (PDB: 3O9I and 1T3R, [11,54]). Other notations are the same as those in Fig. 1D.
In the active site region, water-NH NOEs were observed at residues A28A and T31A in Subunit A (Fig. 3A) and D29B in subunit B (Fig. 3B), asymmetrically between subunit A and B, in both U10 and DRV bound forms. Since T31A NH faces towards the subunit core, but not to the inhibitor (Fig. 4B and 4C), the asymmetric water-NH NOE may differentially affect core stability in subunit A, compared to subunit B. In contrast, water-NH NOE at D29B indicates that water molecule(s) can reside between the P2′ moiety and the active site loop in subunit B (Fig. 4A). We will describe the evaluation of A28A NH-water NOEs in the 2D water-NOE section below.
There were differences in the water-NH NOE patterns between U10 and DRV bound forms. Water-amide NOE was observed for G27A in the U10-PR complex, but not in the DRV-PR complex (Fig. 3A). In contrast, water-NH NOE was also observed for D30B in the DRV-PR complex, but not in the U10-PR complex (Fig. 3B). G27A NH is located at the dimer interface (Fig. 4A). D30B may relate to the difference in the size of the P2′ moiety: a larger P2′ moiety in U10 (benzothiazole), compared to DRV (phenylamine) (Fig. 1A) may be less accommodating to water molecules between D29B/D30B and the P2′ moiety.
The PR flap is a β-hairpin structure (residues 43-58) that is known to be mobile in solution [49–51]. The flap closes in the inhibitor-bound forms, while the tip of the flap (residues 49 - 52) undergoes βI– βII turn conversion [38,51]. We observed a closed flap conformation in both DRV and U10 bound PRs, as seen in the NOEs from the inhibitor protons to amide protons at G48A, I50A, and G48B (Fig. 5). NOE cross-peaks between the I50A amide proton and a water proton were observed. Similar cross-peaks were seen for I50B. In contrast, no water-NH NOE was detected for residues G48A or G48B (Fig. 4D and 4E), consistent with a previous PR-water interaction study [29]. Although conserved water molecules are observed in crystal structures near residues G48A, I50A, G48B and I50B, the resident water likely exists near I50A and 150B, based on our data, and is consistent with the previous simulation data [14].
Fig. 5.
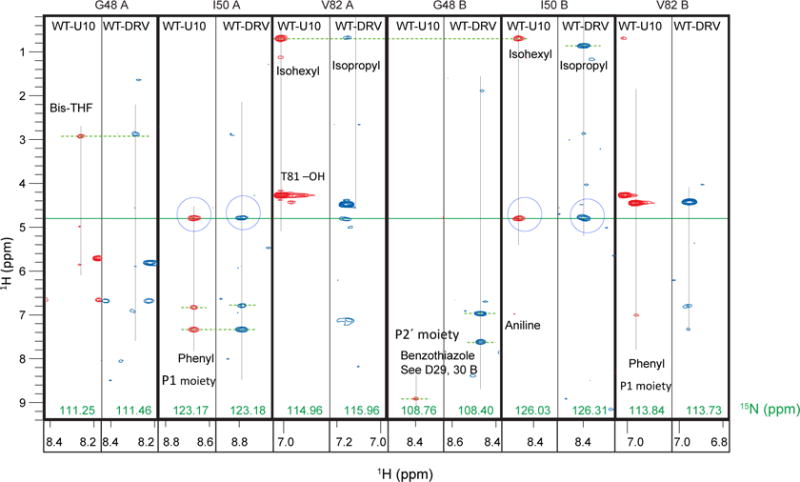
15N half-filtered NOESY strips at the flap region and residue 82 for both subunits A and B. Symbols are notations are the same as those described in Figure 3.
NOEs from the water molecules are expected to reflect either (1) a real dipolar coupling from a resident water molecule (NOE) or (2) an exchange phenomenon between the amide proton and the water protons. To distinguish between these, we compared 2D water-NOE and ROE spectra recorded using non-deuterated proteins. The NOE data for PR-DRV basically showed NOE patterns consistent with those of the 3D NOESY (Fig. 6A). Negative ROE peaks, due to water-NH exchange phenomena, were observed for Q2A/Q2B, G17A/G17B and N37A/N37B (Fig. 6B). The above described water-NOEs therefore mainly reflect dipolar coupling from resident water molecules, based on ROE experiments.
Fig. 6.
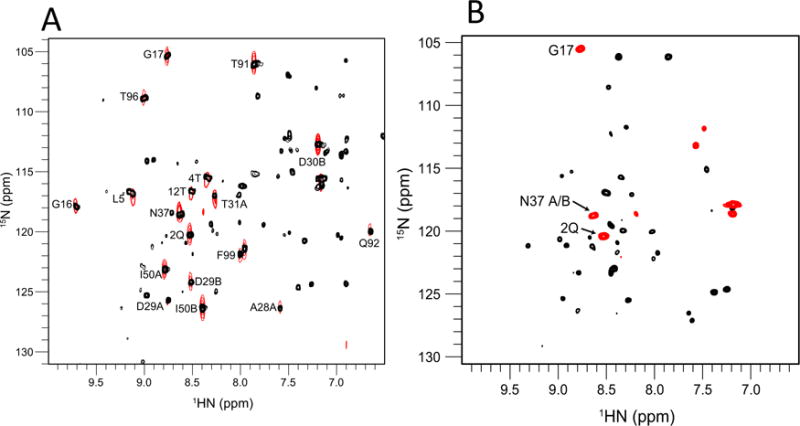
(A) Overlay of a 2D water-amide NOE spectrum (black) and a water region of the 1H-15N slice of 3D 15N-half filtered NOESY experiment (red), and (B) a 2D water-amide ROE spectrum. In (A), residue numbers of the peaks that are likely from labile side chains are indicated by small font. In (B), black and red show positive (ROE) and negative (exchange) peaks, respectively.
3.3. Possible water-amide interaction, estimated using 2D water-NOE for PR-UX bound forms
To verify the observed water-amide NOE patterns in the DRV and U10 bound forms, we carried out 2D water-amide NOE experiments using the other PR-UX complexes. Since the protein used for these experiments was neither deuterated nor 13C-labeled, the 2D water-NOE experiment contained a 1H T2-filter to eliminate possible NOE from protons to amide protons [35]. For this, we introduced the filtered/unfiltered ratio to assess whether the NOE is from Hα that is inverted together with water protons, or from water protons (Eq. 1). A histogram of the NOE intensities in the β-rich regions, that contain Hα-HN interactions in close proximity, exhibited a symmetric normal distribution when the T2-filter time was short (Fig. 7A). As the T2-filter became longer, the distribution became asymmetric, with the intensity of many signals lost (Fig. 7A), indicating the filter reduces the Hα-HN NOEs. In contrast, other regions did not exhibit an altered distribution profile after changing the length of the T2-filter (Fig. 7B). The filter efficiency, filtered/unfiltered ratio (Eq. 1), demonstrated that amides that experience Hα-HN NOEs in the β-sheet mostly exhibited < 60% ratio, while amides that were found to undergo HN-water NOE (or exchange) in the half-filtered NOESY showed a ratio > 60% ratio (Fig. 7C). The latter residues included Q2, G17, N37A and N37B that undergo NH-water exchange (Fig. 6) and A28A, D29B, D30B, I50A, and I50B that undergo NH-water NOE in the filtered NOESY (Fig. 3 and 6).
Fig. 7.
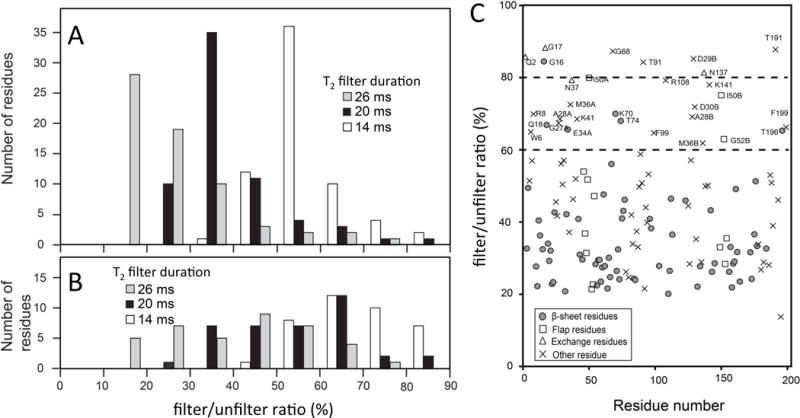
Histograms of filter/unfilter ratio in the wNOE spectra for residues (A) in the β-sheet and (B) in other regions at different T2 filter times, and (C) a residue profile of the filter/unfilter ratio calculated using Eq. (1), for 26 ms T2 filter data. In (A and B), the T2 filter times were varied: open bars, 14 ms; black bars, 20 ms; gray bars, 26 ms. In (C), different symbols were used to express the data points of backbone amides: in the β-sheet, circle: in the flap region, rectangle; those that undergoes exchange, triangle; others, cross. Aspartic acid and threonine residues, many of which interact with the inhibitors, have been removed in (A) and (B) while included in (C).
Based on the above results, we recorded 2D water-amide NOE data for PR-UX complexes (here, X = 2, 7, 10) as well as PR-DRV, all using the same 15N labeled PR, at 7.2 ms (i.e., wNOE_unfiltered) and 20 ms (wNOE_filtered) T2-filter. Note, U10 and DRV have different P1′ and P2′ moieties (Fig. 8A); U10 and U7 have the same P2′ moiety (Fig. 8B); U2 and U7 have the same P1′ moiety (Fig. 8C) [11]. In the NMR spectra of all the PR-inhibitor complexes, overall patterns of filtered/unfiltered ratios were similar to each other, regardless of which moiety differed (Fig. 8), reflecting overall similarity of the structures. Residues I50A and/or I50B exhibited high filtered/unfiltered ratios (>0.9) indicative of water-NH NOE (Fig. 8), consistent to above observations (Fig. 5). Similarly, D29B, which exhibited water-NH NOE in the filtered-NOESY, exhibited higher filtered/unfiltered ratios compared D29A, which did not exhibit a water-NOE in the filtered-NOESY (Fig. 8). T31A, which exhibited a water-NH NOE in filtered-NOESY, also exhibited higher filtered/unfiltered ratio than T31B, which did not exhibit water-NOE in the filtered-NOESY, except for PR-U10 complex (Fig. 8). Although A28A, but not A28B, exhibited water-NH NOE in filtered-NOESY in both U10 and DRV bound forms (Fig. 3), such a clear difference was not detected in the filtered/unfiltered ratios (Fig. 8). Since A28A NH is located at the active site loop, with G27A NH and T26 NH located 2.6 and 4.3 Å apart, these spin interactions may affect the filtered/unfiltered ratio.
Fig. 8.
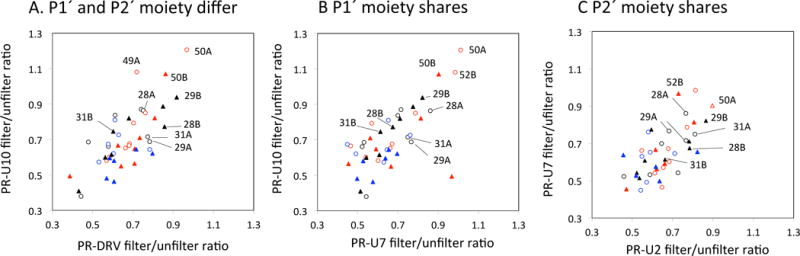
(A) Comparison of filter/unfilter ratios (A) for residues in PR-U10 versus those in PR-DRV, in which P1′ and P2′ moiety differ, (B) for residues in PR-U10 versus those in PR-U7, in which only P1′ moiety shares, and (C) for residues in PR-U2 versus those in PR-U7, in which only the P2′ moiety is shared [11]. All filter/unfilter ratios here were calculated using Eq. (1) for 20 ms T2 filter data. In each panel, open circles and filled triangles represent residues in subunits A and B, respectively. Residues at/within the active site loop (residues 25-32), flap region (residues 46-56), and P1 loop (77-84) are shown by black, red, and blue, respectively.
Quantitatively, filtered/unfiltered ratios of residue 49 and 50 in the PR-U10 complex were higher than 1.0, indicating that T2-filter may modify the water-NOE. Since these residues undergo exchange or NOE to water, it is possible that excited water during the T2-filter period contributes additional exchange or NOE effect, compared to those obtained without the filter, depending on time scale or dynamics of the residues. Thus, the obtained filtered/unfiltered values have limitations in quantitative evaluations but could be used for comparison among the similar complexes, as described above.
4. Discussion
During drug optimization, we often encounter a situation in which a slight change of a chemical moiety in an enzyme inhibitor significantly improves the inhibitory potency but does not alter the inhibitor-bound enzyme structure, except for a small number of inhibitor-side chain interactions. Thus, in this manuscript, we demonstrated an NMR strategy to investigate conformational differences in protein-inhibitor complexes, when the inhibitors tightly bind to the target protein with sub-nanomolar dissociation constants and are highly analogous to one another. Although NMR relaxation is a sensitive method to detect internal dynamics in proteins, we did not use the relaxation to investigate dynamics at the inhibitor interaction site in the PR-inhibitor complexes (Fig. 2). Given that the interaction site is rigid and similar among the complexes, we cannot expect to detect significant differences among the homologous PR-inhibitor complexes. Indeed, although NMR relaxation has proven to be a powerful means to compare PR and mutants in the apo forms [10], it was not sensitive in their DRV-bound forms [12].
Consistent with previous studies [14] [29], significant inhibitor interactions with PR residues and water-NH interactions at I50A, I50B, and D29B at the PR-inhibitor interface in both PR-DRV and PR-U10 bound forms were observed. We also observed water-NH NOE at T31A, but not T31B. The amide of T31A faces towards the PR core, but not the P2 moiety of the inhibitor. Given that displacement at the active-site loop in subunit A, including residues 27, 28 and 29, is highly correlated with the P2 moiety of the inhibitor [14], a water molecule at T31 may bridge the rigid active-site loop with the surrounding β-strand in subunit A (Fig. 4B). Interestingly, DRV- and U10- bound forms exhibited different NH-water NOEs: G27A NH-water interaction was observed in the PR-U10 complex, while D30B NH-water interaction was observed in the PR-DRV complex, which is presumably due to differential effects of the P1′ and P2′ moieties on water-protein interactions. All these observed differences between two subunits or between inhibitors are located at the sides that connect the inhibitor interaction site and the remote α-helix in PR. In this respect, the observed NOE results may be compliments to the previous ∆CSP study [18].
The framework for the techniques used in the current and the previous studies is discussed. We previously used chemical shift differences, ∆CSPs, of a protein complexed with inhibitors that differ by only one or two chemical moieties, to investigate long-distance conformational changes caused by the inhibitors’ chemical moiety variation (Fig. 1C) [18]. A key point of the ∆CSP application is that differences in inhibitor chemical-structure overshadow small structure changes at the inhibitor binding site, making it difficult to use this method to assess structural changes at the inhibitor binding site. In this manuscript, we used traditional 15N-half filtered NOESY, and 2D water-NOE to verify the results, and to investigate protein-inhibitor interactions proximal to the inhibitor binding site (Fig. 3 and 5). A key point of the 15N half-filtered NOESY experiments is to detect NOEs from inhibitor, labile side chain protons, and water that are expected to be important in protein-ligand interactions and hydration [14,20–32]. For these purposes, we did not apply a 13C-half filter using a 13C-labeled protein, to avoid any residual aliphatic 13C-H protein signals that may overlap with the inhibitor signals. Although hydration water molecules on a protein surface are in general short-lived [52,53], interior water molecules at the protein-inhibitor interface are likely long-lived. Indeed, even when inhibitor structures are similar to each other, water-protein NOEs appeared differently in the NMR spectra. As demonstrated above, PR-inhibitor complex structures are needed to understand the details of the NOE and exchange effects. Such information will be useful to understand conformational differences among highly analogous inhibitor-bound forms of a protein in solution.
5. Conclusion
In conclusion, we demonstrated conformational differences near the inhibitor binding site among highly analogous inhibitor-bound forms of HIV-1 PR, which we could not study in the previous work [18]. Consistent to the previous studies [14] [29], significant inhibitor interaction with the PR residues and water-NH interactions were observed. We also observed water-NH NOEs, asymmetrically detected in subunit A or B and differently detected between DRV- and U10- bound forms. Finally, we discussed an NMR strategy to investigate conformational differences in protein-inhibitor complexes, when the inhibitors all tightly bind to a protein at sub-nanomolar dissociation constants and are highly analogous to each other.
Supplementary Material
Acknowledgments
We thank Josh A. Wand, Celia Schiffer, and Florian Leidner for discussion, and Teresa Brosenitsch and Andrew P. Hinck for critical reading. The project is supported by NIH P01GM109767.
Footnotes
References
- 1.Wlodawer A, Erickson JW. Structure-based inhibitors of HIV-1 protease. Annu Rev Biochem. 1993;62:543–585. doi: 10.1146/annurev.bi.62.070193.002551. [DOI] [PubMed] [Google Scholar]
- 2.Ghosh AK, Chapsal BD, Weber IT, Mitsuya H. Design of HIV protease inhibitors targeting protein backbone: an effective strategy for combating drug resistance. Acc Chem Res. 2008;41:78–86. doi: 10.1021/ar7001232. [DOI] [PubMed] [Google Scholar]
- 3.Lv Z, Chu Y, Wang Y. HIV protease inhibitors: a review of molecular selectivity and toxicity. HIV AIDS (Auckl) 2015;7:95–104. doi: 10.2147/HIV.S79956. [DOI] [PMC free article] [PubMed] [Google Scholar]
- 4.Macalino SJ, Gosu V, Hong S, Choi S. Role of computer-aided drug design in modern drug discovery. Arch Pharm Res. 2015;38:1686–1701. doi: 10.1007/s12272-015-0640-5. [DOI] [PubMed] [Google Scholar]
- 5.Ghosh AK, Osswald HL, Prato G. Recent Progress in the Development of HIV-1 Protease Inhibitors for the Treatment of HIV/AIDS. J Med Chem. 2016;59:5172–5208. doi: 10.1021/acs.jmedchem.5b01697. [DOI] [PMC free article] [PubMed] [Google Scholar]
- 6.King NM, Prabu-Jeyabalan M, Nalivaika EA, Schiffer CA. Combating susceptibility to drug resistance: lessons from HIV-1 protease. Chem Biol. 2004;11:1333–1338. doi: 10.1016/j.chembiol.2004.08.010. [DOI] [PubMed] [Google Scholar]
- 7.Surleraux DL, de Kock HA, Verschueren WG, Pille GM, Maes LJ, Peeters A, Vendeville S, De Meyer S, Azijn H, Pauwels R, de Bethune MP, King NM, Prabu-Jeyabalan M, Schiffer CA, Wigerinck PB. Design of HIV-1 protease inhibitors active on multidrug-resistant virus. J Med Chem. 2005;48:1965–1973. doi: 10.1021/jm049454n. [DOI] [PubMed] [Google Scholar]
- 8.Agniswamy J, Shen CH, Aniana A, Sayer JM, Louis JM, Weber IT. HIV-1 protease with 20 mutations exhibits extreme resistance to clinical inhibitors through coordinated structural rearrangements. Biochemistry. 2012;51:2819–2828. doi: 10.1021/bi2018317. [DOI] [PMC free article] [PubMed] [Google Scholar]
- 9.Ghosh AK, Yu X, Osswald HL, Agniswamy J, Wang YF, Amano M, Weber IT, Mitsuya H. Structure-based design of potent HIV-1 protease inhibitors with modified P1-biphenyl ligands: synthesis, biological evaluation, and enzyme-inhibitor X-ray structural studies. J Med Chem. 2015;58:5334–5343. doi: 10.1021/acs.jmedchem.5b00676. [DOI] [PMC free article] [PubMed] [Google Scholar]
- 10.Cai Y, Yilmaz NK, Myint W, Ishima R, Schiffer CA. Differential Flap Dynamics in Wild-type and a Drug Resistant Variant of HIV-1 Protease Revealed by Molecular Dynamics and NMR Relaxation. J Chem Theory Comput. 2012;8:3452–3462. doi: 10.1021/ct300076y. [DOI] [PMC free article] [PubMed] [Google Scholar]
- 11.Nalam MN, Ali A, Reddy GS, Cao H, Anjum SG, Altman MD, Yilmaz NK, Tidor B, Rana TM, Schiffer CA. Substrate envelope-designed potent HIV-1 protease inhibitors to avoid drug resistance. Chem Biol. 2013;20:1116–1124. doi: 10.1016/j.chembiol.2013.07.014. [DOI] [PMC free article] [PubMed] [Google Scholar]
- 12.Cai Y, Myint W, Paulsen JL, Schiffer CA, Ishima R, Kurt Yilmaz N. Drug Resistance Mutations Alter Dynamics of Inhibitor-Bound HIV-1 Protease. J Chem Theory Comput. 2014;10:3438–3448. doi: 10.1021/ct4010454. [DOI] [PMC free article] [PubMed] [Google Scholar]
- 13.Ragland DA, Nalivaika EA, Nalam MN, Prachanronarong KL, Cao H, Bandaranayake RM, Cai Y, Kurt-Yilmaz N, Schiffer CA. Drug resistance conferred by mutations outside the active site through alterations in the dynamic and structural ensemble of HIV-1 protease. J Am Chem Soc. 2014;136:11956–11963. doi: 10.1021/ja504096m. [DOI] [PMC free article] [PubMed] [Google Scholar]
- 14.Paulsen JL, Leidner F, Ragland DA, Yilmaz NKurt, Schiffer CA. Interdependence of Inhibitor Recognition in HIV-1 Protease. J Chem Theory Comput. 2017;13:2300–2309. doi: 10.1021/acs.jctc.6b01262. [DOI] [PMC free article] [PubMed] [Google Scholar]
- 15.Kohl NE, Emini EA, Schleif WA, Davis LJ, Heimbach JC, Dixon RA, Scolnick EM, Sigal IS. Active human immunodeficiency virus protease is required for viral infectivity. Proc Natl Acad Sci U S A. 1988;85:4686–4690. doi: 10.1073/pnas.85.13.4686. [DOI] [PMC free article] [PubMed] [Google Scholar]
- 16.Oroszlan S, Luftig RB. Retroviral proteinases. Curr Top Microbiol Immunol. 1990;157:153–185. doi: 10.1007/978-3-642-75218-6_6. [DOI] [PubMed] [Google Scholar]
- 17.Koh Y, Nakata H, Maeda K, Ogata H, Bilcer G, Devasamudram T, Kincaid JF, Boross P, Wang YF, Tie Y, Volarath P, Gaddis L, Harrison RW, Weber IT, Ghosh AK, Mitsuya H. Novel bis-tetrahydrofuranylurethane-containing nonpeptidic protease inhibitor (PI) UIC-94017 (TMC114) with potent activity against multi-PI-resistant human immunodeficiency virus in vitro. Antimicrob Agents Chemother. 2003;47:3123–3129. doi: 10.1128/AAC.47.10.3123-3129.2003. [DOI] [PMC free article] [PubMed] [Google Scholar]
- 18.Khan SN, Persons JD, Paulson JL, Guerrero M, Schiffer CA, Kurt-Yilmaz N, Ishima R. Probing Structural Changes among Analogous Inhibitor-Bound Forms of HIV-1 Protease and a Drug-Resistant Mutant in Solution by NMR. Biochemistry. 2018 doi: 10.1021/acs.biochem.7b01238. [DOI] [PMC free article] [PubMed] [Google Scholar]
- 19.Yamazaki T, Nicholson LK, Torchia DA, Stahl SJ, Kaufman JD, Wingfield PT, Domaille PJ, Campbell-Burk S. Secondary structure and signal assignments of human-immunodeficiency-virus-1 protease complexed to a novel, structure-based inhibitor. Eur J Biochem. 1994;219:707–712. doi: 10.1111/j.1432-1033.1994.tb19987.x. [DOI] [PubMed] [Google Scholar]
- 20.Kortemme T, Morozov AV, Baker D. An Orientation-dependent Hydrogen Bonding Potential Improves Prediction of Specificity and Structure for Proteins and Protein–Protein Complexes. Journal of Molecular Biology. 2003;326:1239–1259. doi: 10.1016/s0022-2836(03)00021-4. [DOI] [PubMed] [Google Scholar]
- 21.Sarkhel S, Desiraju GR. N-H...O, O-H...O, and C-H...O hydrogen bonds in protein-ligand complexes: strong and weak interactions in molecular recognition. Proteins. 2004;54:247–259. doi: 10.1002/prot.10567. [DOI] [PubMed] [Google Scholar]
- 22.Williams MA, Ladbury JE. Hydrogen Bonds in Protein-Ligand Complexes. In: J BH, Schneider G, editors. Protein-Ligand Interactions: From Molecular Recognition to Drug Design Wiley-VCH Verlag GmbH & Co. KGaA; Weinheim, FRG: 2005. pp. 137–161. [Google Scholar]
- 23.Panigrahi SK, Desiraju GR. Strong and weak hydrogen bonds in the protein-ligand interface. Proteins. 2007;67:128–141. doi: 10.1002/prot.21253. [DOI] [PubMed] [Google Scholar]
- 24.Schmidtke P, Luque FJ, Murray JB, Barril X. Shielded hydrogen bonds as structural determinants of binding kinetics: application in drug design. J Am Chem Soc. 2011;133:18903–18910. doi: 10.1021/ja207494u. [DOI] [PubMed] [Google Scholar]
- 25.Li D, Ji B, Hwang KC, Huang Y. Strength of hydrogen bond network takes crucial roles in the dissociation process of inhibitors from the HIV-1 protease binding pocket. PLoS One. 2011;6:e19268. doi: 10.1371/journal.pone.0019268. [DOI] [PMC free article] [PubMed] [Google Scholar]
- 26.Chufan EE, Kapoor K, Ambudkar SV. Drug-protein hydrogen bonds govern the inhibition of the ATP hydrolysis of the multidrug transporter P-glycoprotein. Biochem Pharmacol. 2016;101:40–53. doi: 10.1016/j.bcp.2015.12.007. [DOI] [PMC free article] [PubMed] [Google Scholar]
- 27.Parrish RM, Sitkoff DF, Cheney DL, Sherrill CD. The Surprising Importance of Peptide Bond Contacts in Drug-Protein Interactions. Chemistry. 2017;23:7887–7890. doi: 10.1002/chem.201701031. [DOI] [PubMed] [Google Scholar]
- 28.Helms V, Wade RC. Thermodynamics of water mediating protein-ligand interactions in cytochrome P450cam: a molecular dynamics study. Biophysical Journal. 1995;69:810–824. doi: 10.1016/S0006-3495(95)79955-6. [DOI] [PMC free article] [PubMed] [Google Scholar]
- 29.Wang YX, Freedberg DI, Grzesiek S, Torchia DA, Wingfield PT, Kaufman JD, Stahl SJ, Chang CH, Hodge CN. Mapping hydration water molecules in the HIV-1 protease/DMP323 complex in solution by NMR spectroscopy. Biochemistry. 1996;35:12694–12704. doi: 10.1021/bi9610764. [DOI] [PubMed] [Google Scholar]
- 30.Lu Y, Yang CY, Wang S. Binding free energy contributions of interfacial waters in HIV-1 protease/inhibitor complexes. J Am Chem Soc. 2006;128:11830–11839. doi: 10.1021/ja058042g. [DOI] [PubMed] [Google Scholar]
- 31.Michel J, Tirado-Rives J, Jorgensen WL. Energetics of displacing water molecules from protein binding sites: consequences for ligand optimization. J Am Chem Soc. 2009;131:15403–15411. doi: 10.1021/ja906058w. [DOI] [PMC free article] [PubMed] [Google Scholar]
- 32.Weber IT, Agniswamy J. HIV-1 Protease: Structural Perspectives on Drug Resistance. Viruses. 2009;1:1110–1136. doi: 10.3390/v1031110. [DOI] [PMC free article] [PubMed] [Google Scholar]
- 33.Grzesiek S, Bax A. Measurement of amide proton exchange rates and NOEs with water in 13C/15N-enriched calcineurin B. J Biomol NMR. 1993;3:627–638. doi: 10.1007/BF00198368. [DOI] [PubMed] [Google Scholar]
- 34.Delaglio F, Grzesiek S, Vuister GW, Zhu G, Pfeifer J, Bax A. NMRPipe: a multidimensional spectral processing system based on UNIX pipes. J Biomol NMR. 1995;6:277–293. doi: 10.1007/BF00197809. [DOI] [PubMed] [Google Scholar]
- 35.Mori S, Berg JM, van Zijl PCM. Separation of intramolecular NOE and exchange peaks in water exchange spectroscopy using spin-echo filters. Journal of Biomolecular NMR. 1996;7:77–82. doi: 10.1007/BF00190459. [DOI] [PubMed] [Google Scholar]
- 36.Vranken WF, Boucher W, Stevens TJ, Fogh RH, Pajon A, Llinás M, Ulrich EL, Markley JL, Ionides J, Laue ED. The CCPN Data Model for NMR Spectroscopy: Development of a Software Pipeline, Proteins: Structure. Function, and Bioinformatics. 2005;59:687–696. doi: 10.1002/prot.20449. [DOI] [PubMed] [Google Scholar]
- 37.Phillips JC, Braun R, Wang W, Gumbart J, Tajkhorshid E, Villa E, Chipot C, Skeel RD, Kale L, Schulten K. Scalable molecular dynamics with NAMD. J Comput Chem. 2005;26:1781–1802. doi: 10.1002/jcc.20289. [DOI] [PMC free article] [PubMed] [Google Scholar]
- 38.Nicholson LK, Yamazaki T, Torchia DA, Grzesiek S, Bax A, Stahl SJ, Kaufman JD, Wingfield PT, Lam PY, Jadhav PK, et al. Flexibility and function in HIV-1 protease. Nat Struct Biol. 1995;2:274–280. doi: 10.1038/nsb0495-274. [DOI] [PubMed] [Google Scholar]
- 39.Skelton NJ, Palmer AG, Akke M, Kordel J, Rance M, Chazin WJ. Practical Aspects of 2-Dimensional Proton-Detected N-15 Spin Relaxation Measurements. Journal of Magnetic Resonance Series B. 1993;102:253–264. [Google Scholar]
- 40.Viles JH, Duggan BM, Zaborowski E, Schwarzinger S, Huntley JJ, Kroon GJ, Dyson HJ, Wright PE. Potential bias in NMR relaxation data introduced by peak intensity analysis and curve fitting methods. J Biomol NMR. 2001;21:1–9. doi: 10.1023/a:1011966718826. [DOI] [PubMed] [Google Scholar]
- 41.Gong Q, Ishima R. 15N-{1H} NOE experiment at high magnetic field strengths. J Biomol NMR. 2007;37:147–157. doi: 10.1007/s10858-006-9125-7. [DOI] [PubMed] [Google Scholar]
- 42.Ferrage F, Cowburn D, Ghose R. Accurate sampling of high-frequency motions in proteins by steady-state (15)N-{(1)H} nuclear Overhauser effect measurements in the presence of cross-correlated relaxation. J Am Chem Soc. 2009;131:6048–6049. doi: 10.1021/ja809526q. [DOI] [PMC free article] [PubMed] [Google Scholar]
- 43.Myint W, Gong Q, Ishima R. Practical aspects of 15N CPMG transverse relaxation experiments for proteins in solution. Concepts Magn Reson. 2009;34A:63–75. [Google Scholar]
- 44.Chen K, Tjandra N. Water proton spin saturation affects measured protein backbone 15N spin relaxation rates. J Magn Reson. 2012;213:151–157. doi: 10.1016/j.jmr.2011.09.042. [DOI] [PMC free article] [PubMed] [Google Scholar]
- 45.Jiang B, Yu B, Zhang X, Liu M, Yang D. A (15)N CPMG relaxation dispersion experiment more resistant to resonance offset and pulse imperfection. J Magn Reson. 2015;257:1–7. doi: 10.1016/j.jmr.2015.05.003. [DOI] [PubMed] [Google Scholar]
- 46.Nageswara Rao R, Ramachandra B, Santhakumar K. RP-HPLC separation and characterization of unknown impurities of a novel HIV-protease inhibitor Darunavir by ESI-MS and 2D NMR spectroscopy. J Pharm Biomed Anal. 2013;75:186–191. doi: 10.1016/j.jpba.2012.10.022. [DOI] [PubMed] [Google Scholar]
- 47.Pearl L, Blundell T. The active site of aspartic proteinases. FEBS Letters. 1984;174:96–101. doi: 10.1016/0014-5793(84)81085-6. [DOI] [PubMed] [Google Scholar]
- 48.Pearl LH, Taylor WR. A structural model for the retroviral proteases. Nature. 1987;329:351–354. doi: 10.1038/329351a0. [DOI] [PubMed] [Google Scholar]
- 49.Collins JR, Burt SK, Erickson JW. Flap Opening in Hiv-1 Protease Simulated by Activated Molecular-Dynamics. Nature Structural Biology. 1995;2:334–338. doi: 10.1038/nsb0495-334. [DOI] [PubMed] [Google Scholar]
- 50.Freedberg DI, Ishima R, Jacob J, Wang YX, Kustanovich I, Louis JM, Torchia DA. Rapid structural fluctuations of the free HIV protease flaps in solution: relationship to crystal structures and comparison with predictions of dynamics calculations. Protein Sci. 2002;11:221–232. doi: 10.1110/ps.33202. [DOI] [PMC free article] [PubMed] [Google Scholar]
- 51.Ishima R, Freedberg DI, Wang YX, Louis JM, Torchia DA. Flap opening and dimer-interface flexibility in the free and inhibitor-bound HIV protease, and their implications for function. Structure. 1999;7:1047–1055. doi: 10.1016/s0969-2126(99)80172-5. [DOI] [PubMed] [Google Scholar]
- 52.Halle B. Protein hydration dynamics in solution: a critical survey. Philos Trans R Soc Lond B Biol Sci. 2004;359:1207–1223. doi: 10.1098/rstb.2004.1499. discussion 1223-1204, 1323-1208. [DOI] [PMC free article] [PubMed] [Google Scholar]
- 53.Nucci NV, Pometun MS, Wand AJ. Site-resolved measurement of water-protein interactions by solution NMR. Nat Struct Mol Biol. 2011;18:245–249. doi: 10.1038/nsmb.1955. [DOI] [PMC free article] [PubMed] [Google Scholar]
- 54.Surleraux DL, Tahri A, Verschueren WG, Pille GM, de Kock HA, Jonckers TH, Peeters A, De Meyer S, Azijn H, Pauwels R, de Bethune MP, King NM, Prabu-Jeyabalan M, Schiffer CA, Wigerinck PB. Discovery and selection of TMC114, a next generation HIV-1 protease inhibitor. J Med Chem. 2005;48:1813–1822. doi: 10.1021/jm049560p. [DOI] [PubMed] [Google Scholar]
Associated Data
This section collects any data citations, data availability statements, or supplementary materials included in this article.