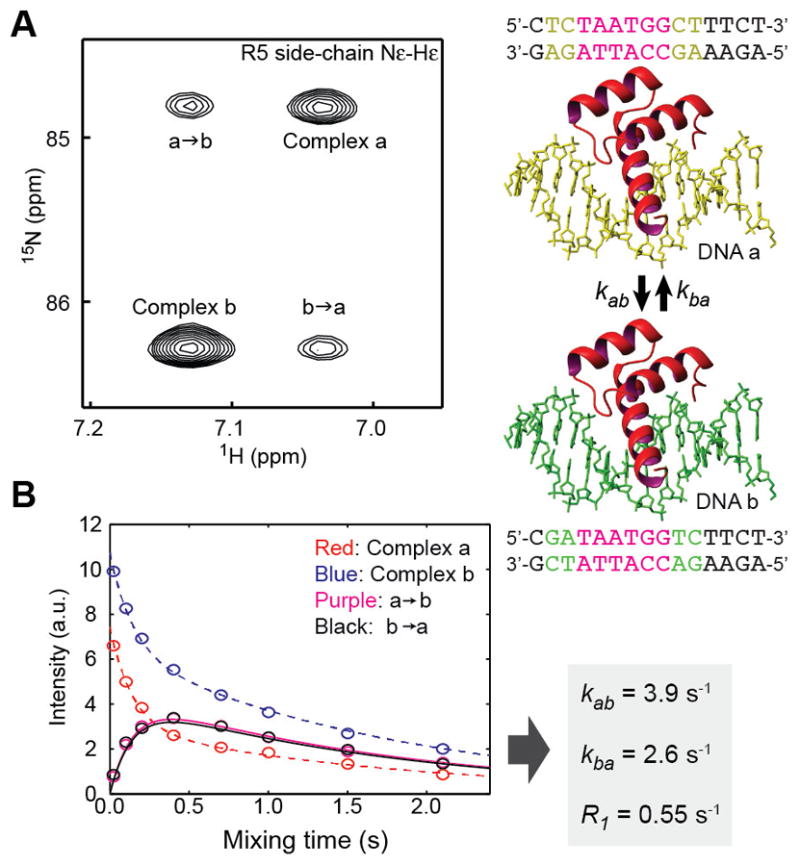
Figure 7.

15N z-exchange data on kinetics of translocation of the Antp homeodomain between the two high-affinity sites on the DNA duplexes a and b [94]. (A) A 1H-15N spectrum recorded in 15N z-exchange experiment. (B) Intensities of the auto and exchange cross peaks as a function of the z-exchange mixing time. The rate constants determined from this dataset are also shown.
