

Highlights
-
•
Signal processing of the SSEP obtained during treatment of carotid artery disease.
-
•
Differences between control and unoperated and operated sides.
-
•
Differences between treatment with open or endovascular approach.
Keywords: Carotid artery, Signal processing, Somatosensory evoked potential
Abstract
Objective
To describe the changes in the shape and topology of the somatosensory evoked potential (SSEP) during carotid endarterectomy, with particular reference to the time of clamping.
Methods
Routine intraoperative monitoring was performed on 30 patients undergoing carotid endarterectomy (15) or undergoing stenting (15) using median nerve SSEPs. Post-operatively the first and second derivatives of the potential were examined. Separate analysis of the SSEP using wavelets was also performed.
Results
In no instances did changes in the SSEP reach clinical significance. The first derivative showed significant changes that were temporally related to the clamp period. After clamping the ‘velocity’ was higher than baseline. There were changes in the wavelets related to the clamp period with more marked spectral edges at the conclusion of the procedure than baseline. In all instances the patient had a good clinical outcome.
Conclusions
Wavelet and derivative analysis of evoked potentials show changes that are not apparent with measures of amplitude and latency. The clinical relevance of these changes remains uncertain and await larger studies.
Significance
Increased velocity and spectral edges may be markers of increased cerebral blood flow, at least in the setting of pre-existing carotid stenosis.
1. Introduction
Intraoperative Neurophysiological Monitoring (INM) has been used extensively during neurosurgical procedures, including neurovascular procedures, (Cabraja et al., 2009). The use of both electroencephalogram (EEG) and somatosensory evoked potentials (SSEPs) in carotid endarterectomy (CEA) is common place, but remains controversial (Alcantara et al., 2014). It is less usual, but still accepted, during endovascular placement of carotid stents, (Phillips et al., 2014).
The brain is usually supplied by 4 major arteries, with the circle of Willis acting, in part, as a distributor ensuring that all portions of the brain receive blood supply. Removing the supply from one artery, should place a vascular and metabolic strain on the brain, placing the patient at risk of peri-procedural stroke secondary to hypo-perfusion of the vascular territory. In situations in which the carotid artery is chronically stenotic secondary to atherosclerotic changes, the brain is likely to be less dependent on the carotid artery for blood supply. Despite the adaptability of the brain, there is still a 2.1% risk of peri-operative major stroke and death with endarterectomy from either a hypoperfusion or embolic etiology, (Ferguson et al., 1999). During the endovascular procedure there is no equivalent of clamping, although there may often be a period of angioplasty which for a brief period of time does occlude the blood supply to the brain, (Saha et al., 2015). In many centres a device is deployed distal to the stent to capture any emboli dislodged during the deployment of the stent or angioplasty. We undertook this research to study and describe the electrophysiologic events of carotid stenting and endarterectomy.
The pathway of the somatosensory evoked potential includes the dorsal spinal columns, and the somatosensory cortex via the thalamus. However, there are many possible sites of modulation of the potential along the pathway. The waveform recorded from scalp electrodes over the somatosensory cortex in response to contralateral stimulation of the median or ulnar nerve consists of a predominantly biphasic waveform with a negative peak approximately 20 ms after the stimulation (N20) followed about 2 ms later by a positive peak (P22). The standard guidelines for neuromonitoring of SSEPs suggest that a 10% increase in latency of the N13-N20 peak or a 50% decrease in amplitude of the N20-P22 complex is significant for neural damage, (Cruccu et al., 2008, Nuwer et al., 2012). An alternative strategy for assessing changes in neuromonitoring involves the comparison of the 2 sides of the brain. An asymmetric change may be considered indicative of neural damage (Alcantara et al., 2014).
The waveform of the SSEP likely includes more information than just amplitude and latency, (Quian Quiroga et al., 2001, Pereda et al., 2005, Brittain et al., 2007). Changes in the voltage per unit of time is equivalent to the velocity of the potential, measured in mV/ms, is the first derivative of the potential [dv/dt]. Analysis of the derivatives of the waveform may provide information concerning the neural mechanisms within the data. As the number of derivatives increases so does the amount of noise (or jitter) which makes analysis increasingly difficult. Changes in waveform may be more easily assessed in domains other than the time domain, such as the frequency domain. The Fourier Transform is the most usual mechanism for transforming data into the frequency domain. The Fourier Transform (in all forms) requires that the waveform be ‘stationary’, (Harris, 1998, Lachaux et al., 2002, Challis and Kitney, 1991). Whilst approaches, such as the Short Fourier Transform, (SFT), have been developed to approximate stationarity, there has been increasing use of specifically non-stationary approaches such as wavelets, (Figiola and Serrano, 1997, van Drongelen, 2007, Pereda et al., 2005). The continuous wavelet allows for time-resolved assessment of spectral information, even at relatively low frequencies. The topology of the waveform can also be decomposed into its principal components (PCA), (Daffertshofer et al., 2004, Cassidy and Penny, 2002, van Drongelen, 2007). In the case of the SSEP, the evoked potential is subject to filtering from the biological tissues between the generators and the recording electrodes. The potential is a result of the summation of many cells firing together. The clinical significance of the waveform topology is unclear at present, despite previous publications from other groups. The purpose of this study therefore was to examine the potential in a situation in which it might change, but not reach clinical significance with standard approaches. To our knowledge this is the first time this type of analysis has been performed when ‘sub-clinical’ changes are expected.
2. Methods
Fifteen patients undergoing CEA at the Royal University Hospital in Saskatoon with routine neuromonitoring were included in the study. Surgeries were performed by one of 2 neurovascular surgeons (MK & LP). The surgeons adopted their standard clinical approach. The surgeons selected patients for either CEA or stenting using their standard clinical judgement and all patients were symptomatic from carotid stenosis. A further 15 patients undergoing endovascular treatment were consecutively recruited. One of two surgeons performed the stenting (MK & LP). Neuromonitoring was performed by a single neurophysiologist (JN) using a Cadwell Cascade Elite system (Cadwell, Kennewick, MA) or a NIM-Eclipse (Medtronic, Jacksonville, FL).
Concurrently 20 patients, age matched to the carotid population, undergoing lumbar spine surgery with neuromonitoring were recruited to serve as controls. Those control patients had no known history of carotid disease, but given the age it is possible that some of them had a degree of asymptomatic carotid stenosis. All of the patients undergoing treatment for carotid artery disease had at least mild stenosis on the un-operated side as assessed by either CT or ultrasound imaging. The study therefore had 4 groups; operated side (15 patients), stented side (15 patients), un-treated side (the non-treated side of the carotid stenosis patients) (30 sides) and the control patients (40 sides).
Stimulation was performed using subdermal needles placed in the skin overlying the median nerve bilaterally. Stimulation pulse widths of 200 µs were used and the pulse amplitude was increased until a maximal twitch was elicited. Scalp recording electrodes were placed at C3 and C4 on the scalp. Additional recording electrodes were placed at the C-spine level and Fz and Cz on the scalp. (EEG recordings were also performed, but are not reported here). Averages of 50 sweeps were recorded allowing for rapid feedback to the surgical team. Stimulation was performed at 4.44 Hz, and a pulse was missed at the end of each average. Signals were filtered prior to capture on the PC (30–3 kHz). Therefore, each average took just 11 ½ seconds to acquire. Sweeps were exported for off-line analysis following the surgical procedure using Matlab (The Mathworks, Natick, MA). Both systems (Cadwell and Medtronic) utilised the same filters and stimulator settings and were used interchangeably.
2.1. Analysis of the SSEP waveform
For the temporal analysis of changes, we marked the unclamp period of the CEA or the deployment of the stent as time 0. There was no defining moment for the control moment, so we determined the placement of the first pedicle screw as time 0. We examined the first and second derivatives of the evoked potential (equivalent to velocity and acceleration) as well as using continuous wavelet analysis. We compared the 2 sides of brain as well as plotting the time course of changes. Fig. 1, which shows a typical SSEP, has the time periods of examination marked. We averaged the first and second derivative data over a minute to reduce the noise in the signal and averaged all of the subjects.
Fig. 1.
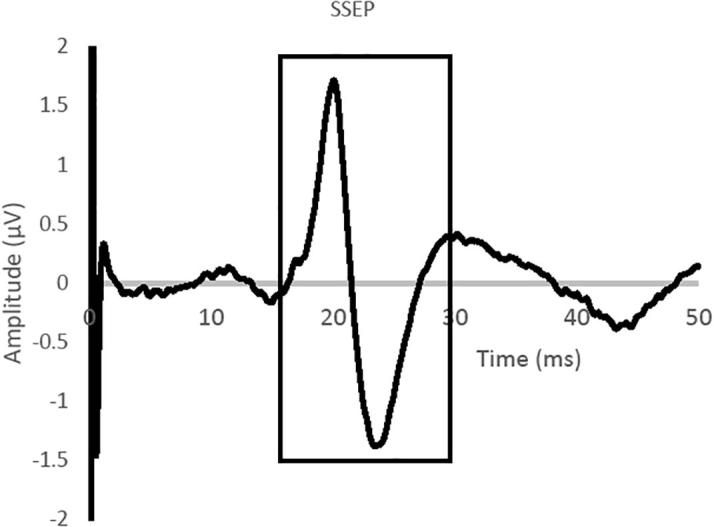
A typical somatosensory evoked potential (SSEP) from median nerve stimulation with recordings from the contralateral somatosensory cortex. The region of the potential which was subjected to wavelet analysis is highlighted in a black solid line. The first and second derivatives were calculated on the ascending phase of the potential (baseline to N20 peak).
Within the wavelet toolbox in Matlab we used the continuous wavelet transform to examine the SSEP and its coefficients. To simplify the analyses we choose two time-points, time zero and 15 min after the release of the clamp or stent-deployment.
3. Results
Fig. 1 illustrates the typical somatosensory evoked potential waveform with the regions of the potential that were examined marked. There were no changes in the amplitude or latency of the SSEPs in the control (spine) patients, or in the untreated side. Changes in the amplitude or latency of the SSEP in both the CEA and stent surgery patients did not reach clinical significance.
3.1. Amplitude and latency
There was a difference between the un-operated side and those potentials in the control group, not known to have carotid stenosis. The amplitude and latency of the SSEP showed minor changes during the clamp period that did not reach clinical significance, but were statistically significant (p < 0.05, paired t-test), Table 1. When the clamp was released the amplitude increased and latency decreased, which again was statistically significant, compared to both clamp and baseline values. Stenting did not have a period of blood flow occlusion, nor did the SSEP latency increase or amplitude decrease. Following the placement of the stent and angioplasty the amplitude increased slightly, but not significantly across the group.
Table 1.
The table shows the amplitude and latency of the N20 peak at various time points during the surgical procedure in patients with carotid stenosis, and at baseline in the lumbar spine surgery patients. The number of arteries is displayed in brackets. The amplitude of the response is shown in microvolts and the latency in milliseconds.
| Control (20) |
Un-operated side (25) |
CEA (15) |
Carotid Stent (10) |
|||||
|---|---|---|---|---|---|---|---|---|
| Amplitude | Latency | Amplitude | Latency | Amplitude | Latency | Amplitude | Latency | |
| Baseline | 3.21 | 20.2 | 2.95 | 20.9 | 2.45 | 21.1 | 2.52 | 21.2 |
| Pre-clamp | 2.97 | 20.9 | 2.51 | 21.1 | 2.50 | 21.1 | ||
| Pre-release | 2.89 | 20.9 | 2.34 | 21.3 | 2.49 | 21.1 | ||
| Closing | 2.99 | 20.9 | 3.10 | 20.8 | 2.89 | 20.9 | ||
3.2. Velocity and acceleration
Observationally the waveforms appear sharper post unclamping. Fig. 2 illustrates the rate of change of the voltage with time in the initial up-swing of the potential (similar to the velocity of the voltage) and the rate of that change with time over the same time frame (acceleration). There is a clear evolution of the velocity with time following the release of the clamp. The period of time following the stent deployment and angioplasty also showed an increase in the velocity of the SSEP. The individual acceleration traces were very noisy, as is often the case with 2nd order derivatives. Averaging the accelerations across subjects allowed for the removal of some of the noise in individual traces and the visualisation of trends across patients, but no statistically different changes were observed.
Fig. 2.

The ‘velocity’, first derivative of the potential related to the time of clamp of the artery or the end of angioplasty (stent). Clamps were placed at −10 min and released at 0 min. The exact time of clamping varied between patients and is normalised over the time period between −10 and 0 min. Monitoring was continued for at least 30 min after the clamp was removed or 15 min after angioplasty completed.
We also observed a difference between the sides of the brain, with the affected side having a slower velocity than the unaffected prior to the procedure, a situation that was reversed at the conclusion of the procedure. Both of these differences were statistically significant (p < 0.05, paired t-test).
3.3. Wavelets
The wavelet transforms of the data showed differences between the clamped and unclamped evoked potentials, which evolved over time since the clamp was removed in all cases. In contrast there is no change in an individual in the pre-clamp period. Post clamp the spectral edges appeared to be sharper as the clamp was released. The individual variations meant that in this analysis there were no statistical differences. In Fig. 3 we show the wavelet-coefficients. Paired t-tests showed a statistical difference (p < 0.05) between clamp release and 15 min later for both the CEA and the stent patients. Additionally there was a statistical difference between the stent and the CEA patients at the post-procedure time point.
Fig. 3.

The principal coefficients of the SSEP at time zero and 15 min after clamp release, or stent deployment and in the control patients. Along the x-axis is the time from stimulation, with the onset of the up-swing occurring at 20 ms, as shown in Fig. 1. There are 6 conditions, CEA (carotid endartectomy) and stent have pre and post conditions and the unoperated and spine (control) patients have just one.
4. Discussion
It is apparent that, in addition to the amplitude and latency of the evoked potential, there is additional information in the waveform itself, (Cruccu et al., 2008). We are able to show, for the first time, that these parameters change during cerebral-vascular procedures. However, although we are able to show that there are changes in some of these parameters we are not able to determine the clinical significance of these parameters in this preliminary study. The study also showed that using these parameters there was a difference between the two approaches to the treatment of carotid stenosis, (Saha et al., 2015).
Using both simple and more complex analysis of the SSEP there are differences between the treated and non-treated side, but significantly between both of these sides and the control population. This indicates that both carotid arteries of patients undergoing treatment are at least partially stenotic when compared to control, age-matched subjects. Additional information may be offered by this new line of analysis of the SSEP waveform, (Nuwer et al., 1994). Some of these techniques have previously been applied to EEG and EMG recordings (Manganotti et al., 2013), but not to clinically acquired evoked potential data in situations in which the potential would be expected to show some changes, (Quian Quiroga et al., 2001, Brittain et al., 2007).
Examining the characteristics of evoked potential waveform offers a method for examining increased information from the signal. The rate of change of the potential during the period leading to the N20 peak, showed changes related to the time since the unclamping. The velocity of the potential is decreased during the clamping period. There is a recovery over a period of a few minutes, and after the procedure we observed that the velocity was higher in the operated side than the un-operated side. Fluctuations in the second derivative were too large to show significant changes in the analysis of single subjects. Group data shows that the following the stent deployment or unclamping the acceleration is higher than baseline. We also observed a change in both hemispheres of the carotid patients, but not in the spine patients. It is usual practice at our institution to ask the anesthetist to deepen the anesthetic to a level just above burst-suppression. This is also done in aneurysm clipping, but not in the lumbar spine surgery. Our unpublished observations indicate that the change in velocity is most-likely related to depth of anesthesia since we do not see changes in spine surgery, but do in aneurysm clippings.
Analysis of the spectral information showed a consistent pattern of changes with the pattern at the completion of the case appearing to be an enhanced pattern of that observed at baseline. There is relatively little variation in the spectrum prior to clamping, whilst a dramatic change is seen when the clamp is removed. The pattern of post-clamp changes must reflect a reperfusion process, which is not immediately obvious by visual inspection of the evoked potential.
This is a preliminary study which has shown that there are changes in the somatosensory evoked potential recorded during carotid endarterectomy and carotid stenosis. These changes follow a time course indicative of a recovery in the cortical function following ischemia induced by the clamping or occlusion of the artery, (Phillips et al., 2014). Changes in both the rate of change (velocity) of the potential and in the wavelet analysis were observed. Future work will relate these changes to functional outcomes. At this stage we are not able to comment on the physiological significance or generators of the coefficients. All patients showed a good clinical outcome, but were not followed in close detail in this preliminary study. Although we are unable to speculate on the clinical significance of these findings in this descriptive study they may offer additional insights into the neurophysiology following revascularisation. Furthermore, these approaches are computable in real-time, either through real-time transfer to a secondary software routine or to a second computer. Many clinical systems for neurophysiology already include Fourier Transform based analysis options and it is realistic in our opinion to expect more computational complex routines to be available in the near future.
Acknowledgements
The authors are grateful to the patients in the study, and the spine surgeons for allowing their patients to be included. Software was used under licence to the University of Saskatchewan.
Financial disclosure
This research received no specific grant from any funding agency in the public, commercial or not-for-profit sectors.
Conflict of interest
The authors declare no conflict of interest.
References
- Alcantara S.D., Wuamett J.C., Lantis J.C., 2ND, Ulkatan S., Bamberger P., Mendes D. Outcomes of combined somatosensory evoked potential, motor evoked potential, and electroencephalography monitoring during carotid endarterectomy. Ann. Vasc. Surg. 2014;28:665–672. doi: 10.1016/j.avsg.2013.09.005. [DOI] [PubMed] [Google Scholar]
- Brittain J., Halliday D., Conway B., Nielsen J. Single-trial multiwavelet coherence in application to neurophysiological time series. IEEE Trans. Biomed. Eng. 2007;54:854–862. doi: 10.1109/TBME.2006.889185. [DOI] [PubMed] [Google Scholar]
- Cabraja M., Stockhammer F., Mularski S., Suess O., Kombos T., Valderrama E. Neurophysiological intraoperative monitoring in neurosurgery: aid or handicap? Neurosurg. Focus. 2009;27:2. doi: 10.3171/2009.7.FOCUS0969. [DOI] [PubMed] [Google Scholar]
- Cassidy M., Penny W. Bayesian nonstationary autoregressive models for biomedical signal analysis. IEEE Trans. Biomed. Eng. 2002;49:1142–1152. doi: 10.1109/TBME.2002.803511. [DOI] [PubMed] [Google Scholar]
- Challis R., Kitney R. Biomedical signal processing. Part 2. The frequency transforms and their inter-relationships. Med. Biol. Eng. Comput. 1991;29:1–17. doi: 10.1007/BF02446290. [DOI] [PubMed] [Google Scholar]
- Cruccu G., Aminoff M., Curio G., Guerit J., Kakigi R., Mauguiere F. Recommendations of the clinical use of somatosensory-evoked potentials. Clin. Neurophysiol. 2008;119:1705–1719. doi: 10.1016/j.clinph.2008.03.016. [DOI] [PubMed] [Google Scholar]
- Daffertshofer A., Lamoth C., Meijer O., Beek P. PCA in studying coordination and variability: a tutorial. Clin. Biomech. (Bristol, Avon) 2004;19:415–428. doi: 10.1016/j.clinbiomech.2004.01.005. [DOI] [PubMed] [Google Scholar]
- Ferguson G.G., Eliasziw M., Barr H.W.K., Clagett G.P., Barnes R.W., Wallace M.C. The North American symptomatic carotid endarterectomy trial: surgical results in 1415 patients. Stroke. 1999;30:1751–1758. doi: 10.1161/01.str.30.9.1751. [DOI] [PubMed] [Google Scholar]
- Figiola A., Serrano E. Analysis of physiological time series using wavelet transforms. IEEE Eng. Med. Biol. Mag. 1997;16:74–79. doi: 10.1109/51.585521. [DOI] [PubMed] [Google Scholar]
- Harris C. The Fourier analysis of biological transients. J Neurosci Methods. 1998;83:15–34. doi: 10.1016/s0165-0270(98)00080-6. [DOI] [PubMed] [Google Scholar]
- Lachaux J., Lutz A., Rudrauf D., Cosmelli D., van Quyen M., Martinerie J. Estimating the time-course of coherence between single-trial brain signals: an introduction to wavelet coherence. Neurophysiol. Clin. 2002;32:157–174. doi: 10.1016/s0987-7053(02)00301-5. [DOI] [PubMed] [Google Scholar]
- Manganotti P., Formaggio E., del Felice A., Storti S.F., Zamboni A., Bertoldo A. Time-frequency analysis of short-lasting modulation of EEG induced by TMS during wake, sleep deprivation and sleep. Front Hum. Neurosci. 2013;7:767. doi: 10.3389/fnhum.2013.00767. [DOI] [PMC free article] [PubMed] [Google Scholar]
- Nuwer M.R., Aminoff M., Desmedt J., Eisen A.A., Goodin D., Matsuoka S. IFCN recommended standards for short latency somatosensory evoked potentials. Report of an IFCN committee. International Federation of Clinical Neurophysiology. Electroencephalogr. Clin. Neurophysiol. 1994;91:6–11. doi: 10.1016/0013-4694(94)90012-4. [DOI] [PubMed] [Google Scholar]
- Nuwer M., Emerson R., Galloway G., Legatt A., Lopez J., Minahan R. Evidence-based guideline update: intraoperative spinal monitoring with somatosensory and transcranial electrical motor evoked potentials: report of the Therapeutics and Technology Assessment Subcommittee of the American Academy of Neurology and the American Clinical Neurophysiology Society. Neurology. 2012;78:585–589. doi: 10.1212/WNL.0b013e318247fa0e. [DOI] [PubMed] [Google Scholar]
- Pereda E., Quirgo R., Bhattacharya J. Nonlinear multivariate analysis of neurophysiological signals. Progr. Neurobiol. 2005;77:1–37. doi: 10.1016/j.pneurobio.2005.10.003. [DOI] [PubMed] [Google Scholar]
- Phillips J., Chalouh N., Jabbour P., Starke R., Bovenzi C., Rosenwasser R. Somatosensory evoked potential changes in neuroendovascular procedures: incidence and association with clinical outcome in 873 patients. Neurosurgery. 2014;75:566–567. doi: 10.1227/NEU.0000000000000510. [DOI] [PubMed] [Google Scholar]
- Quian Quiroga R., Sakowitz O., Basar R., Schurmann R. Wavelet Transform in the analysis of the frequency composition of evoked potentials. Brain Res. Brain Res. Protoc. 2001;8:16–24. doi: 10.1016/s1385-299x(01)00077-0. [DOI] [PubMed] [Google Scholar]
- Saha S.P., Saha S., Vyas K.S. Carotid endarterectomy: current concepts and practice patterns. Int. J. Angiol. 2015;24:223–235. doi: 10.1055/s-0035-1558645. [DOI] [PMC free article] [PubMed] [Google Scholar]
- van Drongelen W. Elsevier Ltd; New York: 2007. Signal Processing for Neuroscientists. [Google Scholar]