

Abstract
The conventional methods for seed quality testing have several limitations as they involve visual assessment and are destructive. In this context, a study was performed to assess the suitability of non-contact, non-destructive type imaging techniques such as visible imaging and X-ray imaging for conducting physical purity, viability and vigour tests of soybean seeds. The seeds that appeared healthy in external surface examination using visible tests as well as in internal assessment using X-ray tests were classified as sound seeds while the other seeds were marked as not-sound seeds. The obtained results were then correlated with the results of the standard germination tests. The high correlation results between the imaging tests and the standard conventional germination tests indicate the effectiveness and usability of the proposed image analysis based technique as an attractive alternative to the existing quality assessment methods for soybean seeds.
Keywords: Visible and X-ray imaging, Soybean seeds, Vigour, Viability, Physical purity
Introduction
Physical purity, genetic purity, seed viability and vigour, seed health, biochemical and moisture determination are the current seed quality testing methods recommended by ISTA-International Seed Testing Association (ISTA 2002). These conventional tests are mostly based on destructive testing of seeds (Brosnan and Sun 2004; Dell’Aquila 2007; Mahajan et al. 2015). Physical purity, viability and vigour are among the essential seed quality characteristics (Basra 1995). The physical purity test determines whether the submitted seed sample conforms to the prescribed quality standard in regards to purity component. The viability tests examine the capacity of the seeds for continued development into mature plant when grown in good quality soil and under favorable conditions. The seed vigour tests determine the level of activity and performance of seed during germination and seedling emergence (ISTA 2002). These properties of seeds are generally examined by human inspection, which has many limitations such as shortage of skilled labor, rising labor costs and can be tedious, laborious, costly, inconsistent and highly subjective (Brosnan and Sun 2004; Dell’Aquila 2007; Du and Sun 2004, 2006; Kannur et al. 2011; Mahajan et al. 2015).
Hence there is a need for the development of seed quality assessment methods that can be performed with higher speed, consistency and accuracy, thereby eliminating the subjective nature of manual inspections (Brosnan and Sun 2002). The interest in machine vision systems in seed technology industry has been growing worldwide due to the increased computing capabilities at much reduced prices, higher processing speed of currently available algorithms and the non-destructive and efficient nature of these technologies (Brosnan and Sun 2002, 2004; Chen et al. 2002; Dell’Aquila 2007, 2009; Du and Sun 2004, 2006; Gunasekaran 1996; Kannur et al. 2011; Mahajan et al. 2015). Morphological, color and texture features are commonly employed as features of interest in the decision making process (Brosnan and Sun 2002; Chen et al. 2002; Du and Sun 2004).
Soybean seed (Glycine max) that is of legume species, and is of great ecological and economic importance, was selected in this study to assess its quality using alternative imaging techniques (Mahajan et al. 2015; Tiwari 2012; Vance 2001). Among the numerous methods which have been proposed for leguminous seed quality evaluation, visible imaging proved a great potential for visualization of defects or any other abnormality on its external surface, size, color or different external surface characteristics (Dell’Aquila 2007; Du and Sun 2004; Mahajan et al. 2015). One of the visible imaging technique is the CCD camera system developed as a 2-D or 3-D surface image acquisition method for automatic inspection of legume seeds (Du and Sun 2004; Gunasekaran et al. 1988; Kilic et al. 2007). Although numerous technical publications have reported the use of CCD camera systems as acquisition devices, however, the success of such systems require careful design consideration of several imaging aspects that include: the type of the illumination and camera system, the nature of the imaging chamber, and the distance between the source, the sample and the camera system. The commonly occurring errors in camera systems include inter-reflections, color inconstancies, highlights, shadows of nearby objects, etc., some of which can be avoided by using a flat-bed scanner (Mahajan et al. 2015).
Dell’Aquila (2006) investigated the color images of lentils acquired by a scanner to relate the germination rate of the lentils with the color changes of its seed coat. The lentils used in this study were subjected to deterioration and the area of the seed, the aspect factor (i.e. the ratio between the longer axis and the shorter axis of the ellipse equivalent to the seed area) and the intensity values of red, green and blue components of single seeds were measured. In the research published by Shahin and Symons (2001), an online machine vision system was described that could grade large green lentils by their color and texture attributes. Color and texture were found to be the true predictors of the color grade of large green lentils as per the guidelines of Canadian Grain Commission. Geneve and Dutt (2008) studied seed germination and dormancy of Honeylocust seeds by developing a sequential imaging system based on a flat-bed scanner. The authors reported a destructive testing method as they measured the increase in seed size until radicle emergence and seedling size for excised redbud embryos using the gray scale images of seeds and seedlings.
Seed radiography enables the assessment of internal mechanical damage in soybean seeds that may be caused by pre and post-harvest adverse factors (Kotwaliwale et al. 2011; Pinto et al. 2012). X-ray imaging based methods are reported in the literature to detect the damages caused by mechanical stress and stinkbugs in soybean seeds (Pinto et al. 2009, 2012). Moreover, radiography test is also being used in quarantine departments for detection of internal insect infestations in seeds and grains, which are either imported or exported (Ramakrishnan et al. 2012).
Most of the imaging techniques reported in the literature were employed to study one or more properties of legume seeds. However, very few of this published literature actually focused on determining the quality of the legume seed as per the standard definitions. Hence, this work attempts to address this gap by focusing on the visible imaging and X-ray imaging tests in combination for evaluating the quality of leguminous seeds, as per the existing standard guidelines. The proposed techniques are an efficient and cost-effective alternative to the existent physical purity, viability and vigour tests. In other words, the novelty of the present research work was to assess the potential of proposed techniques as a viable comprehensive alternative to the existing standard tests for conducting quality assessment of soybean seeds. The additional uniqueness of our work involves the utilization of the internal vascular structural details of the seeds in determining the vigour of the seeds.
Materials and methods
The methodology for performing the visible and the X-ray imaging tests for assessing the quality of soybean seeds is a two-stage process. In the first stage (Stage-I), the external surface properties of the seeds are thoroughly examined using visible imaging techniques. The seeds that are found to be healthy in outer surface examination are marked as SOUND-1 seeds and the rest of seeds are grouped as NOT-SOUND-1 seeds. The SOUND-1 seeds are further tested in the second stage (Stage–II) using X-ray imaging technique. The seeds in this stage are marked as either SOUND-2 or NOT-SOUND-2 seeds depending on their internal examination. In this stage, the presence of any cracks, mechanical damages and insect infestations are looked for and the seeds having such internal defects are classified as NOT-SOUND-2 seeds. The SOUND-2 seeds are categorized as the final sound class whereas the NOT-SOUND-1 and NOT-SOUND-2 seeds are marked as the final not-sound class.
Sample preparation
For this study, soybean seeds of variety SL525 of 2013/2014 growing season were used for experimentation. The seeds were obtained from Punjab Agricultural University (PAU), Ludhiana, a premier agricultural university in India. The initial moisture content of the seed was approximately 9%, which was determined using the high constant temperature based oven-drying method. During the time of testing, seeds were kept in a controlled environment as per the recommended guidelines of PAU, Ludhiana for soybean seed storage. The seed samples used in this study were benchmarked into ISTA defined categories such as sound, shriveled, damaged etc. by the seed experts working at PAU, Ludhiana as shown in Fig. 1a. Standard germination tests were conducted to evaluate the seed viability and vigour of the selected seed samples. The total number of chosen seeds for experimentation was 592.
Fig. 1.
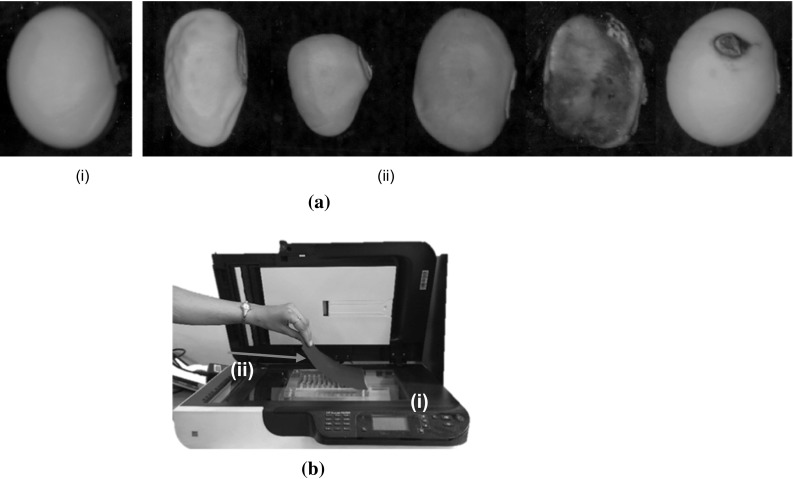
a Single frame color image of (i) sound and (ii) not-sound soybean seeds; b experimental set-up for visible imaging test (Stage-I) used in this study: (i) flat-bed scanner; and (ii) sample holder
Stage-I (visible imaging) tests: image acquisition
Our study involved acquiring images of both sides of soybean seeds using a flat-bed scanner (HP Scanjet Automatic Document Feeder C7716A) in true color mode. Before acquiring the sample images, the scanner was calibrated for color matching by using an Edmund Optics-color scanner test target. In the calibration process, a color image of the white patch of the standard test target was acquired and a small region in the acquired image was selected for computation of the mean red, green and blue component values. By adjusting the calibration parameters of the scanner, the mean values of the three color channels within the selected small region, were mapped to a value of 255. This adjustment ensured that the scanner was color calibrated with respect to the white patch. The scanner resolution was set to 600 dpi.
A sample holder consisting of transparent sheet and a black sheet of paper was placed on the glass plate of the scanner and seeds were placed in a way that they neither overlap nor touch one another as shown in Fig. 1b. This type of arrangement of the seeds ensured the correctness of positioning and orientation of the seeds for accurately capturing external and internal features, especially since the seeds are having non-flat base and are ellipsoidal.
Stage-I (visible imaging) tests: image processing
For quantitative analysis of the images acquired in this study, image processing operations were performed in MATLAB R2014b (Gonzalez et al. 2010; Guide 1998). Images obtained from a scanner are usually corrupted with Gaussian and impulse noise. In this study, the acquired images were denoised using a vector based hybrid denoising filter (Gabbouj and Cheikh 1996). Additionally, edge weighing based color constancy method was employed for removal of inconsistencies due to varying spectral characteristics of the acquisition device (Mahajan et al. 2017).
In this study, the original RGB (color) image was converted into binary image using the chroma-assisted segmentation technique. This consists of converting the RGB image to a Hue band image using Eq. (1) (Gonzalez et al. 2010) and obtaining a threshold value using the histogram of the hue band to segment the seed samples and background.
| 1 |
The errors in the thresholded image were suppressed using mathematical morphology of open, close, dilation and erosion operation. The ‘disk’ was the structuring element used in these operations. Finally, the original seed pixel values were mapped on the binary image and the soybean seed images were obtained as shown in Fig. 2a.
Fig. 2.

a Results of the chroma-assisted segmentation process: (i) the original images of both sides of a seed and (ii) the segmented images of both sides of the same seed; and b the labelled image of both sides of seeds: (i) side 1 and (ii) side 2
Once the seeds were accurately segmented, then they were labelled using our developed algorithm, which was based on the centroid of the seeds. Figure 2b shows the labeled image of both sides of some of the seeds under consideration. A labeled matrix was used to obtain the pixel coordinate data about each sample using the region props function of MATLAB, which was aggregated in a separate MATLAB data structure.
Stage-I (visible imaging) tests: feature extraction
Shape and size features The morphological properties of soybean seeds are being used to indicate the presence of surface irregularities and the degree of damage. The shape and size features of the immature, shriveled and seed-coat damaged seeds differ considerably from those of sound seeds. For quantification of a seed shape and size, 16 parameters were measured from an image of any one side of the kernel as summarized in Table 1.
Table 1.
Shape and size feature parameters of the studied soybean seeds
| No. | Feature parameter | Definition |
|---|---|---|
| 1. | Perimeter | The number of seed boundary pixels |
| 2. | Area | The total number of pixels inside the seed |
| 3. | Length of standard minimum enclosing rectangle (SMRE) | Length of the smallest rectangle containing the seed region |
| 4. | Width of standard minimum enclosing rectangle (SMRE) | Width of the smallest rectangle containing the seed region |
| 5. | Length of principal axis (PA) | Length of the line that passes through the centroid of the seed region and has minimum sum of distance to all target contour pixels |
| 6. | Length of minor axis (MA) | The length of the line that passes through the centroid of the seed region and has maximum sum of distance to all target contour pixels |
| 7. | Minimum radius | The minimum radius of the seed region |
| 8. | Maximum radius | The maximum radius of the seed region |
| 9. | Mean radius | The mean of the radii of the seed region |
| 10. | Variance of radius | The variance of the radii of the seed region |
| 11. | Rectangular ratio | Length/width |
| 12. | Aspect ratio | Length of PA/length of MA |
| 13. | Area ratio | (Length × width)/area |
| 14. | Radius ratio | Maximum radius/minimum radius |
| 15. | Thinness ratio | perimeter2/area |
| 16. | Haralick ratio | Mean radius/SD of radius |
Color features These set of features are different and distinct for fungal-infected, insect-damaged and immature seeds. Red, green and blue channel intensity information of the seeds was extracted using the pixel coordinates. In this study, a total of 51 color features were examined: 27 statistical features (mean intensity, variance and range) and 24 color moment based features were computed for each kernel (both sides). In this paper, the following formulations were used to calculate the color moments:
The central moment of order (p + q) of a digital image f(x, y) of size M × N is defined as
| 2 |
where p = 0,1, 2,… and q = 0, 1, 2,… are integers.
| 3 |
The normalized central moments, denoted by , are defined as
| 4 |
where
| 5 |
for p + q = 2, 3,….
A set of four invariant moments are derived from the second and third moments.
| 6 |
| 7 |
| 8 |
| 9 |
Texture features The texture of the sound soybean seeds is significantly different from that of the shriveled and damaged seeds. These seeds have rough and irregular texture. In thus study, texture have been quantitatively described using 30 texture features based on a Gray Level Co-Occurrence Matrix (GLCM) (Gonzalez et al. 2010). The texture features were computed for each side of the kernel for each color channel of the RGB color image. In this study, the texture descriptors calculated from the GLCM were homogeneity, contrast, correlation, energy and entropy for angles 0°, 45°, 90° and 135° according to the following formulations:
| 10 |
| 11 |
| 12 |
| 13 |
| 14 |
where is the number of gray-level co-occurrence matrices in GLCM. , and , are the means and standard deviations of and .
Stage-I (visible imaging) tests: feature selection
Selection of a subset of optimal features from a larger feature set is a critical step for achieving high accuracy rates in any classification problem. Additionally, dimensionality reduction in the feature set is required for reducing processing requirements. However, a priori knowledge of the optimal features is often not available, especially while working with real-world non-linear problems. Both the above issues, namely, the identification of the optimal features and selection of only those optimal features, may be addressed by projecting the original data set of higher dimension to a lower dimensional data space. Principal Component Analysis (PCA) is one such technique that is commonly employed for achieving dimensionality reduction. However, the fundamental question that remains to be answered in any dimensionality reduction technique is “what is the optimal reduction in dimensions possible with the given data set?”. Any method that achieves dimensionality reduction of the data set should take into account not only the goodness of fit between the model with lower dimensions and the actual problem but also the complexity required to achieve that fit. In other words, when reducing dimensions of a given dataset, we should strike a balance between the number of dimensions reduced and the ability of the transformed data in reduced dimensions to accurately represent the original problem. A model with an insufficient number of features cannot represent the original problem accurately enough. On the other hand, a model with too many features has higher complexity than it should have to represent the original problem.
In this study, we extracted three different feature sets from the seed images: 16 features for shape and size; 51 color features and 30 texture features. A PCA prediction model was created for each feature set using STATISTICA ver. 12 software package. The optimal complexity of each PCA model (in other words, the optimal number of principal components) was obtained by computing the predicted variation (Q2) for each feature set. The each PCA model was computed using the non-linear iterative partial least squares (NIPALS) algorithm with the v-fold method of cross-validation. The NIPALS algorithm is an iterative procedure that computes principal components for representing multivariate variables and provides numerically more accurate results as compared to other methods such as the technique of decomposition of covariance.
For building the PCA model, it was assumed that the input features were continuous functions. In the STATISTICA software, for running the NIPALS algorithm, the maximum number of iterations used for extracting a single component of the PCA model was set to be 50 and the value of the convergence criteria was set at 0.0001 for accurately calculating the principal components. In this study, the “v” value for the v-fold cross-validation method was set at 7. The data preprocessing functionality was used for each PCA model building, which enabled the scaling of the input data for reducing superficial variability in the dataset. The scaling factor of one standard deviation for all the input variables was selected for this purpose.
The PCA model for each feature set was first constructed and then analyzed. Using the predicted variation (Q2) of each feature set, the optimal number of principal components was computed. Using the variable importance information from the optimal principal components, the optimal real-world features were selected for each feature set.
Stage-II (X-ray imaging) tests: image acquisition
X-ray imaging tests in Stage-II were carried out on the SOUND-1 seeds. The tests were performed using Kubtec X-ray imaging system (model XPERT 80, USA). The radiation intensity and exposure time used were 25 kV and 40 s, respectively. The seed samples were placed at a distance of 8 cm from the radiation source. The digital X-ray detector array was positioned at a distance of 35 cm from the radiation source.
For X-ray image acquisition, the same sample holder for soybean seeds that was used in Stage-I tests was employed to hold the seeds at a desired distance from the radiation source and in an orientation such that the embryo of the seeds are not in the direct path of the X-rays (Long and Kersten 1936).
Stage-II (X-ray imaging) tests: image processing
In radiographic images of seeds, the internal defects appear markedly differently from the healthy seed tissue. The X-ray images were initially processed to automatically identify the location of the seeds. The individual seed images were cropped and were converted into grayscale images. Median filtering was used to remove the noise present in the grayscale image. In this study, the grayscale image was transformed into a binary image using the histogram thresholding method. This consists of obtaining a threshold value from the histogram of the gray image to segment the seed samples and background. The noise in the intermediate-segmented image was suppressed and the seed defects were enhanced using image morphological operations such as erosion and dilation operation, in which a ‘circular disk’ was employed as the structuring element. Finally, the binary image of the soybean seed was obtained.
Stage-II (X-ray imaging) tests: feature extraction
Crack detection After the X-ray images were segmented, the seed regions were analyzed for presence of cracks and other defects. An algorithm was implemented in which an array was used to keep track of defects detected in the seed images. The array was initialized to be of the same size as the number of seeds in the X-ray image, and each array element was initialized to a value of zero, which indicated that no crack or defect was present in the seed. The index of the array was used to denote a particular seed in the X-ray image. In this study, the cracked regions inside the seed were classified as internal seed defects. The Euler number was calculated for each seed as the difference between the number of objects in the region and the number of holes in those objects. The seeds with − 1 or 0 as Euler number were found to be cracked from inside or said to have a defect. If a defect was found in the “nth” seed, the value of the “nth” element of the array was incremented by one.
Crack location and its impact assignment The location of the cracks may affect the viability and vigour of the seeds. If the crack is located near the embryonic axis, it may hinder the performance of the seed or may even lead to loss of viability and vigour in seeds (De Carvalho et al. 1999). In this study, the impact of the location of the crack was assigned by dividing the seed region into three sub-regions as shown in Fig. 3a. These sub-regions in the X-ray image of a soybean seed were experimentally derived by using the results reported by (Kuensting et al. 2002), in which the biological aspects of a soybean seed using fluorescence imaging were studied as shown in Fig. 3b (Kuensting et al. 2002). The reported study provided the understanding of the structure within the soybean seed and hence helped in the assignment of a numerical value to the impact of the location of the internal cracks in a soybean seed, which is one of the novelties of our study. Different numerical weights were assigned heuristically to the three sub-regions, i.e. Region I, Region II and Region III, based on their presumed importance or role during the germination process.
Fig. 3.

The different illustrations of the soybean seed: a regions in an X-ray image explaining the experimental quantization of the impact of the internal cracks in soybean seed, b fluorescence image of soybean seed with the veins of the cotyledon and embryo visible (Kuensting et al. 2002)
Once the crack in the seed was detected, the seed image was aligned in an orientation such that its embryo was lying above the hilum towards the right side of the seed as shown in Fig. 3a. Then the major and minor axis of the seed was plotted on the segmented seed image as shown in ‘red’ color in Fig. 3a. The points of intersection of both the axes with the seed boundary were identified, which were marked as ‘A’, ‘B’, ‘C’ and ‘D’. The midpoint ‘M’ between the boundary points ‘B’ and ‘C’ was computed and the points ‘A’ and ‘M’ were joined together and the line AM was extended to meet the seed boundary at point ‘E’. The region ‘ABE’ was said to be the Region I. In this region, the embryo is located. Hence, this is the most critical part of the seed. Hence a small weight of 0.3 on a scale of zero (‘0’) to one (‘1’) was assigned to any crack detected in this region. The rationale behind assigning a low valued weight to any crack or defect in Region I was based on the diminished chances of a successful germination by a seed having a defect in Region I.
The ‘E’ and ‘D’ points were joined together to derive Region II (area between ‘AED’) and Region III as the area between ‘ECD’. The Region II contains the vascular structures (veins) near the embryo. This region is less critical than Region I, yet it is quite significant for the seed to be viable and for having sufficient vigour. Hence a higher weight value of 0.5 was assigned to any crack detected in this region.
The Region III contains the peripheral branching veins away from the embryo. As compared to the regions described previously, this region is less critical in terms of viability and vigour of the seed. Hence a higher weight value of 0.7 was used for this region.
Stage-II (X-ray imaging) tests: germination test
The individual seeds were subjected to the standard germination test (ISTA 2002) to establish the ground truth of the quality of the seeds in terms of its viability and vigour with the level of detected damages associated with loss of soybean seed viability. The SOUND-1 seeds were distributed on germination paper towel and the identity of each seed was recorded. The tests were conducted at 25 °C according to the testing criteria established by ISTA (2002).
Stage-II (X-ray imaging) tests: vigour test
The seed samples possessing low-vigor exhibit poor field emergence (Behtari et al. 2014). Demir and Mavi (2008) reported that the low vigour condition of the seeds might not necessarily be detected by standard germination tests. The same authors in their previous research work demonstrated that the vigor test results correlated well with field emergence potential of the seeds (Mavi and Demir 2007a, b). In this context, for evaluating the vigour of soybean seeds, field emergence tests were conducted using the sound soybean seedlings, which were classified as normal seedlings after the standard germination test by the seed testing experts at PAU, Ludhiana.
Results and discussion
Stage-I (visible imaging) tests: feature selection
In the loading scatter plots of the color and texture features, a noticeable amount of clustering among the variables was found, which indicated that they were correlated and these features influence the PCA model in similar ways. Some of the correlated features were removed to obtain the final optimal PCA model. In this study, all the shape and size features (16), 29 out of 51 color features and 18 out of 30 texture features were selected as the optimum features that contributed in improving the effectiveness of seed quality classification method.
Stage-I (visible imaging) tests: classification
The classification technique used in this research work is a three layered feed forward Artificial Neural Network (ANN) and the system training of Stage-I was performed with 63 morphological, color and texture features that were selected using the PCA approach. A fast supervised learning technique, namely the MLP (Multi-Layer Perceptron) technique was used by the ANN for classification. Out of the 592 seeds, 355 seeds (60% of the total seeds) were randomly selected and were used as a control sample set for training purpose. The remaining 237 seeds were used as testing sample set. The ANN once trained was tested on the testing data set consisting of 237 seed samples of the experimental set. The ANN consisted of a hidden layer of 12 neurons implemented using Broyden Fletcher Goldfarb Shanno (BFGS) algorithm. The error function used is Cross Entropy with TanH and Softmax as hidden and output activation functions respectively. The Stage-I classifier indicated that 167 seeds were of SOUND-1 class and the remaining 70 seeds were classified as NOT-SOUND-1. This result was compared with the ground-truth or the benchmarked data of the testing sample provided by the seed experts at PAU, Ludhiana. The confusion matrix for classification by ANN in Stage-I between the SOUND-1 and the NOT-SOUND-1 seed classes is shown in Table 2.
Table 2.
Confusion matrix for classification by ANN between SOUND-1 and NOT-SOUND-1 seeds at Stage-I
| Total number of seeds tested = 237 | Predicted class: SOUND-1 | Predicted class: NOT-SOUND-1 | ||
|---|---|---|---|---|
| Ground truth of seeds | True class: SOUND-1 | TP: 167 | FN: 21 | TPR, sensitivity, recall = 88.83% |
| True class: NOT-SOUND-1 | FP: 0 | TN: 49 | TNR, specificity = 100% | |
| Accuracy = 91.14% | PPV, precision = 100% | NPV = 70% | F1 score = 0.94 | |
| TP: true positive FN: false negative FP: false positive TN: true negative |
TPR (true positive rate) = TP/(TP + FN) TNR (true negative rate) = TN/(TN + FP) PPV (positive prediction value) = TP/(TP + FP) NPV (negative prediction value) = TN/(TN + FN) Accuracy = (TP + TN)/(TP + TN + FP + FN) F1 score = (2 * TP)/(2*TP + FP + FN) |
|||
In our study, high specificity revealed that the classifier was able to identify all the not-sound seeds. The ability of the classifier to correctly identify all the sound seeds (sensitivity) was also good, and thus the high correlation results between the imaging tests and the standard benchmarked data set reflected the effectiveness and usability of the proposed visible image analysis based technique as an alternative to the existing physical purity test for soybean seeds (Fawcett 2006; Powers 2011).
Stage-II (X-ray imaging) tests: classification
The features extracted from the radiographs of SOUND-1 seeds were given to two different ANN based classifiers (ANN-V1 and ANN-V2). The first ANN based classifier, ANN-V1, was used to classify the seeds in viable or not-viable categories. On the other hand, the second ANN based classifier, ANN-V2, was used to classify the seeds into high or low vigour categories. MLP (Multi-Layer Perceptron) technique was used by the two different ANN based classifiers, and both the system trainings of Stage-II were performed with two features for classifying seeds into two different categories of seed viability and vigour. The ANN-V1 consisted of a hidden layer of 4 neurons and ANN-V2 consisted of a hidden layer of 5 neurons, both implemented using Broyden Fletcher Goldfarb Shanno (BFGS) algorithm. The error function used in both ANNs is Cross Entropy with Logistic and Softmax as hidden and output activation functions respectively.
The classification results obtained in Stage-II were correlated with the ground-truth obtained after conducting the standard viability and vigour tests. In total, 167 SOUND-1 seeds were submitted to the X-ray image analysis test. Out of these, 100 seeds were used as a control sample set for training purpose. The ANN based classifiers once trained were tested on the testing data set consisting of 67 seed samples of the experimental set. The seeds in both the sets were randomly selected for examination. ANN-V1 classifier indicated that 47 seeds were viable and 20 seeds were classified as not-viable. This result was compared with the ground truth obtained by performing standard germination tests (for viability). ANN-V2, on the other hand, indicated that 44 seeds were possessing high vigour and the remaining 23 seeds were not having high vigour. This result was also compared with the ground truth obtained by performing field emergence tests for vigour assessment. The confusion matrices for classification by ANN-V1 and ANN-V2 are shown in Table 3.
Table 3.
Confusion matrix for classification by (a) ANN-V1 between viable and not- viable seeds at Stage-II and (b) ANN-V2 between high vigour and not-high vigour seeds at Stage-II
| (a) Total number of seeds tested = 67 | Predicted class: VIABLE | Predicted class: NOT- VIABLE | ||
|---|---|---|---|---|
| Ground truth of seeds | True class: VIABLE | TP: 46 | FN: 3 | TPR, sensitivity, recall = 93.88% |
| True class: NOT-VIABLE | FP: 1 | TN: 17 | TNR, specificity = 94.44% | |
| Accuracy = 94.03% | PPV, precision = 97.87% | NPV = 85% | F1 score = 0.96 | |
| (b) Total number of seeds tested = 67 | Predicted class: HIGH VIGOUR | Predicted class: NOT-HIGH VIGOUR | ||
|---|---|---|---|---|
| Ground truth of seeds | True class: HIGH VIGOUR | TP: 42 | FN: 5 | TPR, sensitivity, recall = 89.36% |
| True class: NOT-HIGH VIGOUR | FP: 2 | TN: 18 | TNR, specificity = 90% | |
| Accuracy = 89.55% | PPV, precision = 95.45% | NPV = 78.26% | F1 score = 0.92 | |
The seeds that were categorized both as viable and of high vigour were marked as the SOUND-2 class while the remaining seeds were marked as the NOT-SOUND-2 class. The SOUND-2 class consisted of 44 seeds and the remaining 23 seeds were NOT-SOUND-2 seeds. The high sensitivity and specificity results of both the classifiers clearly indicated the effectiveness and usability of the proposed X-ray image analysis based technique as an alternative to the existing viability and vigour test for soybean seeds (Fawcett 2006; Powers 2011).
Conclusion
The results of this study indicate the effectiveness and the usability of the proposed image-analysis based method as an attractive alternative to the standard physical purity, viability and vigour tests. The proposed seed quality testing method does not need any chemical reagent, nor does it employ any tool that may degrade the performance of the seed, so it is a non-destructive method. Moreover, the possibility of evaluating physical purity, viability and vigour of soybean seeds using imaging techniques was demonstrated for the first time. The method is quick, requiring few minutes for the entire operation and also, it is reliable and repeatable.
The proposed method may be used for other seeds and grains, by employing the objective parameters developed in this study. Moreover, our method would significantly contribute to adoption of machine vision based non-destructive testing methods by the seed testing agencies, thereby removing the limitations of human inspections.
Acknowledgements
The authors would like to express sincere gratitude to Director, CSIR-CSIO for providing infrastructural facilities. The authors would like to acknowledge Punjab Agricultural University (PAU), Ludhiana, India (Dr B. S. Gill: for providing soybean seeds of SL525 variety and Director Seeds: for providing assistance to conduct the standard germination tests at their laboratory). One of the author, Shveta Mahajan, acknowledges the grant of SRF-GATE fellowship from Council of Scientific and Industrial Research (CSIR), New Delhi. This study was supported in part by CSIR-CSIO under the network project ASHA, Task 1.4.
References
- Basra AS. Seed quality: basic mechanisms and agricultural implications. Binghamton: Food Products Press; 1995. [Google Scholar]
- Behtari B, De Luis M, Nasab ADM. Predicting germination of Medicago sativa and Onobrychis viciifolia seeds by using image analysis. Turk J Agric For. 2014;38:615–623. doi: 10.3906/tar-1312-40. [DOI] [Google Scholar]
- Brosnan T, Sun D-W. Inspection and grading of agricultural and food products by computer vision systems—a review. Comput Electron Agric. 2002;36:193–213. doi: 10.1016/S0168-1699(02)00101-1. [DOI] [Google Scholar]
- Brosnan T, Sun D-W. Improving quality inspection of food products by computer vision—a review. J Food Eng. 2004;61:3–16. doi: 10.1016/S0260-8774(03)00183-3. [DOI] [Google Scholar]
- Chen Y-R, Chao K, Kim MS. Machine vision technology for agricultural applications. Comput Electron Agric. 2002;36:173–191. doi: 10.1016/S0168-1699(02)00100-X. [DOI] [Google Scholar]
- De Carvalho MLM, Van Aelst AC, Van Eck JW, Hoekstra FA. Pre-harvest stress cracks in maize (Zea mays L.) kernels as characterized by visual, X-ray and low temperature scanning electron microscopical analysis: effect on kernel quality. Seed Sci Res. 1999;9:227–236. [Google Scholar]
- Dell’Aquila A. Red–Green–Blue (RGB) colour density as a non-destructive marker in sorting deteriorated lentil (Lens culinaris Medik.) seeds. Seed Sci Technol. 2006;34:609–619. doi: 10.15258/sst.2006.34.3.08. [DOI] [Google Scholar]
- Dell’Aquila A. Towards new computer imaging techniques applied to seed quality testing and sorting. Seed Sci Technol. 2007;35:519–538. doi: 10.15258/sst.2007.35.3.01. [DOI] [Google Scholar]
- Dell’Aquila A. Digital imaging information technology applied to seed germination testing: a review. In: Lichtfouse E, Navarrete M, Debaeke P, Véronique S, Alberola C, editors. Sustainable agriculture. Dordrecht: Springer; 2009. pp. 377–388. [Google Scholar]
- Demir I, Mavi K. Controlled deterioration and accelerated aging tests to estimate the relative storage potential of cucurbit seed lots. HortScience. 2008;43:1544–1548. [Google Scholar]
- Du C-J, Sun D-W. Recent developments in the applications of image processing techniques for food quality evaluation. Trends Food Sci Technol. 2004;15:230–249. doi: 10.1016/j.tifs.2003.10.006. [DOI] [Google Scholar]
- Du C-J, Sun D-W. Learning techniques used in computer vision for food quality evaluation: a review. J Food Eng. 2006;72:39–55. doi: 10.1016/j.jfoodeng.2004.11.017. [DOI] [Google Scholar]
- Fawcett T. An introduction to ROC analysis. Pattern Recogn Lett. 2006;27:861–874. doi: 10.1016/j.patrec.2005.10.010. [DOI] [Google Scholar]
- Gabbouj M, Cheikh FA (1996) Vector median-vector directional hybrid filter for color image restoration. In: Proceedings of the 1996 European signal processing conference, EUSIPCO 1996, Trieste, Italy
- Geneve RL, Dutt M. Using sequential digital images to study seed germination. Propag Ornam Plants. 2008;8:13–16. [Google Scholar]
- Gonzalez RC, Eddins SL, Woods RE (2010) Morphological reconstruction. Digital image processing using MATLAB, MathWorks
- Guide MUs . The mathworks. Natick: MATLAB Inc; 1998. p. 333. [Google Scholar]
- Gunasekaran S. Computer vision technology for food quality assurance. Trends Food Sci Technol. 1996;7:245–256. doi: 10.1016/0924-2244(96)10028-5. [DOI] [Google Scholar]
- Gunasekaran S, Cooper T, Berlage A. Evaluating quality factors of corn and soybeans using a computer vision system. Trans ASAE. 1988;31:1264–1271. doi: 10.13031/2013.30856. [DOI] [Google Scholar]
- ISTA . ISTA rules. Zurich: International Seed Testing Association; 2002. [Google Scholar]
- Kannur A, Kannur A, Rajpurohit VS. Classification and grading of bulk seeds using Artificial Neural Network. J Comput Appl. 2011;3:62–73. [Google Scholar]
- Kilic K, Boyaci IH, Koksel H, Kusmenoglu I. A classification system for beans using computer vision system and artificial neural networks. J Food Eng. 2007;78:897–904. doi: 10.1016/j.jfoodeng.2005.11.030. [DOI] [Google Scholar]
- Kotwaliwale N, Singh K, Kalne A, Jha SN, Seth N, Kar A. X-ray imaging methods for internal quality evaluation of agricultural produce. J Food Sci Technol. 2011;51:1–15. doi: 10.1007/s13197-011-0485-y. [DOI] [PMC free article] [PubMed] [Google Scholar]
- Kuensting H, Ogawa Y, Sugiyama J. Structural details in soybeans: a new three-dimensional visualization method. J Food Sci. 2002;67:721–724. doi: 10.1111/j.1365-2621.2002.tb10665.x. [DOI] [Google Scholar]
- Long TP, Kersten H. Stimulation of growth of soy bean seeds by soft X-rays. Plant Physiol. 1936;11:615. doi: 10.1104/pp.11.3.615. [DOI] [PMC free article] [PubMed] [Google Scholar]
- Mahajan S, Das A, Sardana HK. Image acquisition techniques for assessment of legume quality. Trends Food Sci Technol. 2015;42:116–133. doi: 10.1016/j.tifs.2015.01.001. [DOI] [Google Scholar]
- Mahajan S, Rani A, Sharma M, Mittal SK, Das A. A pre-processing based optimized edge weighting method for colour constancy. Imag Sci J doi:doi. 2017 [Google Scholar]
- Mavi K, Demir I. Controlled deterioration and accelerated ageing tests to predict seedling emergence of watermelon under stressful conditions and seed longevity. Seed Sci Technol. 2007;35:445–459. doi: 10.15258/sst.2007.35.2.19. [DOI] [Google Scholar]
- Mavi K, Demir I. Controlled deterioration and accelerated aging tests predict relative seedling emergence potential of melon seed lots. HortScience. 2007;42:1431–1435. [Google Scholar]
- Pinto T, Cicero S, Franca-Neto J, Forti V. An assessment of mechanical and stink bug damage in soybean seed using X-ray analysis test. Seed Sci Technol. 2009;37:110–120. doi: 10.15258/sst.2009.37.1.13. [DOI] [Google Scholar]
- Pinto TLF, Mondo VHV, Gomes-Júnior FG, Cicero SM. Image analysis for evaluating mechanical damages in soybean seeds. Pesquisa Agropecuária Tropical. 2012;42:310–316. doi: 10.1590/S1983-40632012000300010. [DOI] [Google Scholar]
- Powers DM. Evaluation: from precision, recall and F-measure 703 to ROC, informedness, markedness and correlation. J Mach Learn Technol. 2011;2:37–63. [Google Scholar]
- Ramakrishnan N, Babu BS, Babu TR. Standardization of X-ray radiography methodology for the detection of hidden infestation in pulses. Indian J Plant Prot. 2012;40:12–18. [Google Scholar]
- Shahin MA, Symons SJ. A machine vision system for grading lentils. Can Biosyst Eng. 2001;43:7. [Google Scholar]
- Tiwari RK (2012) Soybeans grading and marking rules, (Subsection (i) vide notification number G.S.R. 41(E)). Gazette of India, Extraordinary
- Vance CP. Symbiotic nitrogen fixation and phosphorus acquisition. Plant nutrition in a world of declining renewable resources. Plant Physiol. 2001;127:390–397. doi: 10.1104/pp.010331. [DOI] [PMC free article] [PubMed] [Google Scholar]