

Abstract
This study aimed to determine the effect of combinations of blanching parameters, including blanching temperatures ranging from 65 to 85 °C and duration times ranging from 2 to 10 min, on reducing sugars, asparagine, acrylamide, and color levels of fried potato chips. Response surface methodology was used to develop response surface equations to estimate these effects. These latter were evaluated before and after a 3-month storage period of potato tubers at 10 °C. It was found that certain blanching parameters resulted in optimal maximum reductions of 64.2, 49.8, and 61.3% for reducing sugar, asparagine, and acrylamide, respectively. Analysis of variance (ANOVA) determined that blanching time had a more significant impact than blanching temperature. The blanching time that resulted in maximum reductions of asparagine, reducing sugars—and ultimately acrylamide—were in the range of 8.8–9.7 min at 68.7–75.0 °C. ANOVA also determined that after the 3-month storage period of potato tubers, variations in blanching time and temperature did not result in any significant differences in acrylamide formation in fried chips. Blanching consistently improved the appearance of the fried chip products, indicated by increases in L* value and decreases in a* values. The relationship between acrylamide formation and a* value was linear (R2 = 0.839), while the relationship between acrylamide formation and L* value was not (R2 = 0.375).
Keywords: Potato chip, Maillard reaction, Acrylamide, Asparagine, Reducing sugar
Introduction
It is well known that acrylamide is present in a wide range of fried and oven-cooked foods. Acrylamide is considered as a neurotoxic compound and is classified as a probable human carcinogen (Notardonato et al. 2013). Fried potato products, especially chips and French fries, have had the highest recorded concentrations of acrylamide so far (Pedreschi et al. 2007a; Becalski et al. 2004). Therefore, there is an urgent need to investigate novel approaches to reduce the acrylamide content in these foods. Acrylamide is produced when free amino acids, especially asparagine, undergo a Maillard reaction with reducing sugars, such as glucose and fructose, at temperatures above 120 °C (Notardonato et al. 2013). In potato tubers, the amount of free asparagine largely exceeds the amount of reducing sugars. Therefore, the latter is the limiting which determines the degree of acrylamide formation and Maillard browning upon frying (Amrein et al. 2003). A strategy to reduce acrylamide levels in fried potato products is to control the level of these precursors through cultivar selection. Other factors that contribute to the degree of acrylamide formation include harvest location, endogenous L-asparaginase levels, cooking temperature and time (Pedreschi et al. 2005; Zuo et al. 2015).
During fresh potato processing, blanching is a popular strategy used to improve color and texture in the fried product, as well as to reduce the oil uptake by gelatinization of surface starch (Califano and Calvelo 1987; Liu and Scanlon 2007). Blanching is also aimed at inactivating enzymes responsible for browning (polyphenol oxidase and peroxidase) (Mariotti et al. 2015; Mestdagh et al. 2008; Yu et al. 2010), as well as achieving cell separation and leaching out sugars (Kaymak and Kincal 1994). Pedreschi et al. (2004a, b) showed that blanching effectively reduced glucose and asparagine concentrations in potato slices and resulted in significantly lower acrylamide formation compared to a non-blanched control. Pedreschi et al. (2005) reported that a reduction of the sugar content by blanching could reduce the acrylamide concentration by approximately 60% relative to a non-blanched control.
The brown color of fried potato products is primarily the result of the Maillard reaction. Low reducing sugar and asparagine contents are expected to minimize color development during frying of potato chips (Pedreschi et al. 2004a). Color is measured in units L* a* b* using either a colorimeter or specific data acquisition and image processing systems, adopted by the Commission Internationale d’Eclairage (CIE) in 1976. L* is the luminance or lightness component, which ranges from 0 to 100, and parameters a* (from green to red) and b* (from blue to yellow) are the two chromatic components, which range from − 120 to + 120 (Pedreschi et al. 2007b). Pedreschi et al. (2005) reported that acrylamide content had a very good linear relationship with a* value, with the correlation (R2) being greater than 0.95.
The degree of the effect of blanching on acrylamide reduction and color development is mainly considered to depend on blanching temperature and blanching time (Mestdagh et al. 2008). The blanching procedure is typically performed at 65–80 °C for 10–30 min (Kornbrust et al. 2009). It was reported that blanching beyond these temperatures and durations ranges resulted in the reduced quality of products. For examples, Alvarez et al. (2000) and Zuo et al. (2015) reported that blanching at 97 °C produced unacceptable sensory properties, high oil levels and inferior textural characteristics, while Mestdagh et al. (2008) reported that blanching at 55–70 °C for 15–60 min improved the textural quality of French fries and lowered the oil uptake upon frying. Most previous blanching studies were conducted on French fries (Bingol et al. 2014; Mestdagh et al. 2008; Ngobese et al. 2017; Zuo et al. 2015). In our study, we used potato chips as the matrix for investigation. The objectives of this study were to identify how the blanching parameters, i.e., time and temperature, affected the reducing sugar, asparagine, and acrylamide content, and to determine the combinations of blanching temperature and time which resulted in the maximum reduction of acrylamide, asparagine, and reducing sugar, as well as to develop response surface equations to estimate these effects. The blanching conditions used were 65–85 °C and 2–10 min which were considered to be applicable to industrial production. In addition, the effects of potato storage for 3 months at 10 °C on acrylamide, asparagine, and reducing sugar levels were investigated.
Materials and methods
Materials
Potato cultivar ‘Atlantic’ was used in this experiment. It was planted in May and harvested in August, 2016, in Vauxhall, Alberta, Canada (latitude 50°4′ North and longitude 112°6′ West). The harvested tubers were stored in a cooler in the dark at 10 °C and 90% relative humidity. The fresh tuber composition, including asparagine, glucose, fructose, and total reducing sugar, was analyzed in duplicate studies in the Food Quality Laboratory at the Lethbridge Research and Development Centre, Lethbridge, Alberta, Canada.
Potato chip preparation
Potato chips were prepared using conditions of industrial processing. After being stored for 2 months in the dark at 10 °C, eight medium sized potato tubers were selected, washed and peeled. The tubers were sliced into chips approximately 1.5 mm thick. The slices were rinsed immediately after slicing for approximately 1 min in tap water. Twenty uniform slices, which were 7–8 cm in diameter, were randomly selected and blanched in approximately 5 L of water at various combinations of temperature and time as shown in Table 1. A water bath with thermostat was used for the blanching experiments, and water temperature was monitored with thermocouples. After being blanched, the slices were dried in an oven at 60 °C for 6 min with a turn-over after the first 3 min. Several slices from each treatment were collected and stored at − 20 °C for a later asparagine and reducing sugar analysis. About ten dried chips were fried in canola oil at 180 °C for 3 min in a 3.5 L T-fal® fryer (Tefal, Rumilly, Haute-Savoie, France), as previously described (Viklund et al. 2010). After frying, the chips were cooled at room temperature, and then stored in plastic bags at − 20 °C for future acrylamide analysis and colorimetric tests. Control chip samples were prepared following the same procedure, but they were not blanched. This procedure was repeated again after the tubers had been stored for a further 3 months at 10 °C in order to evaluate the effect of storage.
Table 1.
Central composite rotatable design for the experiments and experimental data
| Experimental design points | Blanching temperature (β1, °C) | Blanching time (β2, min) | Before 3-month storage | After 3-month storage | ||||||||
|---|---|---|---|---|---|---|---|---|---|---|---|---|
| Reducing sugar (mg/100 g) | Asparagine (mg/100 g) | Acrylamide (mg/1000 g) | L* | a* | Reducing sugar (mg/100 g) | Asparagine (mg/100 g) | Acrylamide (mg/1000 g) | L* | a* | |||
| Control | – | – | 189.0 ± 10.9 | 123.1 ± 6.0 | 3.1 ± 0.1 | 51.3 ± 2.4 | 7.2 ± 0.2 | 66.3 ± 5.6 | 88.8 ± 18.8 | 2.2 ± 0.1 | 57.5 ± 3.4 | 5.5 ± 0.6 |
| 1 | 67.9 (− 1) | 3.2 (− 1) | 143.4 ± 0.9 | 118.3 ± 4.0 | 2.5 ± 0.1 | 56.6 ± 2.6 | 5.7 ± 0.8 | 49.8 ± 0.0 | 86.6 ± 8.0 | 1.6 ± 0.2 | 50.0 ± 3.1 | 5.9 ± 0.6 |
| 2 | 82.1 (+ 1) | 3.2 (− 1) | 120.5 ± 5.1 | 102.6 ± 0.9 | 2.1 ± 0.1 | 56.4 ± 2.1 | 6.5 ± 0.9 | 64.4 ± 1.4 | 90.2 ± 8.0 | 1.3 ± 0.0 | 56.9 ± 2.4 | 3.3 ± 0.1 |
| 3 | 67.9 (− 1) | 8.8 (+ 1) | 71.30 ± 2.8 | 75.6 ± 13.2 | 1.2 ± 0.1 | 57.2 ± 1.2 | 4.2 ± 0.5 | 35.7 ± 1.5 | 55.4 ± 4.9 | 1.0 ± 0.1 | 57.6 ± 3.9 | 1.4 ± 0.2 |
| 4 | 82.1 (+ 1) | 8.8 (+ 1) | 80.8 ± 1.5 | 86.6 ± 24.1 | 1.5 ± 0.2 | 59.7 ± 2.0 | 3.0 ± 0.1 | 26.1 ± 0.0 | 61.8 ± 4.5 | 1.0 ± 0.0 | 60.9 ± 4.2 | 4.7 ± 0.5 |
| 5 | 75 (0) | 6.0 (0) | 109.2 ± 2.4 | 81.9 ± 12.9 | 1.6 ± 0.0 | 54.7 ± 1.3 | 5.2 ± 1.3 | 32.6 ± 1.3 | 65.6 ± 15.6 | 0.6 ± 0.0 | 62.2 ± 5.0 | 1.4 ± 0.1 |
| 6 | 75 (0) | 6.0 (0) | 93.9 ± 4.9 | 112.8 ± 5.3 | 1.4 ± 0.1 | 55.1 ± 0.8 | 4.2 ± 1.0 | 31.5 ± 2.4 | 55.5 ± 5.9 | 0.9 ± 0.2 | 54.6 ± 3.3 | 3.3 ± 0.4 |
| 7 | 65 (− 1.414) | 6.0 (0) | 104.9 ± 8.3 | 153.2 ± 12.2 | 1.2 ± 0.1 | 56.8 ± 2.0 | 3.7 ± 0.8 | 48.7 ± 4.6 | 80.6 ± 5.0 | 0.6 ± 0.0 | 59.0 ± 2.0 | 1.5 ± 0.7 |
| 8 | 85 (+ 1.414) | 6.0 (0) | 142.1 ± 0.2 | 117.7 ± 15.0 | 1.1 ± 0.2 | 61.1 ± 2.0 | 2.4 ± 0.7 | 26.9 ± 2.4 | 64.4 ± 4.7 | 0.8 ± 0.1 | 59.3 ± 4.3 | 4.0 ± 0.6 |
| 9 | 75 (0) | 2.0 (− 1.414) | 113.1 ± 1.4 | 103.9 ± 3.02 | 1.7 ± 0.2 | 54.5 ± 2.4 | 6.3 ± 0.6 | 84.1 ± 2.8 | 79.6 ± 7.4 | 0.8 ± 0.0 | 55.4 ± 2.8 | 3.9 ± 0.5 |
| 10 | 75 (0) | 10 (1.414) | 94.8 ± 2.1 | 62.5 ± 11.7 | 1.0 ± 0.0 | 55.7 ± 1.6 | 2.8 ± 0.7 | 30.3 ± 0.4 | 42.1 ± 5.9 | 1.1 ± 0.0 | 59.9 ± 1.9 | 1.7 ± 0.3 |
| 11 | 75 (0) | 6.0 (0) | 164.4 ± 3.7 | 102.2 ± 17.9 | 1.5 ± 0.1 | 56.7 ± 2.4 | 4.6 ± 0.9 | 41.2 ± 2.0 | 59.0 ± 4.8 | 0.7 ± 0.0 | 56.6 ± 4.6 | 3.8 ± 0.6 |
| 12 | 75 (0) | 6.0 (0) | 159.1 ± 5.3 | 102.3 ± 7.6 | 1.6 ± 0.1 | 59.4 ± 1.7 | 4.2 ± 0.3 | 30.4 ± 1.2 | 47.9 ± 3.1 | 1.0 ± 0.1 | 58.8 ± 2.7 | 3.7 ± 0.1 |
| 13 | 75 (0) | 6.0 (0) | 166.6 ± 7.6 | 92.0 ± 7.5 | 1.7 ± .01 | 57.7 ± 1.6 | 3.7 ± 0.0 | 28.8 ± 3.1 | 37.7 ± 5.4 | 0.9 ± 0.0 | 58.6 ± 1.9 | 3.8 ± 0.2 |
Central composite rotatable experimental design for the blanching experiments
A five-level-two-factor, central composite rotatable design was applied for studying the effect of blanching temperature and time on acrylamide, its precursor, and colors. The blanching temperature range of 65–85 °C and time range of 2–10 min, which are practical ranges used in industry, were coded by + 1.414, + 1, 0, − 1, and − 1.414, with corresponding actual values of the blanching temperature being 85, 82, 75, 68, and 65 °C, and blanching time being 10, 8.8, 6, 3.2, and 2 min, respectively. All experimental runs are listed in Table 1. There were thirteen treatments in total, including five center points (75 °C and 6 min). The experimental data obtained from the thirteen experimental runs were fitted to the following second order polynomial model (Eq. 1).
| 1 |
where β0, β1, β2, β12, β11, and β22 are coefficients of the function, and X1 and X2 are the coded independent variables, blanching temperature and time, respectively. Y represents acrylamide, asparagine, and reducing sugar concentrations as well as the colour of the potato chips. Design Expert® Software (version 10, Stat-Ease Corp., Minneapolis, Minn., USA) was used to graphically generate the response surfaces Y values.
Experimental design for the 3-month storage effect and its statistical analysis
In addition to the central composite rotatable design for the investigation of the blanching conditions, a completely fully randomized experimental design was used for the experiments of 3-month storage. Data were analyzed by one-way ANOVA using SAS (SAS Institute, Cary, NC, USA) to assess the effects of a 3-month storage period, blanching time, and temperature on the compositions of the potato chips. Mean values with standard deviations were compared using a Tukey’s mean difference test at 95% significance level.
Reducing sugar analysis
Glucose and fructose contents were enzymatically determined using Megazyme’s d-Fructose and d-Fructose Assay Kit. The frozen blanched and non-blanched control potato slices were thawed at room temperature and homogenized in a blender. 1.0 g of homogenate was weighed out into a 15 mL falcon tube. A volume of 10 mL of 33% (v/v) ethanol was added and the suspension was shaken linearly for 16 h. The suspension was centrifuged at 2800 rpm for 5 min, and the supernatant was collected in a 15 mL falcon tube. A 96-well microplate format was selected to conduct the tests. A BioTek® Epoch 2 Microplate Reader and Gen5 software version 2.06 (BioTek® Epoch 2, BioTek Instruments, Inc., Winooski, VT, USA), was used. Absorbance was taken at 340 nm to determine glucose and fructose contents. Reducing sugar was calculated by summing up the glucose and fructose. Data were obtained from two replicates.
Asparagine analysis
Asparagine content was enzymatically determined using Megazyme’s l-Asparagine/l-Glutamine/Ammonia Assay Kit (Rapid). A sample from the supernatant extracted for reducing analysis was used. Measurement of changes in absorbance at 340 nm was conducted in 96-well plates, using the same microplate reader that was used for reducing sugar. Measurements were performed in duplicate samples.
Acrylamide analysis
Acrylamide was measured following the procedure of Yang et al. (2016) with a few modifications. The frozen fried chips were thawed at room temperature and homogenized in a blender. A sample of 0.5 g of chip homogenate was weighed into a falcon tube, and suspended in 4.75 mL of 0.1% (v/v) formic acid. In order to conduct an internal standard, 100 μL of meth-acrylamide solution (0.25 µg/µL) was added. The falcon tube was shaken linearly on a MaxQ2506 shaker for 20 min. After shaking, the falcon tube was then centrifuged at 3600 rpm for 15 min to pellet the chip. The supernatant was collected using a Pasteur pipette, taking care to avoid collection of the top oily layer, and passed through a 5 mL syringe with a 0.45 μm nylon syringe filter into a 2 mL snap-cap centrifuge tube. Exactly 1 mL of filtered sample was subjected to solid-phase extraction (SPE cartridge, CarboPrep® 200, 3 mL, 250 mg, conditioned with 1 mL of acetone then 1 mL of 0.1% (v/v) formic acid solution to wash) and allowed to filter by gravity. The SPE tube was then washed with 0.5 mL of water and allowed to filter by gravity. Then the SPE tube was centrifuged at 800 rpm for 5 min to remove any residual water. After centrifugation, 1 mL of acetone was added to the SPE tube to elute the bound acrylamide. The SPE tube was centrifuged at 800 rpm for 1 min to collect residual acetone from the stationary phase. The collected eluate was transferred to a 2 mL snap-cap centrifuge tube and stored at 4 °C until later analysis of acrylamide content by gas chromatography (GC) using flame-ionizing detection (FID). Two replicate measurements were done for each sample.
Colour measurements
The color of each chip sample was measured with a Minolta CR-400 colorimeter (Radiometric instruments Operations, Osaka, Japan). A standard white color plate was used for calibration. The Hunter Lab colour values of L* (lightness, 0 = black to 100 = white) and a* (redness, + a* = redness, – a* = greenness) were recorded and evaluated. Two measurements were taken for each sample, and the results were expressed as the mean value ± standard deviation.
Results and discussion
The untreated fresh tubers contained 123.1 ± 6.0 mg asparagine/100 g tuber, 120.3 ± 7.6 mg glucose/100 g tuber, 68.6 ± 3.3 mg fructose/100 g tuber, and 189.0 ± 10.9 mg reducing sugars/100 g tuber. The Megazyme enzyme test methods and kits were used to do the analyses as described above.
ANOVA and coefficients for the polynomial models
Table 1 shows the experimental data obtained before and after the 3-month storage period, while Table 2 summarizes the regression parameters of the polynomial models (Eq. 1) and ANOVA results with respect to reducing sugar, asparagine, acrylamide, L* value and a* value before and after storage. The regression parameter or coefficients were represented in terms of coded factors, meaning that the low and high factor levels (blanching temperature and time) were converted to − 1 and + 1, respectively (Mestdagh et al. 2008). In ANOVA, the lack-of-fit test provided a formal test for lack of fit. The null hypothesis was that the model fitted to the data was an adequate description of the relationship between the response means and the reducing sugar, asparagine, acrylamide, L* value, and a* value, etc. If the lack-of-fit test was significant at the chosen significance level, it could be concluded that the model was inadequate. According to ANOVA results presented in Table 2, the model for reducing sugar after the 3-month storage period showed a significant lack of fit at P < 0.01 level, indicating that it was meaningless in the investigation of the relationships between variables. All the other models had a lack of fit at P > 0.01 level and were therefore significant enough to be used to describe the data. In addition, ANOVA demonstrated the polynomial models were significant at P = 5% level, except the models for the reducing sugar (before 3-month storage) and L* value (after 3-month storage) (Table 2), which were significant at the P = 36.2% and P = 13.4% level, respectively. Models for L* value (before 3-month storage), asparagine (before 3-month storage), and a* value (after 3-month storage) had R2 values greater than 0.80. These models also showed a coefficient of variance ≤ 20%. Thus, these models accurately agreed with experimental data and are useful for studying the effects of the blanching treatments. Significance levels for the estimated coefficients of the polynomial models are also shown in Table 2. Terms with non-significant coefficients were removed from the polynomial models to produce reduced models which could be used to fit the response values better. The further explanation of the results of statistical analysis will be given separately in the following discussions with the figures of the graphical charts (response surfaces) of the models.
Table 2.
ANOVA and regression coefficients for the polynomial models in terms of coded factors
| Coefficients | Before 3-month storage | After 3-month storage | ||||||||
|---|---|---|---|---|---|---|---|---|---|---|
| Reducing sugar (mg/100 g) | Asparagine (mg/100 g) | Acrylamide (mg/1000 g) | L* | a* | Reducing sugar (mg/100 g) | Asparagine (mg/100 g) | Acrylamide (mg/1000 g) | L* | a* | |
| β 0 | 138.61 | 98.24 | 1.55 | 55.46 | 4.35 | 31.39 | 53.13 | 0.97 | 57.91 | 3.54 |
| Temp. β1 | 4.91 | − 6.86 | − 0.037 | 1.05** | − 0.28 | − 3.20 | − 1.61 | – | 0.26 | 0.55* |
| Time β2 | − 17.21 | − 14.66** | − 0.36*** | 0.70* | − 1.24** | − 16.06*** | − 14.08*** | – | 1.32* | − 0.78** |
| β 12 | 8.10 | 6.68 | – | 0.68 | – | − 6.05* | 0.70 | – | – | 1.48*** |
| β 211 | − 9.98 | 15.22** | – | 1.86*** | – | 2.32 | 11.39** | – | – | − 0.14 |
| β 222 | − 19.77 | − 10.9* | – | − 0.067 | – | 12.02*** | 5.57 | – | – | − 0.11 |
| Coefficient of determination (R2) | 0.4814 | 0.81 | 0.51 | 0.88 | 0.65 | 0.9226 | 0.7911 | 0.0000 | 0.3307 | 0.8151 |
| Model significance (P) | 0.3624 | 0.0178 | 0.0295 | 0.0038 | 0.0052 | 0.0009 | 0.0248 | – | 0.1343 | 0.0167 |
| Coefficient of variation (%) | 25.11 | 12.85 | 20.51 | 1.53 | 19.21 | 15.64 | 15.67 | 26.77 | 2.96 | 21.40 |
| Lack of fit significance (P) | 0.7223 | 0.3392 | 0.017 | 0.3357 | 0.1495 | 0.0088 | 0.6100 | 0.1018 | 0.9137 | 0.0264 |
Model: , where X1, and X2 respectively stand for blanching temperature and time
*, **, ***Indicate significant at P ≤ 0.1, P ≤ 0.05, and P ≤ 0.01, respectively
Reducing sugar
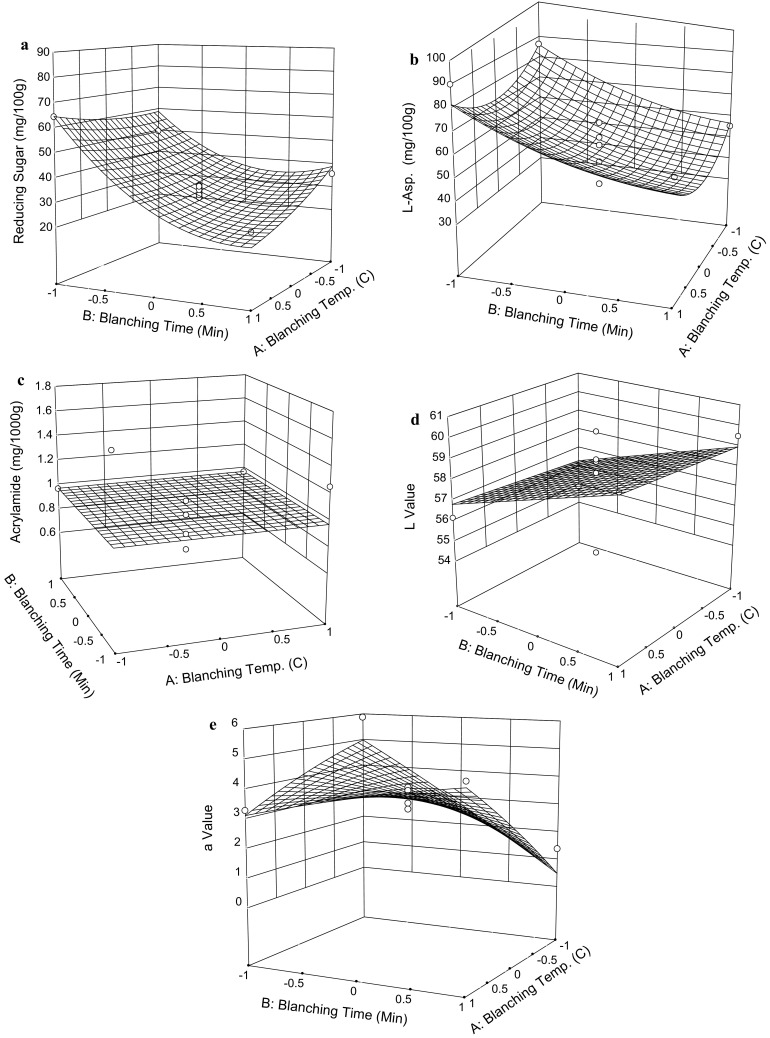
Potato tubers before the 3-month storage period, the non-blanched control chips contained 189.0 mg of reducing sugars per 100 g of tuber (Table 1). After blanching, the reducing sugar concentrations were reduced. These reductions were in the range of 11.9–62.3%. This phenomenon was expected as the results of reducing sugars leaching out during blanching process. Figure 1a shows a surface graph depicting the gradual decrease of reducing sugar concentration as blanching time (β2) increased, while blanching temperature (β1) had less significant effect on reducing sugar concentration. this phenomenon could be explained by the fact that under the queried blanching temperature range of 65–85 °C, which was higher than the gelatinization temperature of 59.0–61.9 °C of potato starch (Karim et al. 2007), potato starch was able to gelatinize. However, gelatinization of starch progresses slowly. The starch granules located on the chip surface gelatinized first, then the starch granules inside, which means that the reducing sugars were gradually released. By increasing the blanching time, more reducing sugars were able to leach out. The fact that gelatinization of starch progresses slowly was supported by Bontovics and Sebok (1999) who found that some potato starch granules remained intact within the cells even after 30 s of blanching at 85, 95, and 100 °C. In contrast to our result, Mestdagh et al. (2008) indicated that reducing sugar content decreased upon increasing blanching temperature. Similar to our analysis, Mestdagh et al. (2008) used the response surface methodology to conduct research, but a wider temperature interval of 35–80 °C was applied, including a low temperature range at which starch gelatinization would not happen. This might be the reason why they have drawn a conclusion that blanching temperature matters. From our response surface equation, the optimal minimum achievable concentration of reducing sugar is estimated to be 67.6 mg/100 g when blanched for 9.4 min (+ 1.21) at 68.7 °C (− 0.89), a reduction of 64.2%, given the fact that the control sample contained 189.0 ± 10.9 mg of reducing sugars per 100 g of tuber (Table 1).
Fig. 1.

Response surface graphs showing the effect of blanching temperature (β1) and blanching time (β2) on the reducing sugar (a), asparagine(b), acrylamide (c), L* value (d), a* value (e), of potato chips which were before 3-month storage period
Table 2 shows the ANOVA results following the 3-month storage period, which indicate a significant lack-of-fit for the reducing sugar model at the P < 0.01 level. This demonstrates the model is statistically inadequate in describing the relationship between reducing sugar levels and blanching parameters. Nonetheless, the concentration of reducing sugar appeared to be a valuable indicator of blanching efficacy, and as a result, the graph was generated to roughly describe the relationships which presented in Fig. 2a. This figure shows that when the blanching time (β2) increases from 3.2 min (− 1) to 8.8 min (+ 1), reducing sugar concentration observably decreases from 65 to approximately 20 mg/100 g. Increasing blanching temperature (β1) from 67.9 °C (− 1) to 82.1 °C (+ 1) slightly decreases the sugar content. The response surface equation estimates that the minimum achievable concentration of the reducing sugar is 25.2 mg/100 g when blanched for 8.8 min (+ 1.00) at 75.9 °C (+ 0.13). Considering the control sample’s 66.3 mg of reducing sugar per 100 g of tuber, a 62.0% reduction under the optimal blanching conditions would be expected.
Fig. 2.
Response surface graphs showing the effect of blanching temperature (β1) and blanching time (β2) on the reducing sugar (a), asparagine (b), acrylamide (c), L* value (d), a* value (e) of potato chips which were after 3-month storage period
Asparagine
Before the 3-month storage period, the non-blanched control chips contained 123.1 mg of asparagine per 100 g of fresh potato. Blanching almost consistently reduced asparagine concentrations as indicated in Table 1. The blanching parameters for sample 7 anomalously resulted in a net increase in asparagine content, though the reason is unclear. Table 2 shows that the polynomial model adequately predicts asparagine concentrations. Blanching time (β2) is significant at the P ≤ 0.05 level in affecting the asparagine content, while blanching temperature (β1) is not. This, again, can be attributed to the same gradual gelatinization phenomenon described above, because gelatinization progresses slowly, and asparagine is only gradually released into the blanching solution, which depend on time. The corresponding asparagine content of the potato chips is shown in Fig. 1b, which indicates that increasing blanching time (β2) effectively reduces asparagine levels. Increasing blanching time (β2) from 3.2 min (− 1) to 8.8 min (+ 1) decreases the asparagine content from 100 to 76 mg/100 g, which represents a reduction of 24%. The response surface equation estimates that the optimal minimum amount of asparagine achievable is 61.8 mg/100 g when blanched for 9.7 min (+ 1.32) at 72.0 °C (− 0.42), a maximum reduction of 49.8%, given the fact that the control sample contained 123.1 mg of asparagine per 100 g of tuber (Table 1). This is in agreement with Pedreschi et al. (2011) who blanched the chips at 85 °C for 3.5 min and reported asparagine reductions of about 50%. Table 2 also demonstrates the regression coefficients of the asparagine model following the 3-month storage period. The effect of the blanching time (β2) is significant again at the P ≤ 0.01 level, while the blanching temperature is not. Figure 2b shows that increasing blanching time (β2) from 3.2 min (− 1) to 8.8 min (+ 1) decreases the asparagine from 80 to 50 mg/100 g. The equation estimates that the optimal minimum amount of asparagine achievable is 44.2 mg/100 g when blanched for 9.5 min (+ 1.26) at 75.2 °C (+ 0.03), given that the control sample contained 88.8 mg of asparagine per 100 g tuber (Table 1).
Acrylamide
As shown in Table 1, before the 3-month storage period, non-blanched control tubers produced 3.1 mg of acrylamide per 1000 g of chips, while blanched tubers yielded 19.4–67.7% less acrylamide than the control. This phenomenon was attributed to the reduction of asparagine and reducing sugar during the blanching process described above. Table 2 shows the lack-of-fit-model is not significant at the P = 1% level, indicating that the model is good to describe the relationship between the acrylamide content and the blanching treatments. The regression parameters of the models, as listed in Table 2, indicates a linear model. Of the tested blanching time and temperature parameters, only blanching time (β2) is significant (P ≤ 0.01) in reducing acrylamide yield in potato chips, which is in agreement with the significance of increasing blanching time, but not in agreement for temperature in relation to decreasing the acrylamide precursor content as described above. The corresponding acrylamide content of the treated potato chips is shown in Fig. 1c, as a function of blanching time and temperature. The figure depicts that increasing blanching time consistently decreases acrylamide yield, while increasing the blanching temperature does not, as indicated by a nearly flat line inside the whole experimental range. This phenomenon contradicts previous observations by Mestdagh et al. (2008) who noted that acrylamide content significantly decreased upon increasing both blanching time and temperature. As stated above, the applied wider temperature interval of 35–80 °C, compared to our temperature interval of 65–85 °C, could be a reason why different conclusions on blanching temperature effects were obtained. As shown in Fig. 1c, an optimal minimum acrylamide content of about 1.20 mg/1000 g of fried potato chips can be achieved when the potato slices are blanched at 75 °C for 8.8 min, which is a 61.3% reduction relative to the non-blanched control.
Following the 3-month storage period, ANOVA results (Table 2) show that variation between sets of parameters and their final acrylamide yields was insignificant. The acrylamide concentration remained constant at 0.97 mg/1000 g, depicted on the graphical chart as a flat surface (Fig. 2c). A possible explanation for this phenomenon is the observed reduction of acrylamide precursors (asparagine and reducing sugars) in the tubers during storage. Table 1 shows that following the 3-month storage period, the reducing sugar content in non-blanched control tubers reduced to 35.5% and asparagine to 72.1% relative to the pre-storage values. These reductions were likely the result of metabolic activities and the corresponding energy needs of the tubers. The further reduction of reducing sugar and asparagine levels as a result of the blanching process proved to be too negligible to contribute to any significant variation in final acrylamide levels between treatment groups.
Color measurement
As mentioned above, blanching results in the leaching out of reducing sugars and amino acids, which are necessary components of the Maillard reaction. As such, blanching reduced the color development of chips associated with that reaction. Table 1 shows that prior to the 3-month storage period, the value of L* for non-blanched control was 51.3, while the blanched samples were between 54.5 and 61.1, indicating the blanching process brightened the chips. Table 2 shows both blanching temperature (β1) and time (β2) are significant and have positive effects on L* value. Figure 1d shows the corresponding L* value of the potato chips, which indicate that at 82.1 °C (+ 1), increasing blanching time from 3.2 min (− 1) to 8.8 min (+ 1) increases the L* value from 56.5 to 59.0. At the 8.8 min (+ 1) blanching time level, increasing blanching temperature from 67.9 °C (− 1) to 82.1 °C (+ 1) increases the L* value from 56.0 to 59.0. The equation estimates that the maximum achievable L* value is 61.1 when blanched at 84.2 °C (+ 1.31) for 8.0 min (+ 0.71). The non-blanched control sample had an L* value of 51.3 (Table 1), with an expected increase of 19.1% in L* value when blanched under optimal conditions. Interestingly, Pedreschi et al. (2011) observed no different L* values between the non-blanched and blanched potato slices when fried at 85 °C for 3.5 min. Following a 3-month storage period, only blanching time becomes significant in affecting L* value, as shown in Table 2, while the relationship between blanching temperature and L* value is nearly a flat line, indicating lack of statistical significance.
Table 1 shows that, for both before and after the 3-month storage period, the blanched chips had smaller a* values than the non-blanched control, indicating that the colour of the blanched samples were less red or brown. Prior to the 3-month storage period, blanching time (β2) is significant in the model, which is linear, as shown in Fig. 1e. Increasing the blanching time (β2) from 3.2 min (− 1) to 8.8 min (+ 1) decreases the a* value from 5.4 to 2.8. When measured again after the 3-month storage period, the models become quadratic, as shown in Table 2. Figure 2e accordingly shows the response surface graph. At 3.2 min (− 1), increasing blanching temperature (β1) from 67.9 °C (− 1) to 82.1 °C (+ 1) decreases the a* value from 5.0 to 3.0. While at the 8.8 min (+ 1) blanching time level, increasing the blanching temperature (β1) from 67.9 °C (− 1) to 82.1 °C (+ 1) increases a* value from 0.7 to 4.0. The blanching time (β2) has similar effects on the a* value.
Effect of 3-month-storage
During storage, potato tubers continue metabolic activities, including asparagine and reducing sugar consumptions. In order to demonstrate the effect of the 3-month storage period on acrylamide, asparagine, and reducing sugar concentrations, data of non-blanched control sample and treated samples of No. 1 and No. 8 (Table 1) were selected and depicted in Fig. 3. The parameters of the No. 1 treatment were a combination of 67.9 °C (− 1) and 3.2 min (− 1), representing a mild blanching process. The parameters of No. 8 treatment were 85 °C (+ 1.414) and 6 min (0), representing an intense blanching process. Figure 3a shows significant decreases (P < 0.05) in endogenous reducing sugar concentrations after storage, indicating that potato sweetening did not happen at 10 °C storage. Initially, the fresh control sample contained 188.97 mg of reducing sugar/100 g of tuber. Storage resulted in a drop to 66.3 mg/100 g, a 65% decrease relative to values obtained before storage. Metabolic requirements could be an explanation for the reduction. When stored at 10 °C, reducing sugars could have been consumed faster than they were produced due to the decreased activity of amylolytic enzymes. Cases of No. 1 and No. 8 showed that reducing sugar concentrations were significantly reduced after 3-month storage period. One possible explanation for this was the change of the structure of the tuber cell walls over time. In fresh, healthy tubers, the cell walls partially protect the inner plasma membranes from exogenous dangers, in this case, hot water. While cell walls allow for the passive diffusion of small molecules such as glucose and fructose, the inner plasma membranes do not, as is the case for all water-soluble molecules. As the tubers and their cells aged during the 3-month storage period, the cellulose in the cell walls contorted and bended (Wei et al. 2009) creating gaps and as a result, the cell walls no longer offered the same degree of protection to the plasma membrane as they once did. In reaching the plasma membranes, hot water would highly disrupt the lipid bilayer structures by substantially increasing the fluidity, and in turn increasing the permeability of the membranes to molecules such as asparagine, glucose, and fructose (McNeil and Steinhardt 1997). After the 3-month storage period, No. 8 shows the intense blanching treatments released more reducing sugars than the mild treatments of No. 1.
Fig. 3.

Effects of storage on the reducing sugar, asparagine, and acrylamide. Means with the same letters are not significantly different (p < 0.05)
Before storage, asparagine levels were significantly unaffected by variations in blanching parameters (P < 0.05). After storage, the statistical analysis did not show a significant difference in asparagine relative to the values obtained before storage (P < 0.05). However, as shown in Fig. 3b, the non-blanched control samples had an endogenous decrease in asparagine content of 28%, while No. 1 samples had a similar decrease of 27%, which suggested the decrease came as a result of storage rather than the blanching treatment itself. In the case of No. 8, an asparagine content decrease of 44% was observed when contrasted with No. 1, indicating that both higher blanching temperature and longer blanching time were effective in removing asparagine from the tubers, although strangely, only after the tuber had been stored for 3 months.
Figure 3c shows that control samples contained less acrylamide after the 3-month storage period and that, similarly, treated chips contained lower acrylamide levels than they did before storage. These phenomena were expected since reducing sugar content decreased during storage, and in turn reducing the potential for acrylamide formation. The general trend between control, No. 1, and No. 8 was maintained before and after storage. The acrylamide concentration decreased progressively and proportionally with increasing blanching intensity, indicating that intense blanching results in the lowest acrylamide.
Relationships between acrylamide formation and colour development
Figure 4 demonstrates the regression relationship of acrylamide with a* and L* values. Data of acrylamide, a*, and L* values were selected from Table 1. Acrylamide concentration showed a linear correlation (R2 = 0.839) with the a* values of the chips which represent redness component. Pedreschi et al. (2005) reported a linear correlation (R2 = 0.9569) of acrylamide with a* values for fried potato slices. In this study, the relationship of acrylamide and L* values had a low correlation (R2) value of 0.375, in which L* value represents lightness.
Fig. 4.

Acrylamide concentration versus a* value and L* value of potato chips
Conclusion
Blanching temperatures and duration in the range of 65–85 °C and 2–10 min were investigated in this study. The results confirmed that the blanching treatments could significantly reduce reducing sugar, asparagine, and acrylamide in potato chips. The optimal blanching conditions and the optimal minimum concentrations of reducing sugar, asparagine, and acrylamide are summarized in “Appendix 1”. For the potato tubers that were not held for a 3-month storage period, the optimal blanching parameters to reduce reducing sugar, asparagine and acrylamide levels are in the ranges of 8.8–9.7 min at 68.7–75.0 °C. Optimal maximum reductions of reducing sugar, asparagine, and acrylamide of 64.2, 49.8, and 61.3%, respectively, could be achieved. Following a 3-month storage period, the effects of varying blanching conditions on acrylamide were not significant, and the acrylamide produced in the fried potato chips became a constant value of 0.97 mg per 1000 g of chips. This means that including a storage period at 10 °C for at least 3 months removes the need for blanching parameter optimization, as any practical combination of blanching temperature and time will result in the same final acrylamide yield in the fried product, which in this case is 0.97 mg/1000 g of chip. ANOVA indicated that optimizing blanching time consistently had a more significant impact than optimizing blanching temperature in reducing acrylamide and asparagine concentrations; increasing blanching time consistently decreased reducing sugar, asparagine, and acrylamide yields. An important observation is that blanching consistently improved the potato chips’ appearance, which was evident to the color measurements of L* and a* values; after the blanching treatment, L* values increased while a* values decreased. A linear relationship between acrylamide and a* value was observed (R2 = 0.839), while a weaker correlation was observed between acrylamide and L* value (R2 = 0.375).
Acknowledgements
This research was financially supported by Alberta Innovates, Alberta Crop Industry Development Fund, Agriculture and Agri-Food Canada (AAFC).
Appendix
See Table 3.
Table 3.
Optimal blanching conditions and results from response surface equations
| Before 3-month storage | After 3-month storage | |||||||||
|---|---|---|---|---|---|---|---|---|---|---|
| Non-blanched control concentration | Optimal minimum concentration after blanching | Optimal maximum change (%) | Optimal blanching temp. (°C) | Optimal blanching time (min) | Non-blanched control concentration | Optimal minimum concentration after blanching | Optimal maximum change (%) | Optimal blanching temp. (°C) | Optimal blanching time (min) | |
| Red. sugar | 189.0 mg/100 g | 67.6 mg/100 g | − 64.2 | 68.7 | 9.4 | 66.3 mg/100 g | 25.2 mg/100 g | − 62.0 | 75.9 | 8.8 |
| Asparagine | 123.0 mg/100 g | 61.8 mg/100 g | − 49.8 | 72.0 | 9.7 | 88.8 mg/100 g | 44.2 mg/100 g | − 50.2 | 75.2 | 9.5 |
| Acrylamide | 3.1 mg/1000 g | 1.2 mg/1000 g | − 61.3 | 75.0 | 8.8 | 2.2 mg/1000 g | 0.97 mg/1000 g | − 55.9 | – | – |
| L* value | 51.3 | 61.1 | + 19.1 | 84.2 | 8.0 | 57.5 | 59.5 | + 3.5 | 82.1 | 8.8 |
| a* value | 7.2 | 2.8 | − 61.1 | 82.1 | 8.8 | 5.5 | 0.48 | − 91.3 | 67.9 | 8.8 |
References
- Alvarez MD, Morillo M, Canet W. Characteristics of the frying process of fresh and blanching potato strips using response surface methodology. Eur Food Res Technol. 2000;211:326–335. doi: 10.1007/s002170000161. [DOI] [Google Scholar]
- Amrein TM, Bachmann S, Noti A, Biedermann M, Barbosa MF, Biedermann-Brem S, Grob K, Keiser A, Realini P, Escher F, Amodo R. Potential of acrylamide formation, sugar, and free asparagine in potatoes: a comparison of cultivars and farming systems. J Agric Food Chem. 2003;51:5556–5560. doi: 10.1021/jf034344v. [DOI] [PubMed] [Google Scholar]
- Becalski A, Lau BPY, Lewis D, Seaman SW, Hayward S, Sahagian M, Ramesh M, Leclerc Y. Acrylamide in French fries: influence of free amino acids and sugar. J Agric Food Chem. 2004;52:3801–3806. doi: 10.1021/jf0349376. [DOI] [PubMed] [Google Scholar]
- Bingol G, Wang B, Zhang A, Pan Z, McHugh T. Comparison of water and infrared blanching methods for processing performance and final product quality of French fries. J Food Eng. 2014;121:135–142. doi: 10.1016/j.jfoodeng.2013.08.001. [DOI] [Google Scholar]
- Bontovics P, Sebok A. Studies of the potato microstructure during blanching. Acta Aliment. 1999;28:269–278. doi: 10.1556/AAlim.28.1999.3.6. [DOI] [Google Scholar]
- Califano AN, Calvelo A. Adjustment of surface concentration of reducing sugar before frying of potato strips. J Food Process Preserv. 1987;12:1–9. doi: 10.1111/j.1745-4549.1988.tb00062.x. [DOI] [Google Scholar]
- Karim AA, Toon LC, Lee VPL, Ong WY, Fazilah A, Noda T. Effects of phosphorus contents on the gelatinization and retrogradation of potato starch. J Food Sci. 2007;72:C132–C138. doi: 10.1111/j.1750-3841.2006.00251.x. [DOI] [PubMed] [Google Scholar]
- Kaymak F, Kincal NS. Apparent diffusivities of reducing sugar in potato strips blanching in water. Int J Food Sci Technol. 1994;29:63–70. doi: 10.1111/j.1365-2621.1994.tb02047.x. [DOI] [Google Scholar]
- Kornbrust BA, Stringer MA, Lange NEK, Hendriksen HV. Asparaginase—an enzyme for acrylamide reduction in food products. In: Whitehurst RJ, Oort MV, editors. Enzymes in food technology. 2. Hoboken: Wiley; 2009. pp. 59–87. [Google Scholar]
- Liu EZ, Scanlon MG. Modeling the effect of blanching conditions on the texture of potato chips. J Food Eng. 2007;81:292–297. doi: 10.1016/j.jfoodeng.2006.08.002. [DOI] [Google Scholar]
- Mariotti M, Cortes P, Fromberg A, Bysted A, Pedreschi F, Granby K. Heat toxicant contaminant mitigation in potato chips. LWT Food Sci Technol. 2015;60:860–866. doi: 10.1016/j.lwt.2014.09.023. [DOI] [Google Scholar]
- McNeil PL, Steinhardt RA. Loss, restoration, and maintenance of plasma membrane integrity. J Cell Biol. 1997;137:1–4. doi: 10.1083/jcb.137.1.1. [DOI] [PMC free article] [PubMed] [Google Scholar]
- Mestdagh F, de Wilder T, Fraselle S, Govaert Y, Ooghe W, Degroodt JM, Verhe R, van Peteghem C, de Meulenaer B. Optimization of the blanching process to reduce acrylamide in fried potatoes. LWT Food Sci Technol. 2008;41:1648–1654. doi: 10.1016/j.lwt.2007.10.007. [DOI] [Google Scholar]
- Ngobese NZ, Workneh TS, Siwela M. Effect of low-temperature long-time and high-temperature short-time blanching and frying treatments on the French fry quality of six Irish potato cultivars. J Food Sci Technol. 2017;54:507–517. doi: 10.1007/s13197-017-2495-x. [DOI] [PMC free article] [PubMed] [Google Scholar]
- Notardonato I, Avino P, Centola A, Cinelli G, Russo MV. Validation of a novel derivatization method for GC-ECD determination of acrylamide in food. Anal Bioanal Chem. 2013;405:6137–6141. doi: 10.1007/s00216-013-7001-3. [DOI] [PubMed] [Google Scholar]
- Pedreschi F, Kaack K, Granby K. Reduction of acrylamide formation in fried potato slices during frying. LWT Food Sci Technol. 2004;37:679–685. doi: 10.1016/j.lwt.2004.03.001. [DOI] [Google Scholar]
- Pedreschi F, Mery D, Mendoza F, Aguilera JM. Classification of potato chips using pattern recognition. J Food Sci. 2004;69:E264–E270. doi: 10.1111/j.1365-2621.2004.tb10996.x. [DOI] [Google Scholar]
- Pedreschi F, Moyano P, Kaack K, Granby K. Color changes and acrylamide formation in fried potato slices. Food Res Int. 2005;38:1–9. doi: 10.1016/j.foodres.2004.07.002. [DOI] [Google Scholar]
- Pedreschi F, Kaack K, Granby K, Troncoso E. Acrylamide reduction under different pre-treatments in French fries. J Food Eng. 2007;79:1287–1294. doi: 10.1016/j.jfoodeng.2006.04.014. [DOI] [Google Scholar]
- Pedreschi F, Leon J, Mery D, Moyano P, Pedreschi R, Kaack K, Granby K. Color development and acrylamide content of pre-dried potato chips. J Food Eng. 2007;79:786–793. doi: 10.1016/j.jfoodeng.2006.03.001. [DOI] [Google Scholar]
- Pedreschi F, Mariotti S, Granby K, Risum J. Acrylamide reduction in potato chips by using commercial asparaginase in combination with conventional blanching. LWT Food Sci Technol. 2011;44:1473–1476. doi: 10.1016/j.lwt.2011.02.004. [DOI] [Google Scholar]
- Viklund GA, Olsson KM, Sjoholm IM, Skog KI. Acrylamide in crisps: effect of blanching studied on long-term stored potato clones. J Food Compost Anal. 2010;23:194–198. doi: 10.1016/j.jfca.2009.07.009. [DOI] [Google Scholar]
- Wei H, Xu Q, Taylor LE, Baker JO, Tucker MP, Ding SH. Natural paradigms of plant cell wall degradation. Curr Opin Biotechnol. 2009;20:330–338. doi: 10.1016/j.copbio.2009.05.008. [DOI] [PubMed] [Google Scholar]
- Yang Y, Achaerandio I, Pujola M. Influence of the frying process and potato cultivar on acrylamide formation in French fries. Food Control. 2016;62:216–223. doi: 10.1016/j.foodcont.2015.10.028. [DOI] [Google Scholar]
- Yu B, Jin Z, Deng L, Xu X, He L, Wang J, Tian Y, Chen H. Kinetic study of thermal inactivation of potato peroxidase during high-temperature short-time processing. J Food Sci Technol. 2010;47:67–72. doi: 10.1007/s13197-010-0017-1. [DOI] [PMC free article] [PubMed] [Google Scholar]
- Zuo S, Zhang T, Jiang B, Mu W. Reduction of acrylamide level through blanching with treatment by an extremely thermostable L-asparaginase during French fries processing. Extremophiles. 2015;19:841–851. doi: 10.1007/s00792-015-0763-0. [DOI] [PubMed] [Google Scholar]