Abstract
Study Objectives:
Sleep disorders in most individuals remain undiagnosed and without treatment. The use of novel tools and mobile technology has the potential to increase access to diagnosis. The objective of this study was to perform a quantitative and qualitative analysis of the available literature evaluating the accuracy of smartphones and portable devices to screen for sleep-disordered breathing (SDB).
Methods:
A literature review was performed between February 18, 2017 and March 15, 2017. We included studies evaluating adults with SDB symptoms through the use mobile phones and/or portable devices, using standard polysomnography as a comparison. A qualitative evaluation of studies was performed with the QUADAS-2 rating. A bivariate random-effects meta-analysis was used to obtain the estimated sensitivity and specificity of screening SDB for four groups of devices: bed/mattress-based, contactless, contact with three or more sensors, and contact with fewer than three sensors. For each group, we also reported positive predictive values and negative predictive values for mild, moderate, and severe obstructive sleep apnea (OSA) screening.
Results:
Of the 22 included studies, 18 were pooled in the meta-analysis. Devices that were bed/mattress-based were found to have the best sensitivity overall (0.921, 95% confidence interval [CI] 0.870, 0.953). The sensitivity of contactless devices to detect mild OSA cases was the highest of all groups (0.976, 95% CI 0.899, 0.995), but provided a high false positive rate (0.487, 95% CI 0.137, 0.851). The remaining groups of devices showed low sensitivity and heterogeneous results.
Conclusions:
This study evidenced the limitations and potential use of portable devices in screening patients for SDB. Additional research should evaluate the accuracy of devices when used at home.
Citation:
Rosa T, Bellardi K, Viana A Jr, Ma Y, Capasso R. Digital health and sleep-disordered breathing: a systematic review and meta-analysis. J Clin Sleep Med. 2018;14(9):1605–1620.
Keywords: digital health, obstructive sleep apnea, sleep-disordered breathing
BRIEF SUMMARY
Current Knowledge/Study Rationale: The current diagnostic resources available are not meeting the clinical demand for the evaluation of people suffering from sleep-disordered breathing. The use of novel tools and mobile technology has the potential to increase access to diagnostic tools, but the accuracy of such devices in diagnosing sleep-disordered breathing is unknown.
Study Impact: The study is the first to assess the literature to show the potential use of novel tools and mobile technology in screening for sleep-disordered breathing in adults. The study evidences the need for further evaluation of such devices in the home environment.
INTRODUCTION
Sleep-related breathing disorders are highly prevalent and have increasingly received attention from the public, media, and the medical community in recent years.1,2 The prevalence of sleep-disordered breathing (SDB)—including snoring and obstructive sleep apnea (OSA)—is approximately 26% in the adult population worldwide.2 SDB is associated with an increased risk of cardiovascular, metabolic, and psychiatric diseases, and with the rising obesity epidemic, its prevalence and associated sequelae tend to increase.1,2
Sleep disorders worldwide in most individuals remain un-diagnosed and without treatment.4 A supervised, laboratory-based polysomnography (PSG) is the gold-standard test for diagnosing SDB. The procedure provides a comprehensive measurement of various physiological parameters to detect and quantify sleep cycles as well as respiratory events. Although portable devices containing limited channels have seen an increased adoption by sleep specialists, health care resources for SDB evaluation and diagnosis have yet to meet the current clinical demand.3,4
In resource-constrained environments, such as developing countries, access to specialists who manage sleep disorders is difficult because of the reduced number of trained medical staff, as well as economic and infrastructure constraints.5,6 In the United States, 25% of the available sleep medicine fellowship positions were unfilled in 2014, and the number of board-certified sleep specialists has been decreasing, further hampering access to specialized services.7 Therefore, innovative strategies to reduce barriers for sleep disorders screening and treatment are needed.1,3,8
The use of novel tools and mobile technology has the potential to revolutionize the way that health services are delivered, increasing access to health care at a lower cost.8–10 Mobile technology is a fast-growing sector in both developing and developed countries. In 2014, there were 7.06 billion mobile connections worldwide, a number only slightly smaller than the total world population estimates for the same year.11,12 Developers have been actively working on innovations for screening, monitoring, and treating SDB, from questionnaires to more engineered utilization of mobile device sensors, such as motion/actigraphy measurements, audio, and video recording.13–16
Initial studies have evaluated possible clinical applicability and usability of new technologies with promising results; however, no studies have attempted to systematically evaluate the available data. In this study, we sought to perform a quantitative and qualitative systematic review of the international literature in order to evaluate current knowledge on the use of smartphones, wearable electronic devices, and consumer devices for the evaluation of snoring and OSA.
METHODS
Search
We performed a literature review of articles between February 18, 2017 and March 15, 2017 on the following databases: Em-base, PubMed, Cochrane Central Register of Controlled Trials, Web of Science, and CINHAL. We also conducted a “related article” search in PubMed and a gray literature search with keywords—restricting the search to relevant sites (.org, .edu, .gov) and PDF formats. The search was open to all available languages in these databases.
The descriptors used were a combination of index terms (MeSH) and keywords:
“mobile application”/exp OR “mobile application” OR “mobile apps”/exp OR “mobile apps” OR “gadgets” OR “mobile phone”/exp OR “mobile phone” OR “health tracker” OR “mhealth”/exp OR mhealth OR “wearable device”/exp OR “wearable device” OR “fitbit” OR “iphone”/exp OR “iphone” OR “android”/ exp OR android OR “cell phones” OR “cellular phones” OR “smartphones” OR “commecial accelerometer” OR “commercial actigraphy” OR “wrist-based” OR “handheld device” AND (“sleep disordered breathing”/ exp OR “sleep disordered breathing” OR “snoring”/exp OR snoring) AND [2007-2017/py].
The keyword combination used to search for gray literature in Google was:
(“sleep apnea” OR snoring OR insomnia) AND (“mobile applications” OR “mobile apps” OR “cell phone” OR “mobile phone”).
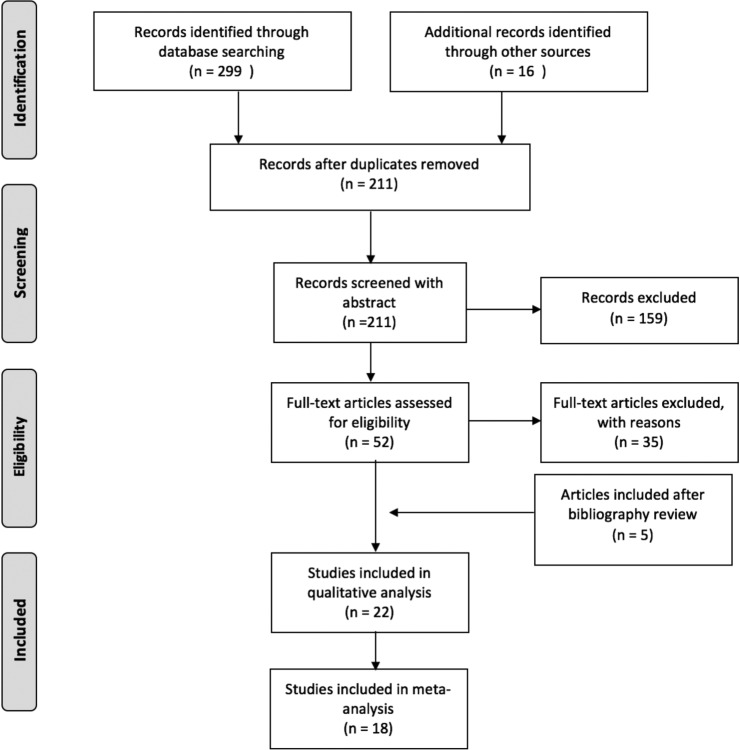
Additionally, we checked the reference lists of selected studies. Two reviewers independently screened titles and abstracts of retrieved citations according to the described inclusion and exclusion criteria. The reviewers then obtained the full text of the relevant studies, evaluated their eligibility, and recorded a list of studies excluded along with a brief explanation for their exclusion. Whenever there was a difference of opinion, a third author (sleep medicine specialist) reviewed the full text and determined the eligibility of the study. The selected articles were submitted to the procedures specified in a PRISMA flowchart (Figure 1).
Figure 1. Flowchart of article selection (PRISMA).
Quantity of articles in each of the following steps taken to select studies: identification of relevant articles, screening of studies through abstract review, and full-text articles assessment of eligibility.
The search results were exported and merged into a database manager (Mendeley, version 1.17.11). A total of 315 titles were identified in the following databases: Embase (63), PubMed (93), Cochrane Central Register of Controlled Trials (14), Web of Science (32), CINHAL (97), and gray literature (16). The reviewers extracted the data from included studies in standardized forms based on the Cochrane Handbook of Systematic Reviews. If they were unable to extract the relevant data from the available reports, they attempted to contact the authors of the articles. The first reviewer added the data into an Excel sheet, while the second checked for data collection errors.
Inclusion and Exclusion Criteria
Inclusion Criteria
Included in this review were studies that reported on adults with SDB symptoms, such as nonrefreshing sleep or excessive sleepiness, decreased concentration or memory loss, snoring, irritability, reduced total sleep time, witnessed apneas, and gasping at night; these studies also had to measure interventions and physiological parameters through the use of internal or external sensors of mobile phones and/or portable devices with the aim of screening and/or diagnosing SDB. Acceptable technology included software applications that can be used in smartphones and other portable, handheld technologies, as well as consumer-level devices or wearable electronic devices that are either commercially available or in development. Because of the novelty of the topic under review, we included randomized and nonrandomized controlled trials, as well as observational studies (cross-sectional, case-control, and prospective cohort studies) that were performed in the past 10 years (2007–2017). Since the use of smartphone technology started its expansion after the iPhone launching in 2007, we think that any study prior to that year would be deemed irrelevant to current practices.
Exclusion Criteria
Exclusion criteria included studies that looked at interventions using only questionnaire-based software, interventions using one portion of the data obtained by a PSG as the index test (eg, pulse oximetry, electroencephalography), and interventions that looked at a retrospective dataset and not actual patients. Studies that evaluated a validated home sleep apnea test (HSAT) were also excluded from analysis, as validated home tests could already be in clinical use and were not the object of the current study.
Comparison
We included only studies that used in-laboratory PSG or a validated HSAT as a comparison. A qualified physician must have reviewed the PSG or HSAT.17
Outcomes
Accuracy of OSA Detection and Severity
The standard diagnosis of OSA is accomplished by quantifying the number of detected respiratory obstructive events (respiratory disturbance index [RDI] or apnea-hypopnea index [AHI] ≥ 5 events/h), as a proportion of total sleep time, in the presence of symptoms.17 The OSA severity can be classified as mild (AHI 5 to < 15 events/h), moderate (AHI 15 to < 30 events/h), or severe (AHI ≥ 30 events/h). We assessed the accuracy of mobile technology and other novel tools in screening OSA at different severity stages when compared to the standard diagnosis. As measures of accuracy for OSA screening, we reported the sensitivity, specificity, positive predictive values (PPV), and negative predictive values (NPV).
Accuracy of Snoring Detection
Primary or simple snoring can be identified in the PSG by audio recording or nasal pressure measurement in the presence of AHI < 5 events/h.18 We assessed the sensitivity, specificity, and accuracy of the mobile technology and other novel tools to screen patients with primary snoring when compared to the standard diagnosis.
Qualitative Evaluation
We used the QUADAS-2 rating to perform a methodological evaluation of the selected studies to assess the risk of bias, and to evaluate the possible sources of heterogeneity.19
Statistical Analysis
We classified studies looking at OSA detection into two different groups according to the standard diagnostic test used: studies in which the index test was compared to PSG, and studies in which the index test was compared to HSAT. Because of the heterogeneity of devices being evaluated, we further classified studies into four additional categories: bed/mattress-based sensors, contactless devices, contact devices with fewer than three sensors, and contact devices with three or more sensors. Studies looking at snoring diagnosis were analyzed separately.
When available, we extracted the true positive, true negative, false positive, and false negative results of each severity level evaluated by the index test. We used forest plots to present the sensitivity and specificity as well as their confidence intervals (CIs), which were estimated based on binomial distribution. For each group category of the index tests, summary sensitivity and specificity estimates and their CIs were estimated using bivariate random-effects meta-analysis with underlying joint normal distribution of logit false positive rate and true false negative rate. Additionally, we reported the median values and interquartile range (IQR) of PPV, NPV, positive likelihood ratio (LRp), and negative likelihood ratios (LRn). The pretest probability was based on the prevalence of OSA in the population of the included studies for each group category and severity level. Summary receiver operating characteristics (SROC) curve were presented showing overall results per AHI threshold.20,21 All the analyses were performed using “mada” package in R software (version 3.4.2, R foundation for Statistical Computing, Vienna, Austria).
RESULTS
We selected 22 studies, as summarized in a PRISMA flow-chart (Figure 1). Of those, we included 18 articles in the meta-analysis. One article did not have enough power to be included in the analysis (Rofouei et al., n = 1),22 and another did not provide false positive, true positive, false negative, and true negative results (Nakano et al.).13 The studies using a HSAT as the standard test were only qualitatively evaluated due to the small number of articles found. Additionally, the thresholds used in the snoring detection studies were not comparable, and therefore not included in the meta-analysis.
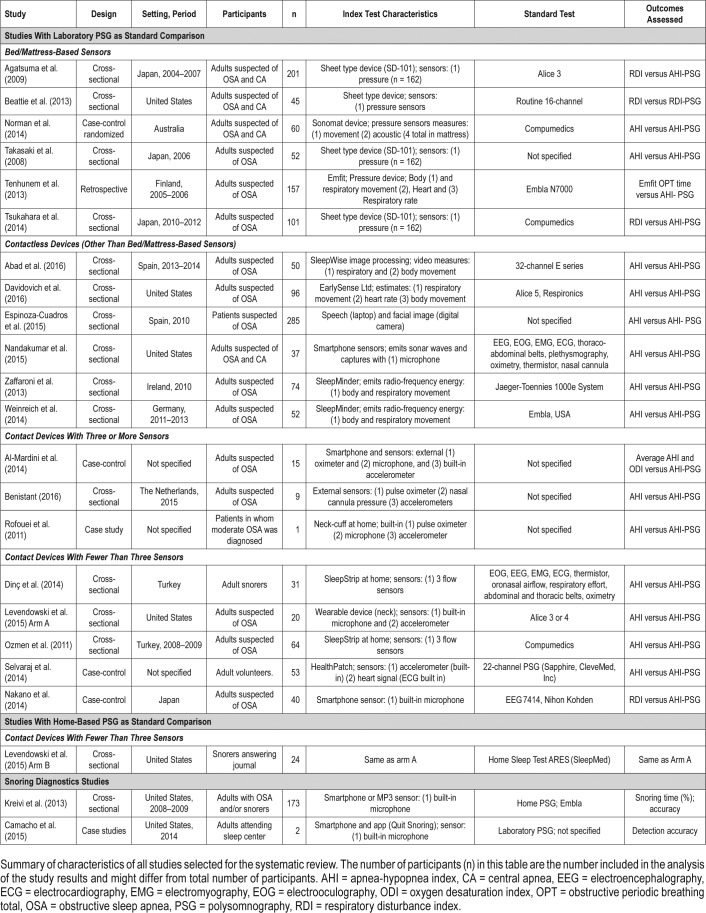
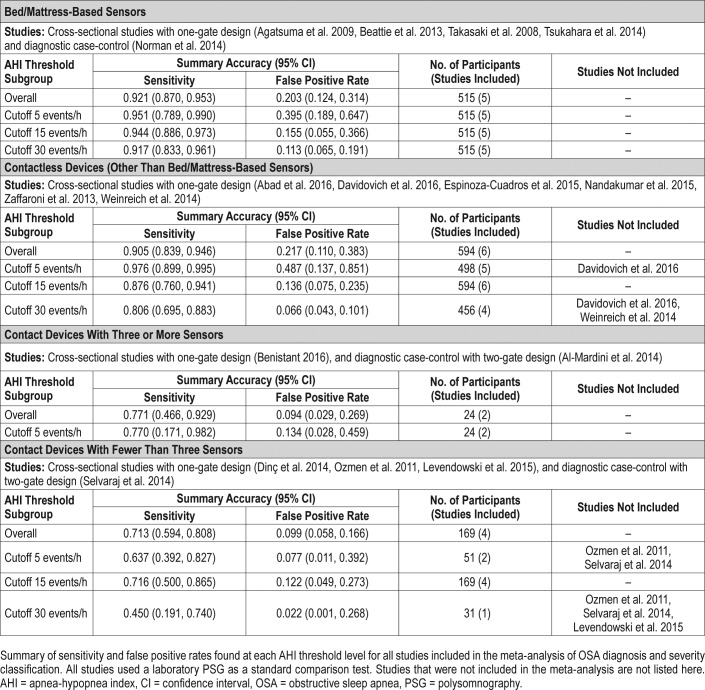
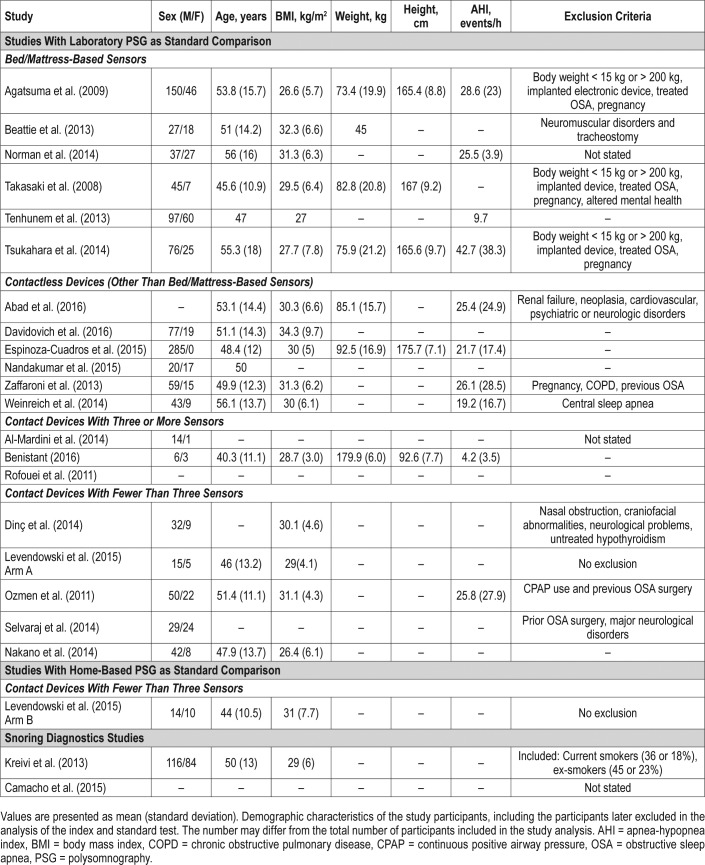
The detailed characteristics of all studies are described in Table 1. Among the studies using an in-laboratory PSG as the standard test (n = 20), 6 studied bed/mattress-based devices, 6 studied contactless devices, 5 studied contact devices with fewer than 3 sensors, and 3 studied contact devices with 3 or more sensors. Although in some cases the studies included participants who were suspected of OSA, central apneas, or primary snoring, the authors assessed the ability of the index test to screen sleep-related breathing disorders based on different RDI or AHI thresholds, but did not attempt to detect central apneas as an outcome. The sensitivity and false positive rate of OSA detection and severity classification in studies using laboratory PSG as a comparison are detailed in Table 2.
Table 1.
Summary of the selected articles.
Table 2.
Sensitivity and false positive rate of OSA diagnosis and severity classification in studies using laboratory PSG as a comparison.
We found one study with HSAT as standard comparison. The study compared the index test with both a PSG and HSAT. Two studies evaluated the accuracy of devices in detecting snoring (Table 1).
Studies With Laboratory PSG as Standard Comparison
Bed/Mattress-Based Sensors
The studies were performed in Japan, United States, Finland, and Australia. Overall, they evaluated very similar index tests. Three assessed the SD-101 sensor (Tsukahara et al., Agatsuma et al., and Takasaki et al.).23–25 All six studies, including Beattie et al., evaluated devices that used, at a minimum, several pressure sensors that measured respiratory and body movement to estimate AHI.26 Norman et al. evaluated a device that also measured acoustic features,27 and Tenhunem et al. additionally measured heart rate.28 Except for Takasaki et al., where the reference test was not described,25 all studies used the standard channel structure of in-laboratory PSG as a comparison. All studies used a similar recruitment strategy, having selected adults who underwent an evaluation at a sleep center. Demographic data of participants was similar across studies, with a mean age varying from 45.6 to 56 years, and mean body mass index (BMI) varying from 26.6 to 32.3 kg/m2.
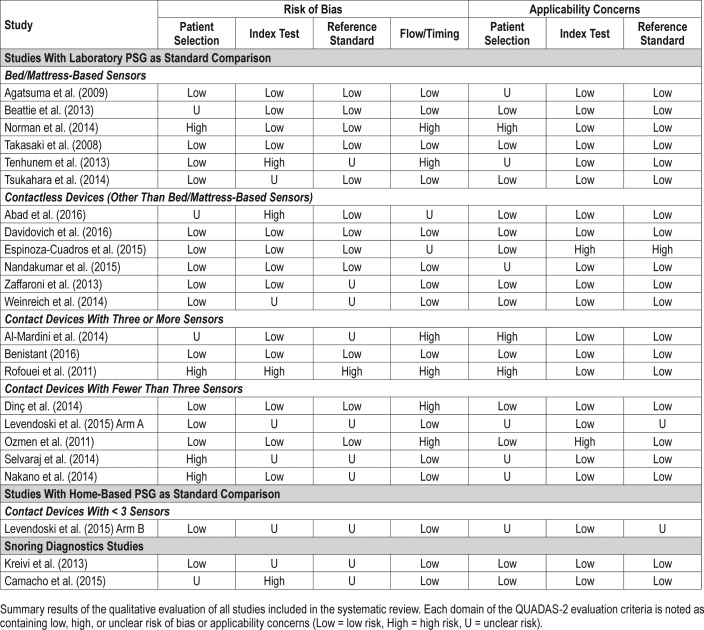
Among the studies included in the meta-analysis, only two received a QUADAS-2 evaluation with more than one domain presenting a high risk of bias or high risk of applicability issues: Norman et al. had consecutive and nonconsecutive recruitment of participants, the recruitment of controls was unclear, and different laboratory PSG tests were used as the standard test27; in the study by Tenhunem et al. the thresholds used in the index test were not prespecified, it was unclear if the interpretation of results was made without the knowledge of the reference test results, and the measurements of 32 participants were excluded from the study analysis because of technical errors28 (Table 3).
Table 3.
Qualitative evaluation of the selected articles using the QUADAS-2 criteria.
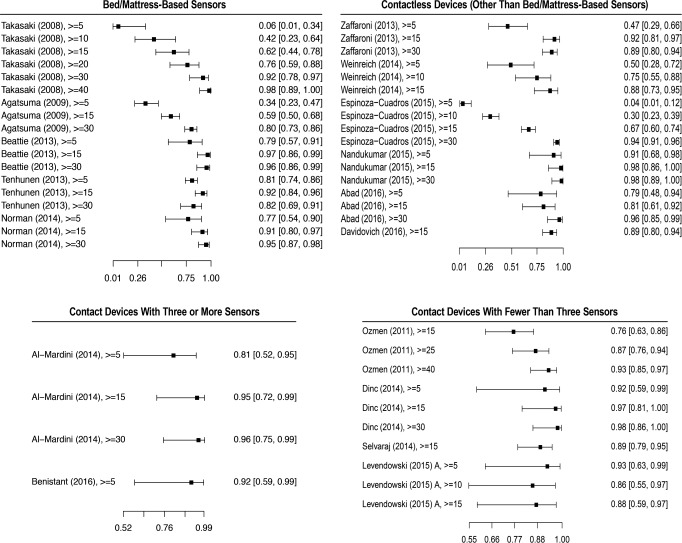
Of the six studies, one (Tsukahara et al.23) was not included in the quantitative analysis because we were not able to obtain the true positive, true negative, false positive, and false negative values. A forest plot of the five remaining studies is shown in Figure 2. The studies evaluated, at a minimum, the OSA detection at an AHI or RDI threshold of 5 events/h, and OSA severity classification for the AHI or RDI thresholds of 15 and 30 events/h. There were a total 515 participants, of which 356 were males (69%), and 159 were females (31%). All participants were suspected of OSA diagnosis and recruited when attending a sleep center.
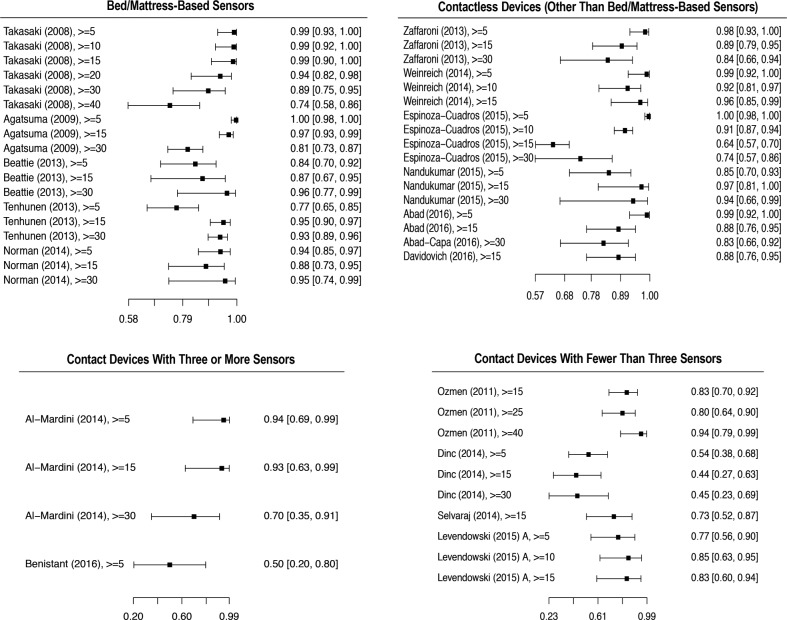
Figure 2. Forest plot of index tests sensitivity at different AHI thresholds.
Sensitivity and confidence intervals of all studies that provided false positive, false negative, true positive, and true negative in each group category. All AHI thresholds tested in the respective studies, including AHI thresholds not included in the meta-analysis are shown. (AHI > 10, 25, 40 events/h). AHI = apnea-hypopnea index.
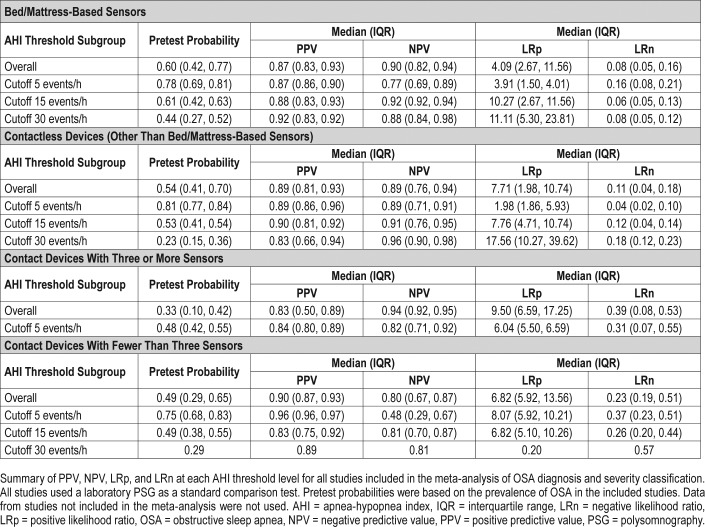
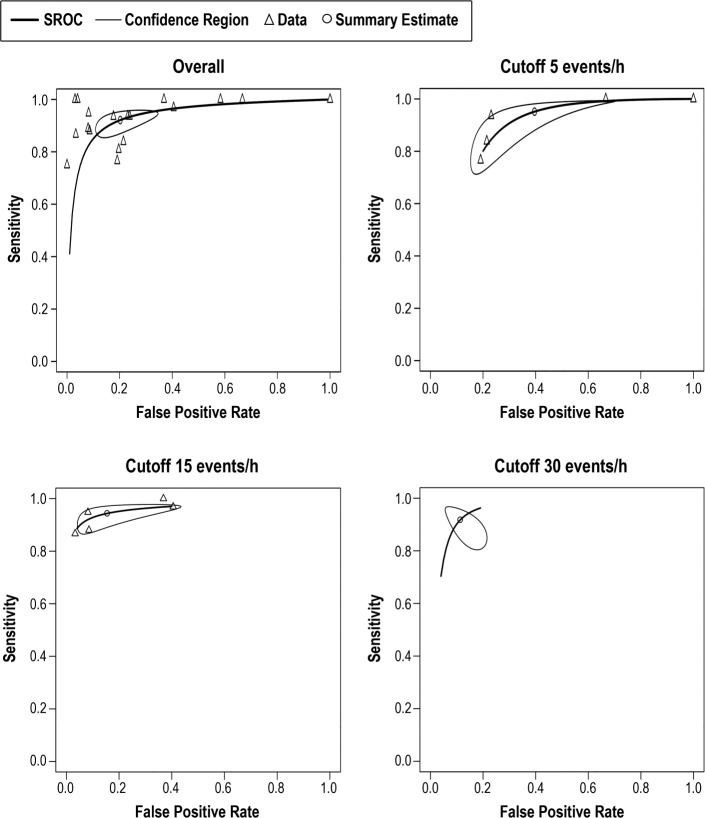
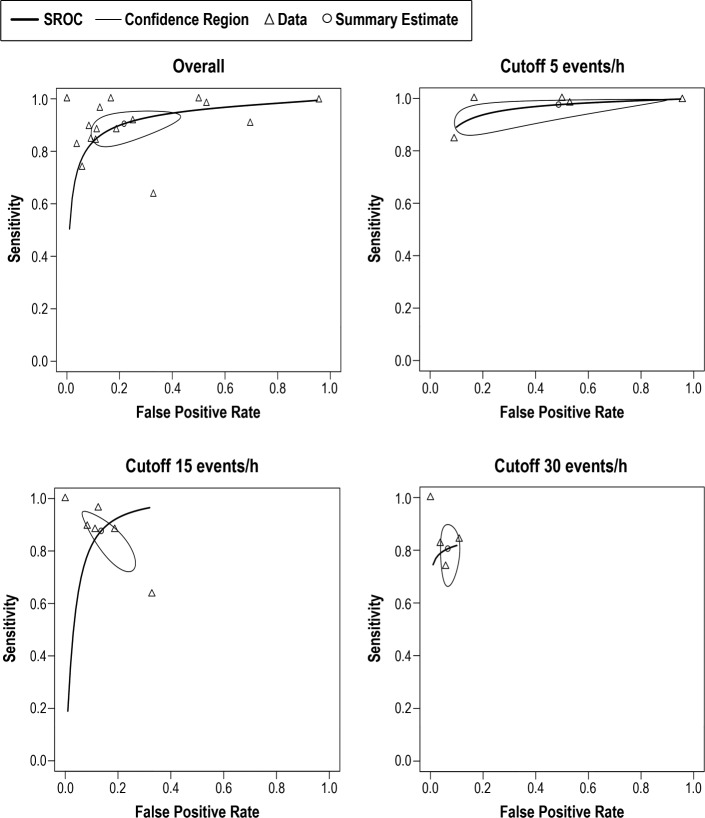
Bed/mattress-based devices were found to have the best sensitivity overall (0.921, 95% CI 0.870, 0.953) (Table 2). The bivariate random-effects meta-analysis of the bed/mattress-based devices showed that the sensitivity decreased and spec-ificity increased at higher AHI threshold values. Based on a pretest probability of 0.6 (IQR 0.42, 0.77), the overall median PPV and NPV was respectively 0.87 (IQR 0.83, 0.94), and 0.9 (IQR 0.82, 0.94) (Table 4). The highest median PPV was found in the severe threshold (0.92, IQR 0.83, 0.92), and the highest median NPV was found in moderate cases (0.92, IQR 0.92, 0.94). As shown by the SROC curves on Figure 3, the severe and moderate OSA detection presented with the lowest degree of heterogeneity. Overall, the variability in specificity is shown to be larger than the variability in sensitivity results across all thresholds values, with the exception of severe OSA diagnosis.
Table 4.
PPV and NPV of OSA diagnosis and severity classification in studies using laboratory PSG as a comparison.
Figure 3. SROC curves for bed/mattress-based sensors overall and at AHI cutoff values of 5, 15, and 30 events/h.
Pooled data of the sensitivity and false positive results of index tests evaluating bed/mattress-based sensors. Not all studies are included in each AHI threshold shown, and the number of studies included depended on the information available by the authors. AHI = apnea-hypopnea index, SROC = summary receiver operating characteristic.
Contactless Devices (Other Than Bed/Mattress-Based Sensors)
The studies were performed in Spain, United States, Ireland, and Germany. All studies used a similar design (cross-sectional) and recruitment strategy (adults suspected of OSA referred to a sleep center). Four studies assessed devices that estimated AHI using data from participant's respiratory and body movement obtained either through the emitting of sound waves (Nandakumar et al.29), the emission of low-power radiofrequency energy (Zaffaroni et al.30 and Weinreich et al.31), or by using a piezoelectric sensor (Davidovich et al.32). Espinoza-Cuadros et al. used photograph images and speech recordings, estimating AHI through a standard vector machine (SVM) analysis,33 and Abad et al. used video recordings to analyze respiratory and body movement, estimating AHI through a SVM.34 With the exception of sex distribution, the demographic characteristics of participants were similar across studies. Espinoza-Cuadros et al. recruited only male participants.33 The mean age varied from 48.4 to 53.1 years, and the mean BMI varied from 30 to 34.3 kg/m2 (Table 5).
Table 5.
Demographic characteristics of participants.
Only one study (Espinoza-Cuadros et al.33) was a QUADAS-2 evaluation performed with more than one domain presenting a high risk of bias or applicability issues (Table 3). In this study, the threshold used to confirm the diagnosis of OSA in high-risk patients for both the index and standard tests was higher than what is currently recommended (AHI ≥ 10 events/h). However, upon request, the authors provided the data that enabled the analysis of OSA detection at AHI ≥ 5 events/h.
All six studies were included in our quantitative analysis. All studies evaluated the accuracy for screening moderate OSA (AHI ≥ 15 events/h), but only five and four studies assessed OSA at the thresholds of 5 and 30 events/h, respectively. A sensitivity and specificity forest plot of all studies is shown in Figure 2 and Figure 4. A total of 594 participants were included in the analysis. One study (Abad et al.34) did not provide sex distribution data. Among those providing such data, 484 (88.9%) were male, and 60 (11.03%) were female participants.
Figure 4. Forest plot of index tests specificity at different AHI thresholds.
Specificity and confidence intervals of all studies that provided false positive, false negative, true positive, and true negative in each group category. All AHI thresholds tested in the respective studies, including AHI thresholds not included in the meta-analysis are shown (AHI > 10, 25, 40 events/h). AHI = apnea-hypopnea index.
The sensitivity of bivariate meta-analysis of the contactless based devices can be seen in the Table 2. The overall sensitivity of contactless devices to detect OSA was 0.905 (95% CI 0.839, 0.946). The sensitivity to detect mild OSA cases was the highest of all groups (0.976, 95% CI 0.899, 0.995), but provided a high false positive rate (0.487, 95% CI 0.137, 0.851). Based on a pretest probability of 0.54 (IQR 0.41, 0.70), the median PPV and NPV was 0.89 (IQR 0.81, 0.93) and 0.89 (0.76, 0.94), respectively (Table 4). Both PPV and NPV were highest at moderate threshold levels. As shown in the SROC curves on Figure 5, the studies were fairly homogeneous, with the exception of a few outliers. For moderate and severe OSA, the variability of sensitivity is shown to be larger than the variability in specificity. For a cutoff value of 5 events/h, the sensitivity values are shown to present a very low degree of variability. The same is not true for specificity values, shown to be highly heterogeneous.
Figure 5. SROC curves for contactless devices overall and at AHI cutoff values of 5, 15, and 30 events/h.
Pooled data of the sensitivity and false positive results of index tests evaluating contactless devices. Not all studies are included in each AHI threshold shown, and the number of studies included depended on the information available by the authors. AHI = apnea-hypopnea index, SROC = summary receiver operating characteristic.
Contact Devices With Three or More Sensors
Although all studies were performed in a sleep center, only Benistant provided information on a specific location (The Netherlands).35 For all three studies, data were collected through a pulse oximeter and at least one accelerometer.22,35,36 Al-Mardini et al.36 was the only study using a built-in smart-phone accelerometer. Additionally, Al-Mardini et al. and Rofouei et al. used a microphone to capture sound,22,36 and Benistant used a nasal cannula pressure sensor.35
Overall, the quality of studies evaluating contact devices with three or more sensors was low. None of the studies specified the in-laboratory PSG channel montage, and most did not provide study participants' demographic data. The study by Benistant was evaluated as having a low risk of bias and applicability problems in all domains of the QUADAS-2 assessment (Table 3) and the only one that showed the average age (40.3 ± 11.1 years) and BMI (28.7 ± 3.0 kg/m2) of participants.35 The study by Al-Mardini et al. was poorly rated as the standard and index tests were not done simultaneously, and it was unclear if the standard laboratory PSG was performed at the same laboratory for all participants. Additionally, the selected controls were healthy subjects with no symptoms of OSA.36
Two studies were included in our quantitative analysis. The study by Rofouei et al. was a case study, and calculating true positive/negative and false positive/negative values was not possible.22 Among studies included in the quantitative analysis, there were 24 participants, of which 20 (83.3%) were male and 4 (16.7%) were female (Table 5). All studies assessed OSA screening at an AHI threshold of 5 events/h, except that of Al-Mardini et al., which only evaluated the classification of moderate and severe OSA.36 For that reason, the bivariate meta-analysis of severity classification was not possible.
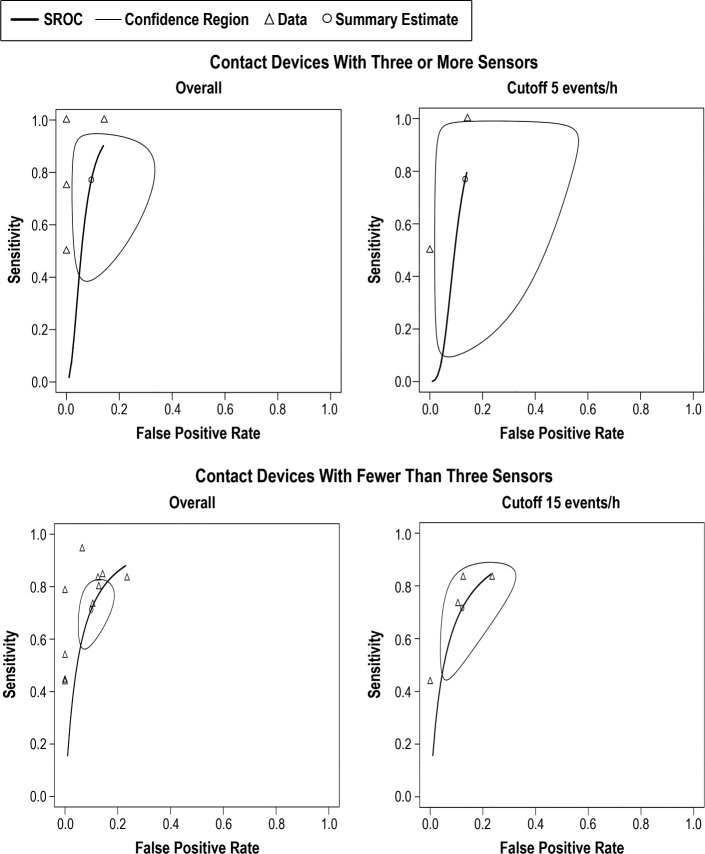
In general, the index test using devices with at least three sensors provided low sensitivity rates, with substantially large CIs. The sensitivity and false positive rate of devices using at least three sensors is shown in the Table 2. The overall sensitivity was 0.771 (95% CI 0.466, 0.929). As shown in Table 4, this group of devices have also shown the lowest overall PPV median value of all groups (0.83, IQR 0.50, 0.89). As presented by the SROC curves on Figure 6, the summary results of the index tests using devices with at least three sensors presented a high degree of heterogeneity, showing a high degree of variability specially in sensitivity results.
Figure 6. SROC curves for contact devices with three or more sensors overall and at AHI cutoff 5 events/h and contact devices with fewer than three sensors overall and at AHI cutoff 15 events/h.
Pooled results of the sensitivity and false positive results of the contact devices with three or more sensors and fewer than sensors are shown. Not all studies are included in each AHI threshold shown, and the number of studies included depended on the information available by the authors. AHI = apneahypopnea index, SROC = summary receiver operating characteristic.
Contact Devices With Three or More Sensors
The studies were performed in Turkey, Japan, the United States, and in unspecified locations. Both Dinç et al.37 and Ozmen et al.38 evaluated the SleepStrip device containing air flow sensors as their index test, and presented with a low risk of bias in the QUADAS-2 evaluations (Table 3). Levendowski et al.39 and Selvaraj et al.40 evaluated the use of a neckworn device and a chest device, respectively, and presented with mostly unclear risk of bias for four of the seven domains being evaluated. Levendowski et al. included participants with previous diagnosis of OSA performing split-night testing, and it was unclear if the index test results were interpreted without the knowledge of the researchers.39 Selvaraj et al. used a broad exclusion criteria, including the exclusion of severe behavioral and neurological problems and did not provide the number of participants excluded from the study.40 Nakano et al. used snoring sounds recordings to estimate AHI in a group of symptomatic patients with suspicion of OSA attending a sleep center.13 The study by Nakano et al. showed a high risk of bias for patient selection in the QUADAS-2 evaluation (Table 3), relating no clear exclusion criteria. Additionally, it was unclear if the results of the standard test were analyzed without the knowledge of the index results. With the exception of the study by Selvaraj et al., all studies used a similar cross-sectional design. All studies used a standard channel montage of the laboratory PSG. There was a low variability of mean age (46–51.4 years) and mean BMI (29–31.1 kg/m2), but not all studies provided demographic information (Table 5).
Ozmen et al. and Selvaraj et al. only provided data for the screening of moderate OSA.38,40 The sensitivity and specificity of other comparable thresholds were not provided. A sensitivity and specificity forest plot of all studies, with the exception of the study by Nakano et al., which did not provide true positive, false positive, true negative, and false negative data, is shown in Figure 2 and Figure 4. Nakano et al. evaluated 10 participants to define snoring parameters, and found a high correlation between the smartphone and the PSG snoring time when testing the parameters in 40 additional subjects. However, the sensitivity for detecting OSA in moderate and severe patients was low (0.70 and 0.77, respectively). Nakano et al. did not provide the sensitivity or specificity of detecting OSA in mild cases.13
Overall, there were a total of 208 participants included in the analysis, of which 70.4% were males and 29.6% were females. The devices with less than three sensors provided the lowest sensitivity rates of all index study types (0.713, 95% CI 0.594, 0.808), and showed large CI in all thresholds being evaluated (Table 2). Overall median PNV and NPV was 0.90 (IQR 0.87, 0.93), and 0.80 (IQR 0.67, 0.87), respectively (Table 4). Additionally, devices with less than three sensors showed the lowest NPV median values of all groups at all threshold levels, but especially in screening mild cases (0.48, IQR 0.29, 0.67). Overall, as shown of the SROC curves on Figure 6, the test results were highly heterogeneous.
Studies With Home-Based PSG as Standard Comparison
Only the second arm of the Levendowski et al. study compared the index test with an in-home PSG. Levendowski et al. evaluated a device capturing sound and actigraphy data in a group of snorers recruited through a journal announcement.39
Levendowski et al. tested subjects at the home setting for 3 days, but only during the first night all 24 subjects were able to complete the study. The sensitivity of detecting mild and moderate OSA on night 1 were 0.71 and 1.00, respectively, and the specificity was 0.75 and 0.73. Data were available for analysis of 21 and 19 participants on nights 2 and 3. For the subsequent nights, the sensitivity of detecting mild and moderate OSA was 0.85 and 1.00, respectively, and the specificity was 0.87 and 0.81.39
Snoring
We included two studies that evaluated the accuracy of detecting snoring sounds using wearable electronic devices or devices with a smartphone built-in microphone. Both studies indicated a low risk of applicability and a high or unclear risk of bias for the reference and index test domains by QUADAS-2 assessment (Table 3). Results from the study by Kreivi et al.41 were generally classified as having a low risk of bias. Camacho et al.16 did not use a prespecified threshold for snoring classification, and therefore the study results were evaluated as having a high risk of bias for the interpretation of the index test.
Kreivi et al. looked at 173 participants who were either snorers or who had a previous OSA diagnosis.41 Snoring was recorded during the PSG with two microphones: one attached to the throat and the other to the ceiling; an MP3 device was attached to the patient's collar. Results of the MP3 snoring recording were compared to the snoring recordings from the PSG. By comparing the percentage of snoring time detected in the index test to the snoring time detected by a home PSG, the researchers obtained a sensitivity and specificity of 0.92 and 0.60, respectively.
Camacho et al. compared the snore number detected by a smartphone application (Quit Snoring), and compared it to a laboratory PSG in two participants. The measured application smartphone sensitivity was set to 53 dB, with detailed, second-by-second evaluation of the smartphone graph, and with playback of the individual snoring events evaluated with time synchronized PSG.16 They found a sensitivity of snore detection of 0.96 and 0.64 for participant 1 and 2, respectively.
DISCUSSION
Increasing the detection of and access to treatment of patients suffering from OSA would not only alleviate the burden associated with the disease, but also has the potential to lead to important cost savings. Current estimates showed that under-diagnosing OSA in the United States has cost about $149.6 billion in 2015 alone, and that diagnosis of OSA and treating patients would cost far less than no diagnosis.42 The delay in screening and evaluating sleep by primary practitioners and the high costs of testing are among the barriers for diagnosis and treatment of SDB.42
Digital health has the potential to improve patient involvement and access to adequate care, and it could lead to more personalized, precise disease management. However, its implementation in the current medical care practice routine and structure is not without challenges. By grouping devices by type of sensors being used, the current study was able to evaluate the overall sensitivity and specificity of comparable devices. This systematic review and meta-analysis shed some much-needed light on the potential of novel tools and mobile technologies to screen patients with symptoms of SDB. It also highlights that further studies of good quality are needed before these tools and technologies can be recommended for clinical use.
Based on current available published data, bed/mattress-based devices and contactless devices were shown to have the greatest potential for the use in screening and possibly monitoring OSA. Bed/mattress-based devices were found to have the best sensitivity overall, as well as the best sensitivity in detecting moderate and severe cases. Although the sensitivity for contactless devices to detect mild OSA cases was the highest of all groups (0.976, 95% CI 0.899, 0.995), it was so at the expense of a high false positive rate (0.487, 95% CI 0.137, 0.851). The remaining groups of devices showed overall low sensitivity rates and highly heterogeneous results and would unlikely screen patients with SDB symptoms effectively.
In all four groups of devices and at all threshold levels, the median values of the PPV were higher than their respective pretest probability. However, the pretest probability shown in this systematic review was based on the OSA prevalence of the participants evaluated in the included studies. Almost exclusively, the studies evaluated symptomatic patients who were referred to a sleep clinic and do not reflect the prevalence of SDB in the overall population. As such, both the PPV and NPV median values summarized in this systematic review would differ from what is reported if the overall population prevalence could be considered.
When evaluating the available data on novel tools assessing the screening of snoring, the paucity of studies comparing such devices with PSG was made evident. Only two studies were included in our analysis, and the different methodology used for quantifying snore—one study used percentage of snoring, and another used the number of snores—did not allow for a meta-analysis of the data.
Most studies evaluated the indexes tested in a controlled laboratory setting. Because of the potential utilization of those devices as a low-cost and accessible screening method, additional research should evaluate the sensitivity and specificity of those devices in detecting OSA when used at home, where multiple factors—such as environmental noise and the lack of administration by a trained professional—might reduce the accuracy of such devices.
CONCLUSIONS
Sleep medicine is a prime field for utilization of digital health tools, and there is a wealth of available sleep-related sensors. Based on current available published data, bed/mattress-based devices and contactless devices were shown to have the greatest potential for use in screening and possibly monitoring OSA. Bed/mattress-based devices were found to have the best sensitivity overall, as well as the best sensitivity in detecting moderate and severe cases. However, given the paucity of studies comparing novel tools to the gold-standard PSG, adequate clinical data and strategies for care implementation are needed before they can be recommended for use in screening SDB. Finally, further studies evaluating the accuracy of those devices in detecting OSA when used at home are needed.
DISCLOSURE STATEMENT
Work for this study was performed at the University of California, San Francisco. All authors have seen and approved the manuscript. The authors report no conflicts of interest.
ABBREVIATIONS
- AHI
apnea-hypopnea index
- BMI
body mass index
- HSAT
home sleep apnea test
- OSA
obstructive sleep apnea
- PSG
polysomnography
- RDI
respiratory disturbance index
- SDB
sleep-disordered breathing
- SROC
summary receiver operating characteristics
- SVM
standard vector machine
REFERENCES
- 1.Laposky AD, Van Cauter E, Diez-Roux AV. Reducing health disparities: the role of sleep deficiency and sleep disorders. Sleep Med. 2016;18:3–6. doi: 10.1016/j.sleep.2015.01.007. [DOI] [PMC free article] [PubMed] [Google Scholar]
- 2.Peppard PE, Young T, Barnet JH, Palta M, Hagen EW, Hla KM. Increased prevalence of sleep-disordered breathing in adults. Am J Epidemiol. 2013;177(9):1006–1014. doi: 10.1093/aje/kws342. [DOI] [PMC free article] [PubMed] [Google Scholar]
- 3.Institute of Medicine (US) Committee on Sleep Medicine and Research. Sleep Disorders and Sleep Deprivation: An Unmet Public Health Problem. Washington, DC: National Academies Press; 2006. [PubMed] [Google Scholar]
- 4.Borsini E, Blanco M, Bosio M, Tullio D, Ernst G, Salvado A. “Diagnosis of sleep apnea in network” respiratory polygraphy as a decentralization strategy. Sleep Sci. 2017;9(3):244–248. doi: 10.1016/j.slsci.2016.10.009. [DOI] [PMC free article] [PubMed] [Google Scholar]
- 5.Fagan JJ. Developing World ENT: a global responsibility. J Laryngol Otol. 2012;126(6):544–547. doi: 10.1017/S0022215112000345. [DOI] [PubMed] [Google Scholar]
- 6.Fagan JJ, Jacobs M. Survey of ENT services in Africa: need for a comprehensive intervention. Glob Health Action. 2009;2(1) doi: 10.3402/gha.v2i0.1932. [DOI] [PMC free article] [PubMed] [Google Scholar]
- 7.Phillips B, Gozal D, Malhotra A. What is the future of sleep medicine in the US. Am J Respir Crit Care Med. 2015;192(8):915–917. doi: 10.1164/rccm.201508-1544ED. [DOI] [PubMed] [Google Scholar]
- 8.Bastawrous A, Hennig B, Livingston I. mHealth possibilities in a changing world. Distribution of global cell phone subscriptions. J Mob Technol Med. 2013;2(1):22–25. [Google Scholar]
- 9.World Health Organization. mHealth: New Horizons for Health Through Mobile Technologies. Geneva, Switzerland: World Health Organization; 2011. Global Observatory for eHealth series - Volume 3. [Google Scholar]
- 10.Phillips G, Felix L, Galli L, Patel V, Edwards P. The effectiveness of M-health technologies for improving health and health services: a systematic review protocol. BMC Res Notes. 2010;3(1):250. doi: 10.1186/1756-0500-3-250. [DOI] [PMC free article] [PubMed] [Google Scholar]
- 11.Number of mobile connections worldwide from 2008 to 2020 (in billions)*. Statista - The Statistics Portal. [Accessed May 7, 2016]; http://www.statista.com.ucsf.idm.oclc.org/statistics/371828/worldwide-mobile-connections/ [Google Scholar]
- 12.United Nations. Concise Report on the World Population Situation in 2014. New York, NY: United Nations; 2014. [Google Scholar]
- 13.Nakano H, Hirayama K, Sadamitsu Y, et al. Monitoring sound to quantify snoring and sleep apnea severity using a smartphone: proof of concept. J Clin Sleep Med. 2014;10(1):73–78. doi: 10.5664/jcsm.3364. [DOI] [PMC free article] [PubMed] [Google Scholar]
- 14.Behar J, Roebuck A, Domingos JS, Gederi E, Clifford GD. A review of current sleep screening applications for smartphones. Physiol Meas. 2013;34(7):R29–R46. doi: 10.1088/0967-3334/34/7/R29. [DOI] [PubMed] [Google Scholar]
- 15.Ko PR, Kientz JA, Choe EK, Kay M, Landis CA, Watson NF. Consumer sleep technologies: a review of the landscape. J Clin Sleep Med. 2015;11(12):1455–1461. doi: 10.5664/jcsm.5288. [DOI] [PMC free article] [PubMed] [Google Scholar]
- 16.Camacho M, Robertson M, Abdullatif J, et al. Smartphone apps for snoring. J Laryngol Otol. 2015;129(10):974–979. doi: 10.1017/S0022215115001978. [DOI] [PubMed] [Google Scholar]
- 17.Epstein LJ, Kristo D, Strollo PJ, Jr, et al. Clinical guideline for the evaluation, management and long-term care of obstructive sleep apnea in adults. J Clin Sleep Med. 2009;5(3):263–276. [PMC free article] [PubMed] [Google Scholar]
- 18.Arnardottir ES, Gislason T. Quantifying airflow limitation and snoring during sleep. Sleep Med Clin. 2016;11(4):421–434. doi: 10.1016/j.jsmc.2016.07.004. [DOI] [PubMed] [Google Scholar]
- 19.QUADAS-2. University of Bristol website. [Accessed November 5, 2017]; http://www.bristol.ac.uk/population-health-sciences/projects/quadas/quadas-2/ [Google Scholar]
- 20.Reitsma JB, Glas AS, Rutjes AW, Scholten RJ, Bossuyt PM, Zwinderman AH. Bivariate analysis of sensitivity and specificity produces informative summary measures in diagnostic reviews. J Clin Epidemiol. 2005;58(10):982–990. doi: 10.1016/j.jclinepi.2005.02.022. [DOI] [PubMed] [Google Scholar]
- 21.Harbord RM, Deeks JJ, Egger M, Whiting P, Sterne JAC. A unification of models for meta-analysis of diagnostic accuracy studies. Biostatistics. 2007;8(2):239–251. doi: 10.1093/biostatistics/kxl004. [DOI] [PubMed] [Google Scholar]
- 22.Rofouei M, Sinclair M, Bittner R, et al. A Non-invasive Wearable Neck-Cuff System for Real-Time Sleep Monitoring. Proceedings from the International Conference on Body Sensor Networks; May 23-25, 2011; Dallas, TX. [Google Scholar]
- 23.Tsukahara M, Sakao S, Jujo T, et al. The accuracy and uncertainty of a sheet-type portable monitor as a screening device to identify obstructive sleep apnea-hypopnea syndrome. Intern Med. 2014;53:1307–1313. doi: 10.2169/internalmedicine.53.2208. [DOI] [PubMed] [Google Scholar]
- 24.Agatsuma T, Fujimoto K, Komatsu Y, et al. A novel device (SD-101) with high accuracy for screening sleep apnoea-hypopnoea syndrome. Respirology. 2009;14(8):1143–1150. doi: 10.1111/j.1440-1843.2009.01627.x. [DOI] [PubMed] [Google Scholar]
- 25.Takasaki Y, Kaneko Y, Sakakibara H, et al. [Clinical usefulness and health-economic benefits of a new sheet-like medical device (SD-101) for the diagnosis of sleep apnea syndrome] Nihon Kokyuki Gakkai Zasshi. 2008;46(3):181–188. [PubMed] [Google Scholar]
- 26.Beattie ZT, Hayes TL, Guilleminault C, Hagen CC. Accurate scoring of the apnea-hypopnea index using a simple non-contact breathing sensor. J Sleep Res. 2013;22(3):356–362. doi: 10.1111/jsr.12023. [DOI] [PMC free article] [PubMed] [Google Scholar]
- 27.Norman MB, Middleton S, Erskine O, Middleton PG, Wheatley JR, Sullivan CE. Validation of the Sonomat: a contactless monitoring system used for the diagnosis of sleep disordered breathing. Sleep. 2014;37(9):1477–1487. doi: 10.5665/sleep.3996. [DOI] [PMC free article] [PubMed] [Google Scholar]
- 28.Tenhunen M, Elomaa E, Sistonen H, Rauhala E, Himanen SL. Emfit movement sensor in evaluating nocturnal breathing. Respir Physiol Neurobiol. 2013;187(2):183–189. doi: 10.1016/j.resp.2013.03.009. [DOI] [PubMed] [Google Scholar]
- 29.Nandakumar R, Gollakota S, Watson N. Contactless sleep apnea detection on smartphones. Proceedings of the 13th Annual International Conference on Mobile Systems, Applications, and Services; May 19-22, 2015; Florence, Italy. [Google Scholar]
- 30.Zaffaroni A, Kent B, O'Hare E, et al. Assessment of sleep-disordered breathing using a non-contact bio-motion sensor. J Sleep Res. 2013;22(2):231–236. doi: 10.1111/j.1365-2869.2012.01056.x. [DOI] [PubMed] [Google Scholar]
- 31.Weinreich G, Terjung S, Wang Y, Werther S, Zaffaroni A, Teschler H. Validierung von SleepMinder als Screeninggerat fur die obstruktive Schlafapnoe. Somnologie. 2014;18(4):238–242. [Google Scholar]
- 32.Davidovich MLY, Karasik R, Tal A, Shinar Z, Gan R, Sheva B. Sleep apnea screening with a contact-free under-the-mattress sensor methods. Comput Cardiol. 2016;43:849–852. [Google Scholar]
- 33.Espinoza-Cuadros F, Fernandez-Pozo R, Toledano DT, Alcazar-Ramirez JD, Lopez-Gonzalo E, Hernandez-Gomez LA. Speech signal and facial image processing for obstructive sleep apnea assessment. Comput Math Methods Med. 2015;2015:489761. doi: 10.1155/2015/489761. [DOI] [PMC free article] [PubMed] [Google Scholar]
- 34.Abad J, Muñoz-Ferrer A, Cervantes MÁ, et al. Automatic video analysis for obstructive sleep apnea syndrome diagnosis. Sleep. 2016;39(8):1507–1515. doi: 10.5665/sleep.6008. [DOI] [PMC free article] [PubMed] [Google Scholar]
- 35.Benistant JR. Sleep Apnoea Detection Using Small & Cheap Sensors [master's thesis] The Netherlands: University of Twente; 2016. [Google Scholar]
- 36.Al-Mardini M, Aloul F, Sagahyroon A, Al-Husseini L. Classifying obstructive sleep apnea using smartphones. J Biomed Inform. 2014;52:251–259. doi: 10.1016/j.jbi.2014.07.004. [DOI] [PubMed] [Google Scholar]
- 37.Dinç AE, Yılmaz M, Tutar H, et al. Reliability of SleepStrip as a screening test in obstructive sleep apnea patients. Eur Arch Otorhinolaryngol. 2014;271(10):2813–2818. doi: 10.1007/s00405-014-3087-2. [DOI] [PubMed] [Google Scholar]
- 38.Ozmen OA, Tüzemen G, Kasapoğlu F, et al. The reliability of SleepStrip as a screening test in obstructive sleep apnea syndrome. Kulak Burun Bogaz Ihtis Derg. 2011;21(1):15–19. [PubMed] [Google Scholar]
- 39.Levendowski DJ, Veljkovic B, Seagraves S, Westbrook PR. Capability of a neck worn device to measure sleep/wake, airway position, and differentiate benign snoring from obstructive sleep apnea. J Clin Monit Comput. 2015;29(1):53–64. doi: 10.1007/s10877-014-9569-3. [DOI] [PMC free article] [PubMed] [Google Scholar]
- 40.Selvaraj N, Narasimhan R. Automated prediction of the apnea-hypopnea index using a wireless patch sensor. Conf Proc IEEE Eng Med Biol Soc. 2014;2014:1897–1900. doi: 10.1109/EMBC.2014.6943981. [DOI] [PubMed] [Google Scholar]
- 41.Kreivi HR, Salmi T, Maasilta P, Bachour A. Screening of snoring with an MP3 recorder. Sleep Breath. 2013;17(1):77–84. doi: 10.1007/s11325-012-0652-z. [DOI] [PubMed] [Google Scholar]
- 42.Frost & Sullivan; American Academy of Sleep Medicine. Hidden health crisis costing America billions: underdiagnosing and undertreating obstructive sleep apnea draining health care system. [Accessed May 19, 2018]; http://aasm.org/wp-content/uploads/2017/10/sleep-apnea-economic-crisis.pdf. Published August 8, 2016. [Google Scholar]
Associated Data
This section collects any data citations, data availability statements, or supplementary materials included in this article.


