

ABSTRACT
Background
The Mediterranean diet (MD) is widely recommended for the prevention of chronic disease, but evidence for a beneficial effect on bone health is lacking.
Objective
The aim of this study was to examine the effect of a Mediterranean-like dietary pattern [NU-AGE (New Dietary Strategies Addressing the Specific Needs of the Elderly Population for Healthy Aging in Europe)] on indexes of inflammation with a number of secondary endpoints, including bone mineral density (BMD) and biomarkers of bone and collagen degradation in a 1-y multicenter randomized controlled trial (RCT; NU-AGE) in elderly Europeans.
Design
An RCT was undertaken across 5 European centers. Subjects in the intervention group consumed the NU-AGE diet for 1 y by receiving individually tailored dietary advice, coupled with supplies of foods including whole-grain pasta, olive oil, and a vitamin D3 supplement (10 µg/d). Participants in the control group were provided with leaflets on healthy eating available in their country.
Results
A total of 1294 participants (mean ± SD age: 70.9 ±4.0 y; 44% male) were recruited to the study and 1142 completed the 1-y trial. The Mediterranean-like dietary pattern had no effect on BMD (site-specific or whole-body); the inclusion of compliance to the intervention in the statistical model did not change the findings. There was also no effect of the intervention on the urinary biomarkers free pyridinoline or free deoxypyridinoline. Serum 25-hydroxyvitamin D significantly increased and parathyroid hormone decreased (P < 0.001) in the MD compared with the control group. Subgroup analysis of individuals with osteoporosis at baseline (site-specific BMD T-score ≤ −2.5 SDs) showed that the MD attenuated the expected decline in femoral neck BMD (n = 24 and 30 in MD and control groups, respectively; P = 0.04) but had no effect on lumbar spine or whole-body BMD.
Conclusions
A 1-y intervention of the Mediterranean-like diet together with vitamin D3 supplements (10 µg/d) had no effect on BMD in the normal age-related range, but it significantly reduced the rate of loss of bone at the femoral neck in individuals with osteoporosis. The NU-AGE trial is registered at clinicaltrials.gov as NCT01754012.
Keywords: Osteoporosis, bone, Mediterranean diet, Vitamin D supplementation, older adults
INTRODUCTION
A Mediterranean dietary pattern (MD), which is widely recommended for the prevention of chronic disease, is characterized by a high intake of fruit, vegetables, nuts, unrefined cereals, and olive oil; a moderately high intake of fish; a low-to-moderate intake of dairy products; a low intake of meat; and a moderate intake of alcohol (1, 2). Data from prospective cohort studies show that greater adherence to an MD is associated with a significant improvement in health status, including reduced total mortality (2) and reduced incidence of cardiovascular disease, cancer, and Parkinson and Alzheimer disease (3). Randomized controlled trials (RCTs) confirm that the MD may protect against vascular disease, although the quantity and quality of evidence available are limited and highly variable (4).
There are few studies examining the association between an MD and bone health [bone mineral density (BMD) and fracture incidence] and the available data are conflicting (5). A review of population-based studies, which focused on fracture as an outcome (6), suggested that one of the modifiable risk factors for bone health is adherence to an MD. This conclusion was based on post hoc analysis of longitudinal data from 93,676 women aged 50–79 y at the start of the Women's Health Initiative study, which reported that higher adherence to an MD was associated with a lower risk of hip fractures (7). The authors are not aware of any other RCTs investigating the effect of the MD on measures of bone health, presumably due to the difficulties of undertaking a dietary intervention that is long enough (i.e., minimum 1-y duration) to be able to detect changes in BMD.
The primary outcome of this multicenter RCT [NU-AGE (New Dietary Strategies Addressing the Specific Needs of the Elderly Population for Healthy Aging in Europe)] was to examine the effect of consuming a Mediterranean-like dietary pattern for 1 y on inflammatory response in elderly Europeans. In addition, there were 15 prespecified secondary outcomes, including the effect of the MD on bone health status (BMD and biomarkers of bone and collagen degradation). The Mediterranean-like dietary pattern was tailored individually to complement habitual dietary patterns to maximize compliance.
METHODS
The NU-AGE trial was conducted in 5 European centers (Bologna in Italy, Norwich in the United Kingdom, Wageningen in the Netherlands, Warsaw in Poland, and Clermont-Ferrand in France). A detailed description of the European Commission–funded NU-AGE project has been reported elsewhere (8).
Ethics approval
Local ethical approval was provided by the Independent Ethics Committee of the Sant’ Orsola-Malpighi Hospital Bologna (Italy), the National Research Ethics Committee–East of England (United Kingdom), the Wageningen University Medical Ethics Committee (Netherlands), the Bioethics Committee of the Polish National Food and Nutrition Institute (Poland), and the South-East 6 Person Protection Committee (France). All study procedures were in accordance with the ethical standards of the Helsinki Declaration. All participants gave informed consent before participating. The trial was registered at clinicaltrials.gov (NCT01754012).
Participants
Recruitment and selection criteria have been reported previously (9). Briefly, 1294 participants aged 65–79 y were recruited through local advertisements, media publicity, and general practitioner practices between April 2012 and January 2014 at the 5 recruitment centers. Study participants were free-living and responsible for their own dietary choices. Ineligibility criteria included any clinically diagnosed chronic disease, use of corticosteroids or insulin medications, recent use of antibiotics or vaccinations, recent change in habitual medication, presence of food allergy or intolerance necessitating a special diet, presence of frailty according to the Fried criteria (10), or malnutrition [defined as BMI (kg/m2) <18.5 or >10% weight loss in the previous 6 mo). Participants were randomly allocated to the intervention or control group (1:1 allocation ratio) after stratification by sex, age, frailty status (prefrail or nonfrail), and BMI. Randomization was performed by entering the described variables of a subject into a computer program that automatically allocates and generates a unique ID code. Participants were informed about their group after randomization. Technicians performing laboratory analysis were blinded to the group assignment, but researchers carrying out BMD measurements were not blinded because of practical impossibilities, including the fact that the participants themselves knew which group they were in and were in a position to discuss this with researchers while undergoing measurements.
Dietary intervention
Participants randomly assigned to the intervention group received individually tailored standardized dietary advice in order to meet the study dietary requirements, as described previously (9). The NU-AGE food-based dietary guidelines were based on nutrient reference values and food-based dietary recommendations for older adults from each of the 5 countries where the intervention took place, the modified MyPyramid for Older Adults, and nutrient requirements from the European Commission and the Institute of Medicine (9). The individually tailored dietary advice, either given face-to-face or by telephone by a trained dietician or research nutritionist, was administered 9 times during the year and supported by mail or e-mail. To aid compliance, participants in the intervention group received commercially available foods to help them meet the dietary guidelines, including whole-grain pasta, olive oil, high-MUFA and high-PUFA margarine, and low-fat, low-salt cheese in all centers and frozen vegetable soup (in Italy only) and vitamin D3 supplements. The reason for giving a low-dose vitamin D supplement was not to “optimize” vitamin D status per se but to minimize differences between study sites (which covered North, South, East, and West Europe) in which habitual diet and sunlight exposure could affect vitamin D status. In order to reduce participant burden, 3-d food diaries were completed and unused vitamin D3 supplements were returned at months 4 and 8 in order to evaluate follow-up adherence and use of the provided foods. Participants randomly assigned to the control group were asked to continue with their usual diet for the year and only received a generally available leaflet with national dietary guidance.
Compliance to the study protocol in both the intervention and control groups was evaluated with 7-d food diaries at the start and end of the 1-y intervention. A scoring system was developed to measure adherence to the diet; 16 dietary components were included, 12 for which the highest intakes were ideal (fruit, vegetables, legumes, low-fat dairy and cheese, fish, lean meat and poultry, nuts, eggs, olive oil, fluids, and vitamin D supplements), 2 for which moderate intake was ideal (whole grains and alcohol), and 2 for which low intakes were ideal (salt and sweets). Each component was scored proportionally from 0 to 10 and contributed equally to the final score, which ranged from 0 to 160, with a higher score representing better adherence to the diet. High compliers were defined as participants whose change in the NU-AGE index was ranked in the top 2 quintiles and low compliers were those in the lowest 2 quintiles.
Outcome assessment
At baseline and after 1 y, trained nurses or researchers measured whole-body BMD with the use of dual-energy X-ray absorptiometry (DXA) according to standard protocols and training [Discovery Wi; software version 2.3.1 Hologic, Inc (Norwich, United Kingdom); Lunar iDXA; GE Health Care; enCORE 2011 software version 13.6 (Bologna, Italy); Discovery QDR, software version 3; Hologic, Inc. (Clermont-Ferrand, France); Lunar Prodigy; GE Health Care; enCORE 2011 software version 13.6 (Wageningen, Netherlands, and Warsaw, Poland)]. In addition, at 3 of the intervention sites (Italy, United Kingdom, and Poland) BMD was assessed at predefined anatomic regions, including the lumbar spine (L1–L4) and proximal femur (including total hip and femoral neck BMD). Osteoporosis was defined as a T-score of ≤ −2.5 SDs below peak bone mass (11).
Measurements of urine free pyridinoline and free deoxypyridinoline
A complete 24-h urine collection was conducted at the beginning and end of the intervention, and aliquots were stored at −80°C until analysis. Free pyridinium cross-links in urine were measured by liquid chromatography–tandem mass spectrometry (LC-MS/MS), as described elsewhere (12). In brief, the LC-MS/MS method quantified free pyridinoline (fPYD) and free deoxypyridinoline (fDPD) simultaneously from a single-sample analysis. fPYD and fDPD were calibrated with the use of commercial standards (Immundiagnostik) and acetylated pyridinoline as internal standard. Before LC-MS/MS analysis, a solid-phase extraction procedure was carried out on urine samples pretreated with hydrochloric acid. The acidified samples were extracted with the use of cellulose-packed columns and eluted with 0.2% heptafluoro-butyric acid in water. The inter- and intra-assay CVs were ≤9.9% between the assay working range of 2–200 nmol/L. fPYD and fDPD results obtained from LC-MS/MS analysis were adjusted against urine creatinine measurements, which was performed on the COBAS C501 analyzer (Roche). The inter- and intra-assay CV was ≤3.1% across the assay working range (375–55,000 µmol/L).
Measurement of serum 25-hyroxyvitamin D and parathyroid hormone
Concentrations of total 25-hydroxyvitamin D (25(OH)D; i.e., 25-hydroxyvitamin D2 plus 25-hydroxyvitamin D3 [25(OH)D3]) in all serum samples were measured at the laboratory of the Cork Center for Vitamin D and Nutrition Research with the use of a slightly modified version of the LC-MS/MS method, which has been described in detail elsewhere (13) and is certified by the CDC Vitamin D Standardization Certification Program (14). The modifications were effected so as to reduce the total run time per sample from 10 min in our existing method to 7 min in the current method, thereby increasing our efficiency of analysis of the sample loads (see Supplemental Table 1 for details of gradient and multiple-reaction-monitoring parameters). The 3-epimer of 25(OH)D3 was chromatographically resolved from 25(OH)D3, and the isotopically labeled d3-3-epi-25(OH)D3 was used as an internal standard to verify retention time and separation of 3-epi-25(OH)D3 and 25(OH)D3 in each sample run. The mean intra-and interassay CVs of the methods were 3.9% and 6.5%, respectively, for 25(OH)D3 (using low, medium, and high concentrations of 33.5, 49.2, and 86.2 nmol/L, respectively). The mean intra-assay and interassay CVs of the method were 12% and 7.1%, respectively, for 25(OH)D2 (using low, medium, and high concentrations of 1.10, 6.57, and 13.9 nmol/L, respectively).
Serum parathyroid hormone (PTH) concentrations were measured at the Cork Center for Vitamin D and Nutrition Research in all serum samples with the use of an ELISA (intact PTH; MD Biosciences, Inc.) Intra-assay and interassay CVs were 3.0% and 5.1%, respectively (at a concentration of 47.7 and 52.6 pg/mL, respectively).
Statistical analysis
The power calculation for the estimation of the required sample size for this trial was based on a change in C-reactive protein (CRP; as the primary outcome measure) of 0.6 mg/L (SD: 4), which required a sample size of 1000 participants (2-sided, 80% power, and 0.05 α). We increased this number to 1250 to account for an anticipated drop-out rate of 20%. A previous study examining the effect of a dietary intervention and consumption of fortified dairy products for 12 mo on spine BMD in postmenopausal women observed changes of −0.045 g/cm2 in the control group, 0.008 g/cm2 in the calcium-supplemented group, and 0.053 g/cm2 in the dietary intervention group (15). On the basis of these data we would need 36 participants (18/ group) to observe an effect on spinal BMD (2-sided, 99% power, and 0.05 α). This indicated that we had a sufficient number of osteoporotic participants in our study to conduct stratified analysis on the effect of MD on BMD.
The normality of the data for each variable was tested using the Skewness-Kurtosis test. Baseline characteristics are presented as means ± SDs or n (%) for categorical variables, and baseline between-group differences were assessed by using independent-sample t tests or chi-square tests. The effect of the intervention on changes in BMD and bone biomarkers was assessed by using linear mixed-effect models with participant included as a random effect, time, treatment group, and time × treatment group interaction as fixed effects, and the explanatory variables study center, age, sex, baseline BMI, baseline calcium intakes, and baseline 25(OH)D. Where we observed a significant time × treatment interaction, we also tested if there was a study center effect by including a 3-way time × treatment × study center interaction term in the model. For each variable, values <3 or >3 SDs from the mean were considered outliers and removed. We also conducted sensitivity analysis repeating the main analysis with outliers included in the data set. Because data were not normally distributed, the models were fitted on a log-transformed scale. To account for multiple testing, we applied a Bonferroni correction, with 8 tests/group (3 BMD measures and 5 biomarkers). We calculated the site-adjusted mean difference in intake of dietary components associated with bone health using ANCOVA. Data were analyzed with the use of Stata version 14 (StataCorp).
RESULTS
Of the 1294 participants recruited to the NU-AGE study, n = 1142 completed the study (11.7% drop-out rate) (Supplemental Figure 1). Of these completers, n = 562 in the control group and n = 555 in the intervention group had whole-body DXA scans at baseline and follow-up and complete covariate data (97.8%). There were no significant differences in baseline characteristics between the 2 groups (Table 1). Osteopenia (defined as a lumbar spine T-score of <−1.5 SD below peak bone mass) was present in 37% and osteoporosis (defined as a lumbar spine T-score of <2.5 SDs below peak bone mass) was present in 8% of participants at baseline.
TABLE 1.
Baseline characteristics of the NU-AGE study participants according to intervention group1
| Intervention diet | Control diet | ||||
|---|---|---|---|---|---|
| Characteristic | Total n | Value | Total n | Value | P |
| Female sex, n (%) | 632 | 363 (57.4) | 644 | 356 (55.3) | 0.437 |
| Age, y | 632 | 70.7 ± 4.1 | 643 | 71.1 ± 3.9 | 0.046 |
| BMI, kg/m2 | 633 | 26.9 ± 4.2 | 643 | 26.7 ± 3.8 | 0.492 |
| Calcium intakes, g/d | 618 | 618 ± 912 | 622 | 895 ± 347 | 0.361 |
| Lumbar spine BMD, g/cm2 | 377 | 1.1 ± 0.2 | 379 | 1.1 ± 0.2 | 0.553 |
| Femoral neck BMD, g/cm2 | 379 | 0.8 ± 0.1 | 385 | 0.8 ± 0.1 | 0.328 |
| Whole-body BMD, g/cm2 | 616 | 1.1 ± 0.1 | 621 | 1.1 ± 0.1 | 0.963 |
| Osteoporosis (yes), n (%) | 377 | 27 (7.2) | 380 | 37 (9.7) | 0.370 |
| fPYD (creatinine adjusted), nmol/mmol | 612 | 24.0 ± 7.3 | 620 | 24.3 ± 7.5 | 0.489 |
| fDPD (creatinine adjusted), nmol/mmol | 612 | 6.1 ± 1.9 | 619 | 6.2 ± 2.0 | 0.636 |
| fDPD (creatinine adjusted) to fPYD (creatinine adjusted) ratio | 612 | 0.3 ± 0.1 | 619 | 0.3 ± 0.1 | 0.180 |
| PTH, pg/mL | 483 | 44.3 ± 26.5 | 479 | 42.4 ± 23.6 | 0.223 |
| 25(OH)D, ng/mL | 613 | 24.6 ± 9.1 | 619 | 24.8 ± 8.9 | 0.745 |
1Values are means ± SD unless otherwise indicated. P values for between-group differences were assessed using independent sample t-tests or χ2 tests for categorical data. BMD, bone mineral density; fDPD, free deoxypyridinoline; fPYD, free pyridinoline; NU-AGE, New Dietary Strategies Addressing the Specific Needs of the Elderly Population for Healthy Aging in Europe; PTH, parathyroid hormone; 25(OH)D, 25-hydroxyvitamin D.
After the 1-y dietary intervention, there was no effect on BMD at any bone site (Table 2) or on the concentrations of urinary fDPD and fPYD or the fDPD to fPYD ratio (Table 3). There was a significant (P < 0.001) time × treatment interaction in change in serum 25(OH)D over the 12 mo (Table 3), where the mean concentration significantly increased in the intervention group (4.5 ng/mL; 95% CI: 3.9, 5.1 ng/mL) but was unchanged in the control group (0.5 ng/mL; 95% CI: −0.1, 1.0 ng/mL) (P < 0.01). There was a significant (P < 0.001) time × treatment interaction in change in serum PTH over the 12 mo, where the mean concentration increased in the control group (3.9 pg/mL: 95% CI: 2.1, 5.6 pg/mL) but there was no significant change in the intervention group (−1.4 pg/mL: 95% CI: −3.1, 0.4 pg/mL) (P < 0.001) (Table 3). There was no effect of study center for serum 25(OH)D (P = 0.049) or serum PTH (P = 0.755). Including outliers in the data set did not markedly alter the results (data not shown).
TABLE 2.
Mean difference in BMD after 1 y of follow-up in the intervention and control diet groups1
| Intervention | Control | P | |
|---|---|---|---|
| All participants | |||
| Lumbar spine BMD, g/cm2 | |||
| n | 338 | 325 | |
| Baseline | 1.060 (1.042, 1.078) | 1.045 (1.026, 1.063) | |
| 1 y | 1.065 (1.047, 1.084) | 1.049 (1.030, 1.067) | |
| Change | 0.005 (0.002, 0.009) | 0.004 (0.000, 0.007) | 1.000 |
| Femoral neck BMD, g/cm2 | |||
| n | 342 | 326 | |
| Baseline | 0.820 (0.807, 0.833) | 0.809 (0.796, 0.822) | |
| 1 y | 0.816 (0.804, 0.829) | 0.804 (0.791, 0.817) | |
| Change | −0.004 (−0.006, −0.001) | −0.005 (−0.008, −0.002) | 1.000 |
| Whole-body BMD, g/cm2 | |||
| n | 551 | 557 | |
| Baseline | 1.099 (1.090, 1.107) | 1.092 (1.084, 1.101) | |
| 1 y | 1.098 (1.089, 1.106) | 1.091 (1.082, 1.099) | |
| Change | −0.001 (−0.003, 0.000) | −0.002 (−0.003, 0.000) | 1.000 |
| Osteoporosis subgroup2 | |||
| Lumbar spine BMD, g/cm2 | |||
| n | 25 | 33 | |
| Baseline | 0.770 (0.743, 0.797) | 0.768 (0.745, 0.791) | |
| 1 y | 0.782 (0.755, 0.810) | 0.779 (0.755, 0.802) | |
| Change | 0.012 (0.001, 0.024) | 0.011 (0.001, 0.021) | 1.000 |
| Femoral neck BMD, g/cm2 | |||
| n | 24 | 30 | |
| Baseline | 0.649 (0.624, 0.673) | 0.635 (0.614, 0.656) | |
| 1 y | 0.657 (0.633, 0.681) | 0.625 (0.605, 0.646) | |
| Change | 0.008 (−0.001, 0.018) | −0.009 (−0.018, −0.001) | 0.040 |
| Whole-body BMD, g/cm2 | |||
| n | 20 | 22 | |
| Baseline | 0.883 (0.867, 0.899) | 0.856 (0.841, 0.870) | |
| 1 y | 0.885 (0.869, 0.901) | 0.860 (0.846, 0.875) | |
| Change | 0.002 (−0.004, 0.008) | 0.005 (−0.001, 0.011) | 1.000 |
1Values are means (95% CIs) adjusted for study center, age, sex, calcium intakes, use of vitamin D supplements, 25(OH)D concentrations, and BMI (all measured at baseline). Participants were excluded from the analysis if outcome values were <3 or >3 SDs from the mean. P values were Bonferroni-corrected for the time × treatment interaction calculated from linear mixed-effects models. BMD, bone mineral density; 25(OH)D, 25-hydroxyvitamin D.
2Osteoporosis was defined as a femoral neck BMD T-score ≤−2.5 SDs.
TABLE 3.
Mean difference in bone biomarkers after 1 y of follow-up in the intervention and control diet groups1
| Intervention | Control | P | |
|---|---|---|---|
| All participants | |||
| fPYD, nmol/mmol | |||
| n | 551 | 563 | |
| Baseline | 23.1 (22.6, 23.7) | 23.6 (23.0, 24.1) | |
| 1 y | 23.6 (23.1, 24.2) | 23.6 (23.1, 24.2) | |
| Change | 0.5 (0.0, 1.0) | 0.1 (−0.4, 0.6) | 1.000 |
| fDPD, nmol/mmol | |||
| n | 551 | 560 | |
| Baseline | 5.88 (5.74, 6.01) | 6.02 (5.88, 6.15) | |
| 1 y | 5.99 (5.85, 6.12) | 5.93 (5.80, 6.07) | |
| Change | 0.1 (0.0, 0.2) | −0.1 (−0.2, 0.0) | 0.208 |
| Free fDPD to fPYD ratio | |||
| n | 554 | 563 | |
| Baseline | 0.26 (0.25, 0.26) | 0.25 (0.25, 0.26) | |
| 1 y | 0.25 (0.25, 0.26) | 0.25 (0.25, 0.26) | |
| Change | 0.00 (−0.01, 0.00) | 0.00 (−0.01, 0.00) | 1.000 |
| PTH, pg/mL | |||
| n | 468 | 467 | |
| Baseline | 40.7 (38.7, 42.8) | 38.5 (36.5, 40.5) | |
| 1 y | 39.4 (37.3, 41.4) | 42.4 (40.2, 44.5) | |
| Change | −1.4 (−3.1, 0.4) | 3.9 (2.1, 5.6) | <0.001 |
| 25(OH)D, ng/mL | |||
| n | 548 | 562 | |
| Baseline | 24.6 (24.0, 25.3) | 24.1 (23.5, 24.8) | |
| 1 y | 29.1 (28.4, 29.8) | 24.6 (24.0, 25.2) | |
| Change | 4.5 (3.9, 5.1) | 0.5 (−0.1, 1.0) | <0.001 |
| Osteoporosis subgroup2 | |||
| fPYD, nmol/mmol | |||
| n | 24 | 30 | |
| Baseline | 24.0 (21.7, 26.4) | 23.9 (21.8, 26.0) | |
| 1 y | 25.6 (23.2, 28.0) | 24.9 (22.8, 27.0) | |
| Change | 1.6 (−0.6, 3.8) | 1.0 (−1.1, 3.1) | 1.000 |
| fDPD, nmol/mmol | |||
| n | 24 | 30 | |
| Baseline | 6.69 (5.96, 7.43) | 6.30 (5.66, 6.94) | |
| 1 y | 6.44 (5.72, 7.16) | 6.76 (6.10, 7.43) | |
| Change | −0.3 (−0.9, 0.4) | 0.5 (−0.2, 1.1) | 1.000 |
| fDPD to fPYD ratio | |||
| n | 24 | 30 | |
| Baseline | 0.28 (0.25, 0.30) | 0.26 (0.24, 0.28) | |
| 1 y | 0.26 (0.23, 0.28) | 0.27 (0.25, 0.29) | |
| Change | −0.02 (−0.05, 0.00) | 0.01 (−0.01, 0.03) | 0.192 |
| PTH, pg/mL | |||
| n | 19 | 24 | |
| Baseline | 44.4 (33.9, 54.9) | 43.0 (34.0, 52.0) | |
| 1 y | 44.4 (34.2, 54.5) | 49.0 (39.4, 58.5) | |
| Change | 0.0 (−11.0, 11.0) | 6.0 (−2.4, 14.4) | 1.000 |
| 25(OH)D, ng/mL | |||
| n | 23 | 29 | |
| Baseline | 23.9 (20.9, 27.0) | 24.3 (21.6, 27.1) | |
| 1 y | 29.2 (25.8, 40.2) | 28.1 (25.2, 31.1) | |
| Change | 5.2 (1.7, 8.8) | 3.8 (0.7, 6.9) | 1.000 |
1Values are means (95% CIs) adjusted for study center, age, sex, calcium intakes, use of vitamin D supplements, 25(OH)D concentrations, and BMI (all measured at baseline). Participants were excluded from the analysis if outcome values were <3 or >3 SDs from the mean. P values were Bonferroni-corrected for the time × treatment interaction calculated from linear mixed-effects models. BMD, bone mineral density; fDPD, free deoxypyridinoline; fPYD, free pyridinoline; PTH, parathyroid hormone; 25(OH)D, 25-hydroxyvitamin D.
2Osteoporosis was defined as a femoral neck BMD T-score ≤−2.5 SDs.
When examining the subgroup of participants diagnosed with osteoporosis at baseline (n = 54), there was a 0.9% difference between the groups in the change in femoral neck BMD (Table 2); BMD increased in the intervention group (0.008 g/cm2; 95% CI: −0.001, 0.018 g/cm2) and decreased in the control group (−0.009 g/cm2; 95% CI: −0.018, −0.001 g/cm2) (P = 0.04). No effect of study center was observed (P = 0.415). The intervention had no effect on BMD measured at the lumbar spine or the whole body.
We observed no change in compliance to the diet measured at baseline and follow-up in the control group (1.9 points; 95% CI: −0.4, 4.2 points) but an increase of 23.3 points (95% CI: 21.0, 25.6 points) in the intervention group (P < 0.001) (data not shown). With regard to changes in specific dietary components associated with bone health, we observed a significant increase in intakes of olive oil, low-fat dairy, and calcium in the intervention group relative to controls (Figure 1).
FIGURE 1.
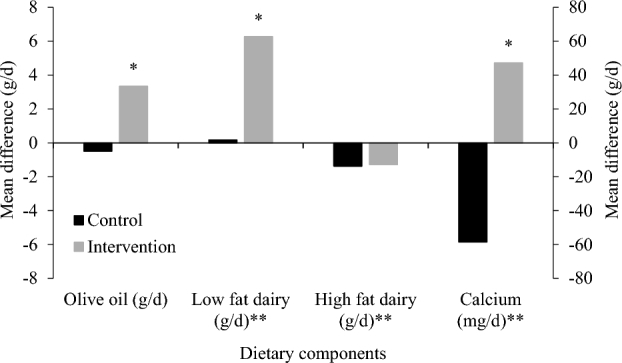
Mean difference in intake of dietary components associated with bone health after 1 y of follow-up in the intervention and control diet groups assessed by using 7-d food diaries. *P < 0.05, ANCOVA adjusted for site; **plotted on a secondary axis.
DISCUSSION
In one of the first long-term intervention studies examining the effect of the MD on BMD, we found that consumption of an MD with 10 µg vitamin D3/d reduced the rate of femoral neck bone loss, but not total body or spinal BMD loss, in elderly people with osteoporosis. There were no beneficial changes in BMD in individuals with BMD in the normal range at baseline. Recruitment was undertaken on a rolling basis, but because the study had a duration of exactly 1 y, the baseline and final measures could be directly compared without having to take into account seasonal effects on vitamin D status or other measurements.
There is conflicting evidence from cross-sectional studies examining the association between the MD and BMD, and a lack of consistency with regard to the BMD sites that are most affected. In Chinese adults aged 40–75 y, higher scores for adherence to an MD, adapted for China, were positively and dose-dependently associated with higher BMDs at the whole body, lumbar spine, total hip, femur neck, trochanter, and intertrochanter, but not the Ward's triangle area (2.41–3.96% higher; quintile 5 compared with quintile 1; all P < 0.001), after adjustment for age and sex (16). Higher intakes of whole grains, fruit, and nuts and a lower intake of red and processed meat were independently associated with higher BMD at several bone sites, but vegetables, legumes, fish, the MUFA to PUFA ratio, and moderate alcohol consumption showed no independent associations with BMD in this study.
In Finnish women aged 65–71 y (17), the lumbar spine, femoral neck, and total BMD were not significantly different across the Baltic sea diet or MD quartiles. In addition, there were no significant associations of the Baltic sea diet and MD quartiles in the subgroup with osteoporosis. A study in 220 Greek women (mean ± SD age: 48 ± 12 y) found no link between adherence to an MD and bone mass, but when principal components analysis was used to differentiate 10 dietary patterns, a high consumption of fish and olive oil and a low intake of red meat were positively associated with lumbar spine BMD (18). A study in 200 pre- and postmenopausal Spanish women showed that a higher habitual intake of fruit, vegetables, and nuts was associated with higher total body BMD in postmenopausal women (19). A smaller study in 87 Italians aged 70.1 ± 4.9 y also showed that adherence to the MD was associated with a higher BMD (T-score assessed by calcaneal quantitative ultrasound of the midcalcaneus) with the lowest adherence observed in the 15% of subjects with osteoporosis (20).
Although it is not possible to draw conclusions about cause and effect from cross-sectional data, an association between the MD, or some components of the diet, and bone health is reported in some studies. To our knowledge, no previous dietary intervention studies in elderly people have reported the effect of the MD on BMD. Therefore the NU-AGE RCT provides an important opportunity to clarify the relation. Our multicenter trial results showed that consumption of an MD (together with vitamin D supplements) for 1 y had no effect on BMD (whole-body or site-specific) in older people without osteoporosis, and even when we included the degree of compliance to the dietary change in the statistical model this did not change the findings (Supplemental Table 2). Subgroup analysis, however, showed a significant beneficial effect of the MD plus supplemental vitamin D3 on femoral neck (but not lumbar spine or whole-body) BMD in subjects identified at baseline as having osteoporosis.
Phenolic compounds, as found in virgin olive oil, are suggested as one of the components of the MD responsible for the effect on bone; the proposed mechanism is modulation of the proliferative capacity and cell maturation of osteoblasts through increased alkaline phosphatase activity and deposition of calcium ions in the extracellular matrix (21). An RCT reported that the consumption of an MD enriched with virgin olive oil for 2 y was associated with an increase in the bone biomarkers for bone formation, serum osteocalcin, and procollagen 1 N-terminal propeptide (P1NP) concentrations in elderly men (22). This indicates that the MD increases bone formation rather than decreases resorption. In our dietary intervention, we provided virgin olive oil to the intervention group to encourage subjects to consume more olive oil. Baseline olive oil intake was highest in Italy (9.6 ± 0.4 g/d) and lowest in France (2.1 ± 0.4 g/d), and although there were no significant differences in intakes between the countries, the greatest changes in intakes were observed in France (6.0 g/d) and the lowest in Italy (1.0 ± 0.5 g/d). A reduction in sodium intake, as undertaken in the Dietary Approaches to Stop Hypertension (DASH) diet study (23), may be one of the consequences of consuming an MD (with reduced processed-meat intake and increased intakes of fruit and vegetables), and this has been reported to have beneficial effects on bone health through a reduction in urinary calcium excretion (24). However, because of the difficulties of accurately measuring sodium intake, we did not attempt to evaluate the effect of sodium intake on BMD. Similarly, for other dietary components that may affect bone turnover, such as vitamin K, we were unable to include them in our model due to the lack of reliable intake data.
Although osteoporosis is a widely accepted risk factor for bone fracture, the evidence for a protective effect of the MD on the risk of fracture is conflicting. Post hoc analysis of longitudinal data (median follow-up of 15.9 y) from the US Women's Health Initiative reported a lower risk of hip (but not total) fractures with higher adherence to a Mediterranean diet in women aged 50–79 y (7). Conversely, a smaller population-based study of shorter duration (8 y) in France found that greater adherence to the MD was not associated with a decreased risk of fractures in men and women aged 67 y on recruitment (25). In a prospective study in European men and women [European Prospective Investigation into Cancer and Nutrition (EPIC)] with a mean age of 48.6 y, followed for a median of 9 y, increased adherence to an MD protected against hip fracture occurrence, particularly among men (26). In the Prevención con Dieta Mediterránea (PREDIMED) trial, an observational cohort study nested in the main trial found that a higher consumption of extra-virgin olive oil was associated with a lower risk of osteoporosis-related fractures in Mediterranean men and women, aged 55–80 y, at high cardiovascular risk (21). As with the cross-sectional studies cited above, the effect of the MD appears to be mediated through particular dietary components, such as virgin olive oil.
In our study, subjects in the intervention group were given vitamin D3 supplements (10 µg/d), and this resulted in a highly significant increase in serum total 25(OH)D (P < 0.001) and a highly significant reduction in PTH concentrations (P < 0.001) in the whole intervention group (but not in the osteoporosis subgroup) compared with the control group (Table 3). This may be a question of insufficient power because the osteoporotic subgroup was small. In this combined intervention design it is not possible to disentangle the relative influence of the MD and/or vitamin D on femoral neck BMD in osteoporotic subjects. However, it is likely that the daily dose of vitamin D3 (10 µg) was too low to have a significant impact on bone loss. MacDonald et al. (27) found that hip bone loss was attenuated when vitamin D 3 supplements of 1000 IU (25 µg) were given daily for 1 y to postmenopausal women, but 400 IU (10 µg) had no effect. A systematic review of vitamin D supplementation and risk of fractures concluded that vitamin D supplements of 700–800 IU (17.5–20 µg)/d appeared to reduce the risk of hip and any nonvertebral fractures in ambulatory or institutionalized elderly persons, but that a vitamin D dose of 400 IU (10 µg)/d was not sufficient for fracture prevention (28). It is also worth noting that the baseline serum 25(OH)D of the participants in this RCT, at ∼25 ng/mL, exceeded that suggested by the Institute of Medicine (i.e., 20 ng/mL) to cover the needs of nearly all individuals from a bone health perspective (29). The Endocrine Society, however, has suggested that to maximize the effect of vitamin D on calcium, bone, and muscle metabolism, circulating 25(OH)D should be >30 ng/mL (30). This latter threshold was only achieved in just under half of the intervention group in the present RCT [mean serum 25(OH)D at endpoint: 29 ng/mL].
The strength of this study is that it was a long-term (1-y) RCT carried out in a relatively large number (>1000) of European men and women and designed to examine the effects of a Mediterranean-like diet on various health variables, including bone health. We acknowledge that we were not able to match the control group on all aspects of the study, in particular with regard to contact time with research staff; this did not affect recruitment or attrition, which was the same in both groups, but may have increased type 1 error. Our use of T-scores for categorizing osteoporosis in both males and females with the use of female normative databases may have led to underestimation of osteoporosis in our male participants. A further limitation is the relatively small size of the subgroup with osteoporosis. The significant and interesting finding of differences in response between individuals with BMD in the normal range and those with osteoporosis needs to be verified in a future study.
In conclusion, our 1-y intervention showed that, in elderly individuals (aged 65–79 y), a Mediterranean-like diet together with vitamin D3 supplements (10 µg/d) had no effect on BMD in the normal age-related range. However, it significantly reduced the rate of loss of bone at the femoral neck in individuals with osteoporosis.
Supplementary Material
Acknowledgements
The authors’ responsibilities were as follows—SJF-T, AJ, AC and CF: conceived of the study; AAMB and LCPGMdG: designed the dietary intervention; AJ, RG, AAMB, BP, EW, RO, EC, NM, CM-B and AS: carried out the intervention study and were responsible for data collection; JT, WF, KGD, GLJH, and KDC: were responsible for the biochemical analysis; AJ, RG, AB, and GB: were responsible for imaging, DXA assessment, and analysis; AS: coordinated the NU-AGE data collection across centers; AJ: was responsible for data analysis; SJF-T and AJ: wrote the first draft of the manuscript; and all authors: were accountable for all aspects of the work in ensuring that questions related to the accuracy or integrity of any part of the work were appropriately investigated and resolved, critically revised the manuscript for important intellectual content, and read and approved the final manuscript. None of the authors reported any conflicts of interest related to the study.
Notes
Supported by the European Union's Seventh Framework Program under grant agreement 266486 [NU-AGE (“New Dietary Strategies Addressing the Specific Needs of the Elderly Population for Healthy Aging in Europe”)].
Supplemental Tables 1 and 2 and Supplemental Figure 1 are available from the “Supplementary data” link in the online posting of the article and from the same link in the online table of contents at https://academic.oup.com/ajcn/.
Abbreviations used:
- BMD
bone mineral density
- DXA
dual-energy X-ray absorptiometry
- fDPD
free deoxypyridinoline
- fPYD
free pyridinoline
- LC-MS/MS
liquid chromatography–tandem mass spectrometry
- MD
Mediterranean diet
- NU-AGE
New Dietary Strategies Addressing the Specific Needs of the Elderly Population for Healthy Aging in Europe
- PTH
parathyroid hormone
- RCT
randomized controlled trial
- 25(OH)D
25-hydroxyvitamin D
- 25-hydroxyvitamin D3
25(OH)D3
REFERENCES
- 1. Willett WC, Sacks F, Tricholpoulou A, Drescher G, Ferro-Luzzi A, Helsing E, Tricholpoulos D. Mediterranean diet pyramid: a cultural model for healthy eating. Am J Clin Nutr 1995;61:1402–6. [DOI] [PubMed] [Google Scholar]
- 2. Trichopoulou A, Costacou T, Barnia C, Trichopoulos D. Adherence to a Mediterranean diet and survival in a Greek population. New Engl J Med 2003;348:2599–608. [DOI] [PubMed] [Google Scholar]
- 3. Sofi F, Cesari F, Abbate R, Gensini GF, Casini A. Adherence to Mediterranean diet and health status: meta-analysis. BMJ 2008;337:a1344. [DOI] [PMC free article] [PubMed] [Google Scholar]
- 4. Liyanage T, Ninomiya T, Wang A, Neal B, Jun M, Wong MG, Jardine M, Hillis GS, Perkvic V. Effects of the Mediterranean diet on cardiovascular outcomes—a systematic review and meta-analysis. PloS One 2016;11(8):e0159252. [DOI] [PMC free article] [PubMed] [Google Scholar]
- 5. Perez AR, Velasco AR. Adherence to Mediterranean diet and bone health. Nutr Hosp 2014;29:989–96. [DOI] [PubMed] [Google Scholar]
- 6. Cauley JA. Osteoporosis: fracture epidemiology update 2016. Curr Opin Rheumatol 2017;29:150–6. [DOI] [PubMed] [Google Scholar]
- 7. Haring B, Crandall CJ, Wu C, LeBlanc ES, Shikany JM, Carbone L, Orchard T, Thomas F, Wactawski-Wende J, Li W et al.. Dietary patterns and fractures in postmenopausal women. Results from the Women's Health Initiative. JAMA Intern Med 2016;176:645–52. [DOI] [PMC free article] [PubMed] [Google Scholar]
- 8. Santoro A, Pini E, Scurti M, Palmas G, Berendsen A, Brzozowska A, Pietruszka B, Szczecinska A, Cano N, Meunier N et al.. Combating inflammaging through a Mediterranean whole diet approach: the NU-AGE project's conceptual framework and design. Mech Ageing Dev 2014;136–137:3–13. [DOI] [PubMed] [Google Scholar]
- 9. Berendsen A, Santoro A, Pini E, Cevenini E, Ostan R, Pietruszka B, Rolf K, Cano N, Caille A, Lyon-Belgy N et al.. A parallel randomized trial on the effect of a healthful diet on inflammageing and its consequences in European elderly people: design of the NU-AGE dietary intervention study. Mech Ageing Dev 2014;136–137:14–21. [DOI] [PubMed] [Google Scholar]
- 10. Fried LP, Tangen CM, Walston J, Newman AB, Hirsch C, Gottdiener J, Seeman T, Tracy R, Kop WJ, Burke G et al.. Frailty in older adults: evidence for a phenotype. J Gerontol A Biol Sci Med Sci 2001;56:M146–56. [DOI] [PubMed] [Google Scholar]
- 11. Kanis JA, Melton LJ III, Christiansen C, Johnston CC, Khaltaev N. The diagnosis of osteoporosis. J Bone Miner Res 1994;9:1137–41. [DOI] [PubMed] [Google Scholar]
- 12. Tang J, Dutton J, Piec I, Green D, Fisher E, Washbourne C, Fraser WD. LC–MS/MS application for urine free pyridinoline and free deoxypyridinoline: urine markers of collagen and bone degradation. Clin Mass Spectrom 2016;1:11–8. [Google Scholar]
- 13. Cashman KD, Kiely M, Kinsella M, Durazo-Arvizu RA, Tian L, Zhang Y, Lucey A, Flynn A, Gibney MJ, Vesper HW et al.. Evaluation of vitamin D standardization program protocols for standardizing serum 25-hydroxyvitamin D data: a case study of the program's potential for national nutrition and health surveys. Am J Clin Nutr 2013;97:1235–42. [DOI] [PMC free article] [PubMed] [Google Scholar]
- 14. CDC CDC's Vitamin D Standardization Certification Program (VDSCP). [cited 2018 Feb 9]. Available from: https://www.cdc.gov/labstandards/vdscp_participants.html. [Google Scholar]
- 15. Moschonis G, Manios Y. Skeletal site-dependent response of bone mineral density and quantitative ultrasound parameters following a 12-month dietary intervention using dairy products fortified with calcium and vitamin D: the Postmenopausal Health Study. Br J Nutr 2006;96:1140–8 [DOI] [PubMed] [Google Scholar]
- 16. Chen G, Dong X, Zhu Y, Tian H, He J, Chen Y. Adherence to the Mediterranean diet is associated with a higher BMD in middle-aged and elderly Chinese. Sci Rep 2016;6:srep25662. [DOI] [PMC free article] [PubMed] [Google Scholar]
- 17. Erkkila A, Sadeghi H, Isanejad M, Mursu J, Tuppurainen M, Kroger H. Associations of Baltic Sea and Mediterranean dietary patterns with bone mineral density in elderly women. Pub Health Nutr 2017;20:2735–43. [DOI] [PMC free article] [PubMed] [Google Scholar]
- 18. Kontogianni MD, Melistas L, Yannakoulia M, Malagris I, Panagiotakos DB, Yiannakouris N. Association between dietary patterns and indices of bone mass in a sample of Mediterranean women. Nutrition 2009;25:165–71. [DOI] [PubMed] [Google Scholar]
- 19. Rivas A, Romero A, Mariscal-Arcas M, Monteagudo C, Feriche B, Lorenzo ML, Olea F. Mediterranean diet and bone mineral density in two age groups of women. Int J Food Sci Nutr 2013;64:155–61. [DOI] [PubMed] [Google Scholar]
- 20. Vuolo L, Barrea L, Savanelli MC, Savastano S, Rubino M, Scarano E, Soprano M, Illario M, Colao A, Di Somma C. Nutrition and osteoporosis: preliminary data of Campania region of European PERsonalised ICT Supported Service for Independent Living and Active Ageing. Trans Med 2016;13:13–18. [PMC free article] [PubMed] [Google Scholar]
- 21. Garcia-Gavilan JF, Bullo M, Canudas S, Martinez-Gonzales MA, Estruch R, Giardina S, Firo M, Corella D, Ros E, Salas-Salvado J. Extra virgin olive oil consumption reduces the risk of osteoporotic fractures in the PREDIMED trial. Clin Nutr. 2018;37(1):329–35. [DOI] [PubMed] [Google Scholar]
- 22. Fernandez-Real JM, Bullo M, Moreno-Navarrete JM, Ricart W, Ros E, Estruch R, Salas-Salvado J. A Mediterranean diet enriched with olive oil is associated with higher serum total osteocalcin levels in elderly men at high cardiovascular risk. J Clin Endocrinol Metab 2012;97:3792–8. [DOI] [PMC free article] [PubMed] [Google Scholar]
- 23. Lin PH, Ginty F, Appel LJ, Aickin M, Bohannon A, Garnero P, Barclay D, Svetkey LP. The DASH diet and sodium reduction improve markers of bone turnover and calcium metabolism in adults. J Nutr 2003;133(10):3130–6. [DOI] [PubMed] [Google Scholar]
- 24. Doyle L, Cashman KD. The DASH diet may have beneficial effects on bone health. Nutr Rev 2004;62(5):215–20. [DOI] [PubMed] [Google Scholar]
- 25. Feart C, Lorrain S, Coupez VG, Samieri C, Letenneur L, Paineau D, Barberger-Gateau P. Adherence to a Mediterranean diet and risk of fractures in French older persons. Osteoporos Int 2013;24(12):3031–41. [DOI] [PubMed] [Google Scholar]
- 26. Benetou V, Orfanos P, Pettersson-Kymmer U, Bergstrom U, Svensson O, Johansson I, Berrino F, Tumino R, Borch KB, Lund E et al.. Mediterranean diet and incidence of hip fractures in a European cohort. Osteoporosis Int 2013;24:1587–98. [DOI] [PubMed] [Google Scholar]
- 27. MacDonald HM, Wood AD, Aucott LS, Black AJ, Fraser WD, Mavroeidi A, Reid DM, Secombes KR, Simpson WG, Thies F. Hip bone loss is attenuated with 1000 IU but not 400 IU daily vitamin D3: a 1-year double-blind RCT in postmenopausal women. J Bone Miner Res 2013;28:2202–13. [DOI] [PubMed] [Google Scholar]
- 28. Bischoff‐Ferrari HA, Willett WC, Wong JB, Giovannucci E, Dietrich T, Dawson‐Hughes B. Fracture prevention with vitamin D supplementation: a meta‐analysis of randomized controlled trials. JAMA 2005;293:2257–64. [DOI] [PubMed] [Google Scholar]
- 29. Institute of Medicine Food and Nutrition Board Dietary Reference Intakes for calcium and vitamin D. Washington (DC): National Academies Press; 2011. [PubMed] [Google Scholar]
- 30. Holick MF, Binkley NC, Bischoff-Ferrari HA, Gordon CM, Hanley DA, Heaney RP, Murad MH, Weaver CM; Endocrine Society Evaluation, treatment, and prevention of vitamin D deficiency: an Endocrine Society clinical practice guideline. J Clin Endocrinol Metab 2011;96:1911–30. [DOI] [PubMed] [Google Scholar]
Associated Data
This section collects any data citations, data availability statements, or supplementary materials included in this article.