

Abstract
Background:
Current laboratory risk management principles emphasize the importance of assessing laboratory quality control (QC) practices in terms of the risk of patient harm. Limited practical guidance or examples on how to do this are available.
Methods:
The patient risk model described in a published laboratory risk management guideline was combined with a recently reported approach to computing the predicted probability of patient harm to produce a risk management index (RMI) that compares the predicted probability of patient harm for a QC strategy to the acceptable probability of patient harm based on the expected severity of harm caused by an erroneously reported patient result.
Results:
Measurement procedure capability and quality control performance for two instruments measuring HbA1c in a laboratory were assessed by computing the RMI for each instrument individually and for the laboratory as a whole.
Conclusions:
This assessment provides a concrete example of how laboratory QC practices can be directly correlated to the risk of patient harm from erroneously reported patient results.
Keywords: patient risk, performance assessment, quality control, risk management
One of the main goals of laboratory medicine is to improve patient health by providing laboratory results that support medical decisions. To meet this goal the laboratory must report accurate results that enhance care while minimizing patient risk. Recent trends in clinical laboratory quality control (QC) theory have emphasized the importance of more directly assessing the ability of laboratory QC practices to minimize the risk of patient harm from the reporting of erroneous patient results. Published guidelines such as the Clinical and Laboratory Standards Institute’s CLSI EP23-A, “Laboratory Quality Control Based on Risk Management; Approved Guideline” and CLSI C24, 4th edition “Statistical Quality Control for Quantitative Measurement Procedures: Principles and Definitions” have reflected this trend.1-3
The model of the sequence of events creating risk of harm for a patient discussed in CLSI EP23-A takes into consideration
the reliability of the measurement procedure (likelihood of an initiating cause of an out-of-control condition)
the effectiveness of laboratory quality control to minimize the number of erroneous patient results that are reported and acted on
the likelihood that erroneous reported patient results lead to inappropriate medical decisions or actions that cause patient harm
the severity of patient harm resulting from the inappropriate decision or action
Both CLSI EP23-A and ISO 149714 suggest classifying severity of patient harm into one of five categories; negligible, minor, serious, critical, and catastrophic. Risk management principles require that the more severe the patient harm the lower the probability of harm must be to maintain acceptable patient risk.
The purpose of this report is to demonstrate use of the patient risk model to assess the QC strategy and measurement procedure capabilities for HbA1c measurements in a clinical laboratory. The approach computed a predicted probability of patient harm from an erroneous reported HbA1c result over a wide range of possible out-of-control conditions and compared it to the acceptable probability of patient harm based on the assessed severity of harm from an inappropriate decision or action. This approach has recently been described where a risk management index (RMI) was defined as the ratio of the predicted probability of patient harm to the acceptable probability of patient harm.5 If the predicted probability of patient harm is less than or equal to the acceptable probability of patient harm (RMI ≤ 1) for the patient population served by the laboratory then the conclusion is that the laboratory’s QC practices are appropriately minimizing patient risk.
Methods
HbA1c was measured in the Central Clinical Laboratory using two Bio-Rad VARIANT™ II TURBO HPLC instruments. Both instruments were in operation 24 hours a day, 7 days a week during the time period of data collection with the exception of times when routine maintenance was being performed or instrument troubleshooting occurred. Patient testing volume was roughly equally distributed between instruments. Patient HbA1c results reported from both instruments during the month of June were obtained (3257 results from instrument 1 and 2750 results from instrument 2).
The laboratory’s QC strategy for HbA1c testing was to measure two levels of QC material (Bio-Rad Liquichek Diabetes Control, levels 1 and 2) at 6 am, 9 am, 12 pm, 3 pm, 6 pm, and 12 am. Three months of “real-life” QC data (April-June 2017) were used to calculate QC means and SDs for each level on each instrument. The combined QC data from both instruments were used to assign QC target values that were subsequently used to estimate instrument bias. QC rule means were established from QC measurements occurring over at least 20 days during the evaluation phase of the lot of QC material. QC rule SDs were based on historic analytical performance. Bio-Rad Unity was used to capture QC measurements in real-time and apply statistical rules.
The allowable total error (TEa) specified for HbA1c results was patient measurement error <6% of the HbA1c value for HbA1c results above 5.0% and <0.3 units for HbA1c results below 5.0%. In the patient risk model of CLSI EP23-A, if the measurement error in a patient’s HbA1c result exceeds TEa the result is considered erroneous and creates a hazardous situation for the patient. Whether or not the hazardous situation leads to patient harm depends on the likelihood that the erroneous result leads to an inappropriate medical decision or action.
The likelihood that erroneous results lead to inappropriate medical decisions or actions and the severity of patient harm associated with an inappropriate decision or action were assigned for different HbA1c value ranges and then overall values were derived by computing weighted averages with the weighting coefficients reflecting the fraction of patient results falling within each value range. Acceptable probabilities of patient harm given the severity of harm classifications were derived using the CLSI EP23-A example risk acceptability matrix and probability of harm categories.1
The mean time between analytical failures that produce out-of-control conditions (ie, corrective action and revision of patient reports) was calculated from instrument performance history between 6/2016 and 9/2017. The laboratory’s criteria for revision of patient results were >0.3 unit or >5% difference. If the difference between the result obtained during the out-of-control condition (reported value) and that obtained upon remeasurement of patient specimens under in-control conditions exceeded these criteria, patient reports were revised to the result obtained under in-control conditions. The mean number of patient results between failures (MPBF) was determined by combining the estimated mean time between failures and the average number of patient results reported per day.
The predicted probability of patient harm given the instrument’s measurement capability and reliability, the laboratory’s QC strategy, and the magnitude of a systematic error out-of-control condition was computed from this formula:5
In this formula;
PE(0) is the probability of the measurement procedure producing erroneous results due to measurement procedure bias when the process is operating in its stable in-control state
E(Nuf(SE)) stands for the expected number of unacceptable final results and is the increase in the expected number of erroneous results reported due to an out-of-control systematic error condition of magnitude SE before the laboratory’s QC procedure detects the out-of-control condition
MPBF is the mean number of HbA1c patient results reported between instrument failures
ANPed(SE) stands for the average number of patient results to error detection and is the average number of HbA1c patient results reported during the existence of an out-of-control systematic error condition of magnitude SE before the laboratory’s QC procedure detects the out-of-control condition
Ph|u stands for the probability of harm given an unacceptable result and is the probability that an erroneous reported HbA1c result will lead to an inappropriate medical decision or action that leads to patient harm
Computation of PE(0), ENuf(SE), and ANPed(SE) has been described elsewhere.6 The computations are numerically intensive and require computer algorithms for the calculations.
Results
Table 1 lists characteristics of the HbA1c instruments and QC approach in the laboratory. The two instruments performed about the same volume of HbA1c testing in the three month period analyzed. Instrument 1 had a slight positive bias compared to the QC target values (mean values of 5.20% and 9.98%) and instrument 2 had a slight negative bias. Instrument 1 had lower imprecision than instrument 2 at the low level QC (0.10 versus 0.13), but a slightly higher imprecision at the high level QC (0.17 versus 0.16). The laboratory tested QC 6 times per day on each instrument and applied a repeat 1:2s QC rule in which QC measurement is repeated if the QC value obtained exceeds 2 SD from the mean. It is considered an out-of-control condition if the repeat QC measurement value exceeds 2 SD from the mean.7 If the QC value is within 2 SD of the QC mean upon repeat measurement, no action is taken. The same QC rule target means (5.16% and 9.90%) and SDs (0.11 and 0.16) were used in the repeat 1:2s QC rule for both instruments. The mean time between occurrences of out-of-control conditions was approximately 2 months for instrument 1 and 5 months for instrument 2.
Table 1.
HbA1c Instrument and Quality Control Characteristics.
| Characteristic | Instrument 1 | Instrument 2 |
|---|---|---|
| Average number of HbA1c results reported per day | 100 | 90 |
| QC target values (%) (level 1, level 2) | 5.17, 9.91 | 5.17, 9.91 |
| QC mean (%) (level 1, level 2) | 5.20, 9.98 | 5.15, 9.84 |
| QC SD (level 1, level 2) | 0.10, 0.17 | 0.13, 0.16 |
| Scheduled QC events per daya | 6 | 6 |
| Average number of HbA1c measurements between QC events | 17 | 15 |
| QC rule applied | Repeat 1:2s | Repeat 1:2s |
| QC rule mean (%) (level 1, level 2) | 5.16, 9.90 | 5.16, 9.90 |
| QC rule SD (level 1, level 2) | 0.11, 0.16 | 0.11, 0.16 |
Data were collected over a 3-month period (April-June).
Two levels of QC were measured at 6 am, 9 am, 12 pm, 3 pm, 6 pm, and 12 am when instrument was operational.
Figure 1 shows the frequency distribution of HbA1c measurements reported by the laboratory over one month. HbA1c results below 5.7% (shaded green) are considered normal, results between 5.7% and 6.4% (shaded yellow) indicate an increased risk for developing diabetes, and values greater than or equal to 6.5% (shaded blue) are considered diagnostic for diabetes.8
Figure 1.

Patient frequency distribution of HbA1c results for the laboratory. The green shaded region (HbA1c < 5.7), yellow shaded region (5.7-6.4), and blue shaded region (HbA1c ≥ 6.5) represent normal results, results indicating an increased risk for developing diabetes, and results diagnostic for diabetes mellitus, respectively.
Table 2 lists information about the fraction of patient results that fell within different HbA1c ranges, and the laboratory’s assessment of the probability of an inappropriate decision or action based on an erroneous reported HbA1c result (Ph|u), along with the assessed severity of patient harm classification. According to ISO 14971, the maximum acceptable probability of harm if the severity of harm is classified as negligible is 0.001. If the severity of harm is classified as minor or serious the maximum acceptable probability of harm is 0.0001. The probability of inappropriate decisions or actions was estimated for relevant ranges of HbA1c results assuming the minimum error required for an erroneous result occurred during an out-of-control condition (0.3 units or 6%).
Table 2.
Assessed Likelihood of Inappropriate Medical Decisions or Actions and Severity of Patient Harm for Different HbA1c Result Ranges.
| HbA1c range | % of patient population | Ph|u | Severity of harm |
|---|---|---|---|
| <5.4 | 21.0 | 0.001 | Negligible |
| 5.4-5.6 | 13.6 | 0.50 | Negligible |
| 5.7-5.9 | 11.0 | 0.50 | Minor |
| 6.0-6.1 | 5.4 | 0.01 | Negligible |
| 6.2-6.4 | 6.8 | 0.50 | Minor |
| 6.5-6.8 | 7.7 | 0.50 | Serious |
| >6.8 | 34.5 | 0.75 | Serious |
Ph|u is the assessed probability an erroneously reported HbA1c result will lead to inappropriate medical decisions or actions that cause patient harm.
For erroneous results reported on patients with HbA1c values below 5.4 it was deemed highly unlikely that an inappropriate medical decision or action would occur (Ph|u = 0.001), and if an inappropriate medical or action did occur the severity of harm to the patient would be classified as negligible.
For HbA1c values in the range 5.4-5.6% inappropriate medical decisions or actions would occur for positive erroneous results that cause the HbA1c values to fall in the 5.7-6.4% “prediabetic” range. Negative erroneous results should cause no inappropriate medical decisions or actions. Assuming that out-of-control conditions are equally likely to be positive or negative means that inappropriate medical decisions or actions in this range would occur only half of the time (Ph|u = 0.50). As the inappropriate action would likely be a recommendation that the patient discuss the result with a health care provider and implement healthy lifestyle changes, the severity of harm is considered negligible. Similar reasoning was applied to HbA1c levels in the range 5.7-5.9% where a positive out-of-control condition would have little impact because erroneous results would likely fall within the same classification of being at increased risk for developing diabetes. However, a negative out-of-control condition might erroneously place patients in the <5.7% range and cause a misclassification of normal HbA1c in a patient with possible increased risk for developing diabetes which may delay healthy lifestyle interventions suggesting a minor severity of harm.
For HbA1c values in the range 6.2-6.4% positive erroneous results would be above the 6.5% threshold that is considered diagnostic for diabetes. For diabetes screening it is recommended that HbA1c values greater than or equal to 6.5% be confirmed by repeat testing so the inappropriate decision would likely be the ordering of a repeat HbA1c test or measuring fasting glucose concentration and the severity of harm for this inappropriate order was considered minor. Likewise, for HbA1c values in the range 6.5-6.8% negative erroneous results would be incorrectly below the 6.5% threshold that is considered diagnostic for diabetes. The inappropriate action would be that the recommended confirmation test would not be performed and the diagnosis of diabetes would be delayed. The severity of harm for this inappropriate action was considered serious.
It’s expected that the vast majority of HbA1c values above 6.8% are results in patients with diabetes that are being monitored or possibly newly diagnosed. In these situations erroneous HbA1c results may lead to some form of inappropriate medical intervention depending on the clinical context for each patient (Ph|u = 0.75). The severity of harm was considered serious.
Based on the values in Table 2 the overall probability of inappropriate decisions or actions was computed to be (0.21*0.001 + 0.136*0.5 + 0.11*0.5 + 0.054*0.01 + 0.068*0.5 + 0.077*0.5 + 0.345*0.75) = 0.45. The overall acceptable probability of patient harm is computed to be (0.21*0.001 + 0.136*0.001 + 0.11*0.0001 + 0.054*0.001 + 0.068*0.0001 + 0.077*0.0001 + 0.345*0.0001) = 0.00046. Using these values and the data in Table 1 the predicted probability of patient harm was computed over a wide range of magnitudes of both negative and positive out-of-control conditions for each HbA1c instrument (Figure 2).
Figure 2.
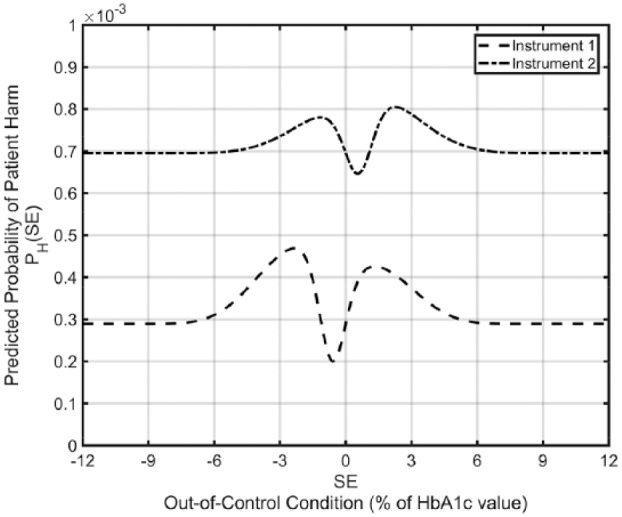
Predicted probability of patient harm as a function of the magnitude of an out-of-control condition for the laboratory’s two HbA1c instruments.
The expected predicted probability of harm is obtained for each instrument by averaging the predicted probability of harm values over the range of out-of-control conditions. For instrument 1 the expected predicted probability of harm is 0.00033. The RMI for instrument 1 is the predicted probability of harm divided by the acceptable probability of harm = 0.00033 / 0.00046 = 0.72. For instrument 2 the expected predicted probability of harm is 0.00072 and the RMI is 0.00072 / 0.00046 = 1.56. The overall RMI for the laboratory is computed by weighting the two instrument RMI values by the fraction of HbA1c results performed on each instrument; 0.72*0.53 + 1.56*0.47 = 1.11. Thus, the risk associated with instrument 1 is about 28% lower than desired, the risk associated with instrument 2 is about 56% higher than desired, and the overall patient risk for the laboratory is just slightly higher than a desirable RMI of ≤1.
Discussion
The patient risk model described in CLSI EP23-A provides the foundation for the approach used here to assess the ability of laboratory QC practices to minimize the risk of patient harm from the reporting of erroneous patient results. The primary performance metric is the risk management index, or RMI, which relates the predicted probability of patient harm to the acceptable probability of patient harm. The predicted probability of patient harm is computed based on the measurement procedure’s imprecision, bias, and reliability, the laboratory’s QC procedures, and the likelihood that erroneous reported patient results will cause patient harm. The acceptable probability of patient harm is derived from the expected severity of harm caused by an erroneous result and a risk acceptability matrix that relates severity of harm to maximum acceptable probability of harm. Given the importance of different HbA1c result ranges in the diagnosis, treatment, and monitoring of diabetes patients it seemed necessary to make the assessment of QC performance depend on the likelihood of patient results falling within different HbA1c ranges and the different patient risk implications within each range.
Figure 2 shows the computed predicted probability of patient harm for the two instruments for out-of-control conditions in the HbA1c measurement procedures ranging from a 12% downward shift in HbA1c results to a 12% upward shift. The values on each curve when the instruments are in control (SE = 0) are the predicted probabilities of harm due to the measurement bias in each instrument. The changes in the curves from their values at SE = 0 reflect the increase (or decrease) in the predicted probability of harm due to the occurrence of an out-of-control condition of the specified magnitude and depends on how quickly the laboratory’s QC can detect the out-of-control condition. For instance, if the frequency of QC evaluations were reduced, more patient results would be adversely affected by an out-of-control condition, and the magnitudes of the curves would increase.
The computations for E(Nuf(SE)) used in these analyses assume that when an out-of-control condition is detected by a QC rule violation at a scheduled QC event, any erroneous patient results that were reported back to the last accepted QC event are identified and corrected before they are acted on. The laboratory’s approach to recovering from out-of-control conditions9 combined with the relatively short time interval between QC events makes it likely that all erroneously reported HbA1c results back to the last accepted QC event are corrected before they are acted on, and it is even possible that erroneously reported results prior to the last accepted QC event are identified and corrected before acted on. This would have the effect of slightly reducing the increase in the predicted probability of patient harm for out-of-control conditions shown in the curves in Figure 2.
Note the predicted probability of patient harm curves return to the value observed at SE = 0 for large positive or negative values of SE. The explanation for this is that for very large out-of-control conditions the laboratory QC procedures detect the out-of-control condition at the first QC event after it occurs meaning that all erroneous reported patient results back to the last accepted QC event (which is prior to the occurrence of the out-of-control condition) are corrected before they are acted on. Comparing the predicted probability of harm when SE = 0 to the maximum predicted probability of harm over the range of SE values indicates to what degree the predicted probability of patient harm is due to instrument imprecision and bias versus undetected out-of-control conditions. The minimum value for each curve occurs at an out-of-control condition that effectively negates the instrument’s measurement bias. There are several ways to estimate bias. In this study, between instrument bias was considered relevant because patient samples have an equal chance of being measured by either instrument 1 or instrument 2. The “true” value was assigned as the mean of 3 months of QC data from both instruments and instrument-specific bias was then calculated. Bias could also be calculated using the laboratory’s proficiency testing results or comparison to reference methods.
A number of the parameters required for predicting the probability of patient harm and RMI such as the mean time between instrument failures, the probability that erroneous reported results lead to inappropriate medical decisions or actions, and the severity of patient harm from an inappropriate decision or action require subjective estimates. These estimates will be only approximate, may be subject to differing opinions, and changes to any of them would change the calculated predicted probability of harm and RMI values. In addition, while CLSI EP23 and ISO 14971 suggest classifying severity of harm and probability of harm into five categories, these are offered as examples. In other examples as few as 3 categories or as many as 10 categories have been suggested. Investigating the sensitivity of the calculated predicted probability of harm and RMI values to changes in estimated parameter values will provide useful insights. In any case, a major benefit of this approach to laboratory assessment is the opportunity it provides the laboratory to expand its thinking about laboratory QC performance beyond simply assessing the in-control or out-of-control state of a laboratory instrument, and to engage other laboratorians and health care providers in discussions about broader aspects of patient risk such as the probability that erroneous reported results will lead to inappropriate medical decisions or actions and the subsequent severity of patient harm from those inappropriate medical decisions or actions.
Conclusion
While recent publications such as CLSI C24, 4th edition emphasize the importance of assessing QC performance based on its impact on patient risk, little guidance has been provided on how to carry out such an assessment. This work provides an example, using two HbA1c measurement procedures in a laboratory, of one approach to a patient risk-based assessment. The example demonstrates how this approach expands the laboratory’s considerations beyond simply assessing its ability to detect out-of-control conditions in the measurement procedure to also include the reliability of the measurement procedure, the likelihood that reported erroneous HbA1c results will lead to inappropriate medical decisions or actions, and the severity of harm if inappropriate medical decisions or action occur.
Acknowledgments
NAB would like to acknowledge Roxanne Ybabez in the Central Clinical Laboratory at Mayo Clinic for her contributions to this work.
Footnotes
Abbreviations: CLSI, Clinical and Laboratory Standards Institute; ISO, International Organization for Standardization; MPBF, mean number of patients between failures; QC, quality control; RMI, risk management index; SE, systematic error; TEa, allowable total error.
Declaration of Conflicting Interests: The author(s) declared the following potential conflicts of interest with respect to the research, authorship, and/or publication of this article: CAP is a full-time employee of Bio-Rad Laboratories.
Funding: The author(s) received no financial support for the research, authorship, and/or publication of this article.
References
- 1. Clinical and Laboratory Standards Institute. Laboratory Quality Control Based on Risk Management; Approved Guideline. 1st ed. CLSI Guideline EP23-A. Wayne, PA: Clinical and Laboratory Standards Institute; 2011. [Google Scholar]
- 2. Clinical and Laboratory Standards Institute. Statistical Quality Control for Quantitative Measurement Procedures: Principles and Definitions. 4th ed. CLSI Guideline C24. Wayne, PA: Clinical and Laboratory Standards Institute; 2016. [Google Scholar]
- 3. Parvin CA. What’s new in laboratory statistical quality control guidance? The 4th edition of CLSI C24, statistical quality control for quantitative measurement procedures: principles and definitions. J App Lab Med. 2017;1:581-584. [DOI] [PubMed] [Google Scholar]
- 4. International Organization for Standardization. Medical Devices—Application of Risk Management to Medical Devices. ISO 14971. Geneva, Switzerland: International Organization for Standardization; 2007. [Google Scholar]
- 5. Yundt-Pacheco JC, Parvin CA. Computing a risk management index: correlating a quality control strategy to patient risk. Clin Chem. 2017;63:s227-s228. [Google Scholar]
- 6. Parvin CA. Assessing the impact of the frequency of quality control testing on the quality of reported patient results. Clin Chem. 2008;54:2049-2054. [DOI] [PubMed] [Google Scholar]
- 7. Parvin CA, Kuchipudi L, Yundt-Pacheco JC. Should I repeat my 1:2s QC rejection? Clin Chem. 2012;58:925. [DOI] [PubMed] [Google Scholar]
- 8. American Diabetes Association. Standards in medical care for diabetes. Diabetes Care. 2017;40(suppl 1):s64-s74.27979895 [Google Scholar]
- 9. Clinical Laboratory News. Large-scale testing errors: tips on how labs can prepare and recover. Available at: https://www.aacc.org/publications/cln/articles/2012/october/testing-errors. Accessed October 1, 2012.