Hemoglobin A1c (HbA1c) reflects average glucose control over 2-3 months and is predictive for diabetes-related complications1 but is also limited by the turnover rate of red blood cells. Self-monitored blood glucose (SMBG) measurements provide earlier assessments of glycemic response. The A1c-derived average glucose (ADAG) study demonstrated a strong relationship between estimated average blood glucose (BG) and HbA1c in subjects with stable BG.2 The ADA recommends ADAG as an adjunct for determining glucose control in clinical practice.3
We used 24-hour 5-point SMBG profiles from patients receiving stable daily insulin dosing (after 8 weeks of treatment in the IMAGINE 3 trial)4 to determine how to use time-averaged BG (TABG) to estimate HbA1c. Patients were Type 1 diabetes (T1D) adults with HbA1c <12% (mean 7.9%), treated with prandial insulin lispro and either basal insulin peglispro or insulin glargine.4 Patients included in the analyses (N = 977; treatment groups were combined) had ≥1 complete 5-point SMBG profile in the period of interest and HbA1c values at weeks 4 and 18 (study weeks 12 and 26). Patients monitored BG at least 4 times daily (pre–morning meal, pre–midday meal, pre–evening meal, bedtime).
We calculated TABG for each 5-point SMBG profile collected during weeks 1-4 (fasting BG [FBG]-to-next-day-FBG) as follows:
where i = 1 to 5, with T1 to T5 being dates and times of BG measurements and BG1 to BG5 being BG measurements (mg/dL). Linear regression analysis was performed to assess the relationship between mean TABG and HbA1c.
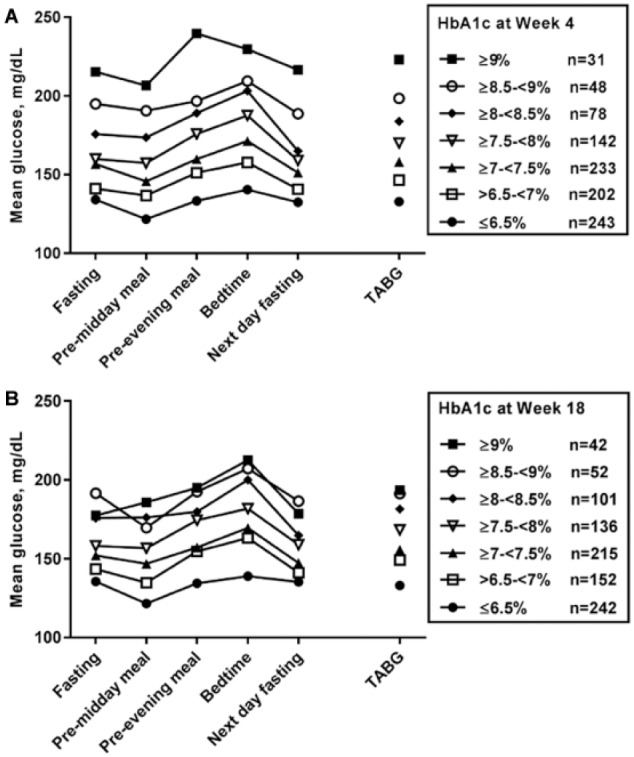
Higher daily mean SMBG values as well as higher mean TABG values corresponded to higher HbA1c (Figures 1a-1b). For TABG and week 4 HbA1c, the regression line was TABG (mg/dL) = -29.4 + 26.3*HbA1c (%). For week 18 HbA1c, the regression line was TABG (mg/dL) = 19.5 + 19.2*HbA1c (%). The regression line slope and intercept for week 4 HbA1c were comparable to those obtained in the ADAG study,2 thereby corroborating TABG as a method for estimating average BG in patients with T1D.
Figure 1.

Average BG values at each time point for the 5-point SMBG profiles and TABG (weeks 1-4) by HbA1c categories. (a) HbA1c category at week 4. (b) HbA1c category at week 18. The number of patients in each HbA1c category (n) is given.
Optimal cutoff values for TABGs corresponding to each HbA1c category were determined using receiver operator characteristic (ROC) analysis.5 ROC analysis indicated that a TABG value of <151 and <150 mg/dL corresponded to HbA1c <7% at weeks 4 and 18, with a sensitivity/specificity of 72%/72% and 70%/70%, respectively.
More daily BG profiles per patient resulted in a stronger correlation of TABG with HbA1c compared with fewer profiles. However, we did not determine the minimum numbers of SMBG profiles needed to estimate HbA1c for individual patients. These analyses, using data from intensive insulin treatment for T1D, may have limited generalizability to other populations.
In summary, 5-point SMBG (FBG to next-day-FBG) profiles with time/date stamps can be used to generate TABG value that predict glycemic control earlier than HbA1c. This method may be useful for estimating future HbA1c outcomes during stable insulin dosing both in clinical medicine and in evaluating the impact of steady state drug levels during clinical drug development trials.
Acknowledgments
The authors wish to acknowledge the helpful reviews and suggestions of Robert Heine, MD, of Eli Lilly and Company, and Kieren Mather, MD, of the Indiana University School of Medicine, Indianapolis, IN.
Footnotes
Abbreviations: ADAG, A1c-derived average glucose; BG, blood glucose; FBG, fasting BG; HbA1c, hemoglobin A1c; ROC, receiver operator characteristic; SMBG, self-monitored blood glucose; T1D, type 1 diabetes; TABG, time-averaged BG.
Declaration of Conflicting Interests: The author(s) declared the following potential conflicts of interest with respect to the research, authorship, and/or publication of this article: All authors were employees and minor shareholders of Eli Lilly and Company during the study.
Funding: The author(s) disclosed receipt of the following financial support for the research, authorship, and/or publication of this article: This study was funded by Eli Lilly and Company.
ORCID iD: Cynthia J. Harris  https://orcid.org/0000-0001-6897-3691
References
- 1. Diabetes Control and Complications Trial Research Group, Nathan DM, Genuth S, et al. The effect of intensive treatment of diabetes on the development and progression of long-term complications in insulin-dependent diabetes mellitus. N Engl J Med. 1993;329:977-986. [DOI] [PubMed] [Google Scholar]
- 2. Nathan DM, Kuenen J, Borg R, et al. Translating the A1C assay into estimated average glucose values. Diabetes Care. 2008;31:1473-1478. [DOI] [PMC free article] [PubMed] [Google Scholar]
- 3. American Diabetes Association. Standards of medical care in diabetes—2017. Diabetes Care. 2017;40(suppl 1):s1-s135.27979885 [Google Scholar]
- 4. Bergenstal RM, Lunt H, Franek E, et al. Randomized, double-blind clinical trial comparing basal insulin peglispro and insulin glargine, in combination with prandial insulin lispro, in patients with type 1 diabetes: IMAGINE 3. Diabetes Obes Metab. 2016;18:1081-1088. [DOI] [PMC free article] [PubMed] [Google Scholar]
- 5. Hanley JA, McNeil BJ. The meaning and use of the area under a receiver operating characteristic (ROC) curve. Radiology. 1982;143:29-36. [DOI] [PubMed] [Google Scholar]


