

Abstract
HbA1c is a key parameter in diabetes management. For years the test has been used exclusively for monitoring of long-term diabetic control. However, due to improvement of the performance, HbA1c is considered more and more for diagnosis and screening. With this new application, quality demands further increase. A task force of the International Federation of Clinical Chemistry and Laboratory Medicine developed a model to set and evaluate quality targets for HbA1c. The model is based on the concept of total error and takes into account the major sources of analytical errors in the medical laboratory: bias and imprecision. Performance criteria are derived from sigma-metrics and biological variation. This review shows 2 examples of the application of the model: at the level of single laboratories, and at the level of a group of laboratories. In the first example data of 125 individual laboratories of a recent external quality assessment program in the Netherlands are evaluated. Differences between laboratories as well as their relation to method principles are shown. The second example uses recent and 3-year-old data of the proficiency test of the College of American Pathologists. The differences in performance between 26 manufacturer-related groups of laboratories are shown. Over time these differences are quite consistent although some manufacturers improved substantially either by better standardization or by replacing a test. The IFCC model serves all who are involved in HbA1c testing in the ongoing process of better performance and better patient care.
Keywords: diabetes, diagnosis, HbA1c, monitoring, performance, quality targets
Clinical Interpretation and Performance of the Laboratory
The performance of a test is defined as the degree of agreement between the measured and true concentration of an analyte. In case of disagreement, the clinical interpretation of the reported result can be wrong. Disagreement derives from two major error sources: bias and imprecision.1,2 Bias is the systematic error in the measurement: when due to calibration errors measurement results are systematically too high or too low, we speak of positive and negative bias, respectively. Imprecision is the ad random error in the measurement and is determined by the reproducibility of the test, expressed as the coefficient of variation (CV). The higher the CV, the wider the range of results that are ad random too high or too low.
The impact of the parameters bias and imprecision on the clinical interpretation of HbA1c is shown in Figure 1. The red-green bar in the middle shows the clinical decision limits when HbA1c is used for diagnosis. HbA1c concentrations >47 mmol/mol (>6.4%) are interpreted as “diabetic.” HbA1c concentrations <39 mmol/mol (<5.7%) are normal.3,4 HbA1c concentrations in the range of 39-47 mmol/mol (5.7-6.4%) are associated with an increased risk to have or to develop diabetes.3 The difference between normal and diabetic HbA1c concentrations is small and therefore small errors in the measurement of HbA1c do have a high impact on the clinical interpretation.
Figure 1.
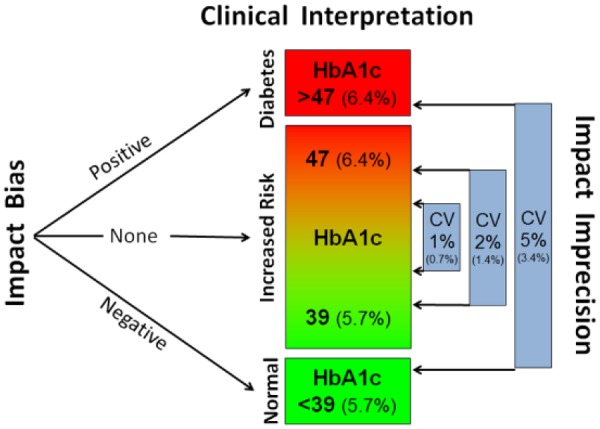
Impact of bias and imprecision on the clinical interpretation of a sample with an HbA1c of 43 mmol/mol (6.1%). HbA1c in IFCC/SI units (NGSP/DCCT units in brackets). The impact of a bias of 5 mmol/mol (0.46%) is shown on the left. The impact of several levels of imprecision is shown on the right. For details see the text.
The impact of bias is demonstrated in the left part of Figure 1. When the true concentration of a sample is 43 mmol/mol (6.1%), the clinical interpretation should be “increased risk.” However, if the laboratory has a positive bias of 5 mmol/mol (0.46%) a concentration of 48 mmol/mol (6.5%) will be reported and the clinician will interpret this falsely as “diabetic”. In case of a similar negative bias, a concentration of 38 mmol/mol (5.6%) will be reported leading to the false interpretation “normal.”
The impact of imprecision is seen in the right part of Figure 1. When the test is very precise with a CV (in IFCC units) of 1% (0.7% in NGSP units), measured concentrations in a sample with a true concentration of 43 mmol/mol (6.1%) will always be within narrow limits of 42-44 mmol/mol (6.0-6.2%) and the clinical interpretation will always be the correct “increased risk”. A moderate CV of 2% (1.4% NGSP) results in a dispersion of 41-45 mmol/mol (5.9-6.3%) which is still acceptable. But when a test has a CV of 5% (3.4% NGSP), measured HbA1c results will be so dispersed that the clinical interpretation will range from “normal” to “diabetic".
In summary, the clinical interpretation of an HbA1c test depends on the performance of the laboratory and derives from the combined bias and imprecision of the measurement.
IFCC Model Quality Targets
The previous section describes that the correct clinical interpretation of an HbA1c result depends on bias and imprecision of the measurement. It was the objective of the IFCC Task Force on Implementation of HbA1c Standardization (TF) (a) to transform this qualitative statement to a quantitative model to set and evaluate quality targets and (b) to define the criteria in that model.
Model
As basis the TF chose the concept of total allowable error (TAE). In this concept the total error (TE) of a measurement is derived from bias and imprecision and compared with the TAE to reveal a pass or fail.1,5 This is shown in Figure 2. Bias, defined as the difference between the measured HbA1c concentration and the true HbA1c concentration as established with the IFCC Reference Measurement Procedure (IFCC-RMP),6 is plotted on the vertical axis with the scaling in IFCC units (1-5 mmol/mol) and NGSP units (% in brackets). Imprecision, expressed as the CV is plotted on the horizontal axis.
Figure 2.
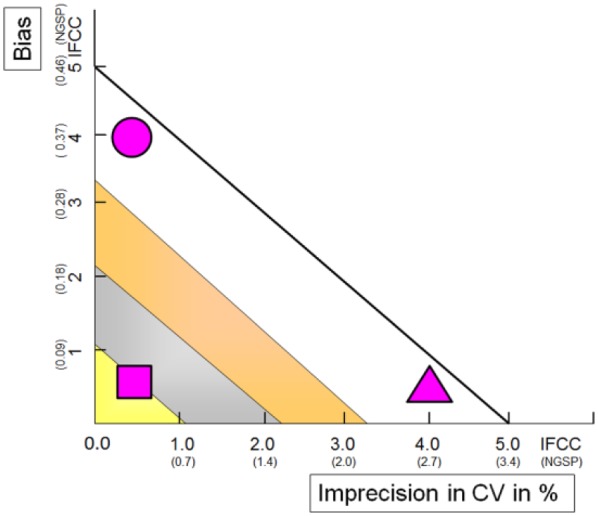
IFCC model to set and evaluate quality targets for HbA1c. Imprecision in IFCC/SI units (NGSP/DCCT units in brackets) is on the horizontal axis. Bias (IFCC/SI in mmol/mol; NGSP/DCCT in %) is on the y-axis. Purple symbols show three examples of performance. For interpretation criteria and details see text.
Criteria
Criteria for the TAE are derived from sigma-metrics1 and biological variation.7,8 In the sigma-metrics approach the criterion for TAE is set arbitrarily at 5 mmol/mol (0.46%). The rationale for this choice is that a difference of 5 mmol/mol (0.46%) is the smallest difference in 2 consecutive HbA1c tests that guides clinicians to change therapy.3,9 In the graph in Figure 2 the criterion is represented by the line drawn from 5 mmol/mol (0.46%) on the vertical axis to 5.0% (3.4%) on the horizontal axis. Any HbA1c performance within the triangle 0.0 – 5.0 – 5 (0.0 – 3.4 – 0.46) reveals a pass. It should be noted that the risk of not meeting the criterion is set at the 2 sigma level, which implies that 1 out of 20 results will not meet the criterion. Figure 2 shows that the criterion can (just) be met with either a good bias and moderate precision (triangle) or with a rather poor bias and excellent precision (circle). In the biological variation approach criteria are derived from biological variation and set at the level of optimum performance (yellow; “gold” in popular wording, triangle in Figure 2), desirable performance (gray/silver), and minimum performance (amber/bronze).7,8 The square in Figure 2 shows the performance of a laboratory that meets the most desirable criterion.
Discussion on Criteria
Criteria are arbitrarily chosen and from Figure 2 it can be seen that -even with good reasoning- they can be quite different. The IFCC is an international organization that only advises on quality targets. Local regulatory bodies will choose and set the most suitable criteria in their specific situation guided by multiple considerations like aim of the test, test environment, state of the art, economical affordability, practical aspects and clinical needs. Taken into account these considerations and limitations, the model allows the general statement that a performance outside the sigma-metrics criterion reflects poor quality and that performance in the colored zones of the biological variation criteria is associated with robust good performance. A popular interpretation of Figure 2 is a grading of performance in five categories: fail, pass, pass in bronze, pass in silver and pass in gold. The position in the graph indicates where improvement is possible: the lab represented by the circle should reduce bias and the triangle lab should work on precision to achieve a performance at the level of the lab represented by the square.
Multiple Application
The model can be applied at the level of a single laboratory (either just “my lab” or “my laboratory in comparison with my colleagues”) and at the level of a group of laboratories (eg, the general performance of a country or of laboratories using the test of the same manufacturer).10
Calculation of Imprecision Depending on HbA1c Results
The space for this paper does not allow detailed explanation of the IFCC Model for quality targets, but these can be found in Weykamp et al.10
CVs in IFCC- and NGSP units are different. This can be traced back to the conversion factor of NGSP to IFCC-units: HbA1c in NGSP units = (0.0915 x IFCC) + 2.15.11 The 2.15 is the intercept b in the general mathematical form of conversions: y = ax + b. An intercept substantially different from 0 reflects unspecificity in one of the methods (in this case of the NGSP/DCCT RMP) and one of the complications is that the CV of the analyte expressed in the respective units is different. In summary: the higher the unspecificity of a method, the lower the CV. For details please see Reference.12 This unspecificity-related difference explains the difference in CV on the horizontal axis of Figures 2-5 in this article. According to one of the statements in the consensus statement referred to above, the paper is in both units throughout the text: all data are expressed in IFCC/SI units and NGSP/DCCT units (NGSP/DCCT in brackets).
Figure 3.
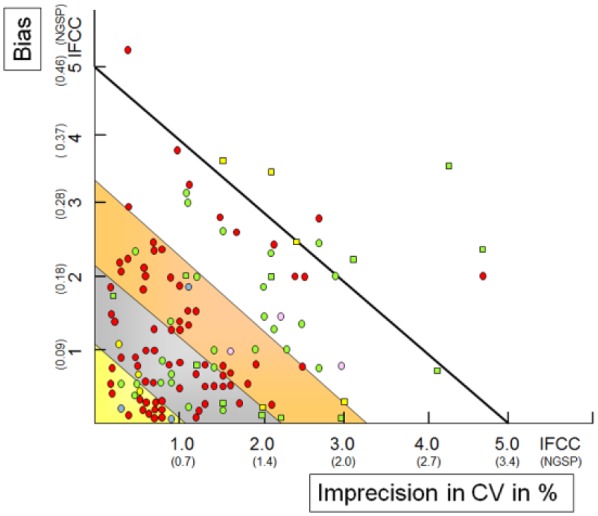
IFCC model applied to 128 individual laboratories in SKML 2017-3 EQA program in the Netherlands. The mean within-laboratory CV is on the horizontal axis; the laboratory absolute bias is on the vertical axis (IFCC in mmol/mol; NGSP in %). The circles (laboratory instruments) and squares (POCT instruments) represent the performance of individual laboratories with colors for analytical principles: green (immunoassays), red (ion exchange HPLC), yellow (boronate affinity), blue (capillary electrophoresis), pink (Enzymatic assays). For details see text.
Figure 4.
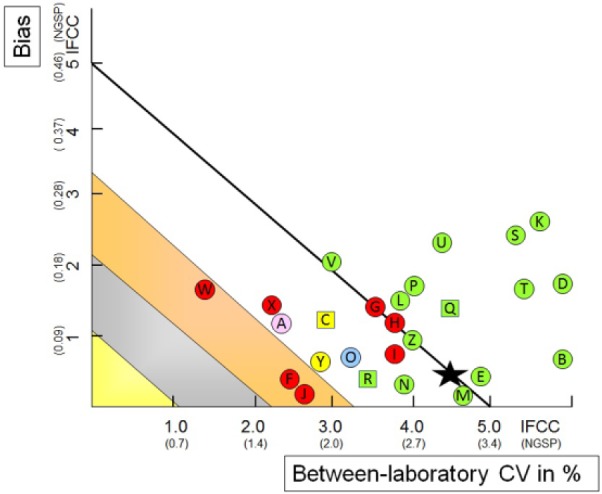
IFCC model applied to 26 manufacturer/instrument means in CAP 2017 GH-5a survey (Sample GH5-01; HbA1c 46 mmol/mol, 6.4%) in the United States. The mean between-laboratory CV is on the horizontal axis; the mean manufacturer absolute bias (IFCC in mmol/mol; NGSP in %) is on the vertical axis. The black star represents the overall mean of all laboratories. The circles (laboratory instruments) and squares (POCT/ dry chemistry instruments) represent specific manufacturers with colors for analytical principles: green (immunoassays), red (ion exchange HPLC), yellow (boronate affinity), blue (capillary electrophoresis), pink (enzymatic assays). Abbott Architect c enzymatic (A), Abbott Architect I System (B), Axis-Shield Afinion (C), Beckman AU systems (D), Beckman UniCel DxC Synchron (E), Bio-Rad D100 (F), Bio-Rad D10 (G), Bio-Rad Variant II (H), Bio-Rad Variant II Turbo (I), Bio-Rad Variant Turbo 2.0 (J), Roche Cobas c311 (K), Roche Cobas c500 series (L), Roche Cobas Integra 400 (M), Roche Cobas Integra 800 (N), Sebia Capillarys 2 Flex Piercing (O), Siemens Advia Chemistry Systems (P), Siemens DCA 2000/20Q0+ (Q), Siemens DCA Vantage (R), Siemens Dimension ExL (S), Siemens Dimension RxL (T), Siemens Dimension Vista (U), Siemens Dimension Xpand (V), Tosoh G7 Auto HPLC (W), Tosoh G8 Auto HPLC (X), Trinity Biotech Premier Hb9210 (Y), Ortho Clin Diag Vitros 5,1 FS, 4600, 5600 Chem System (Z). For details see text.
Figure 5.
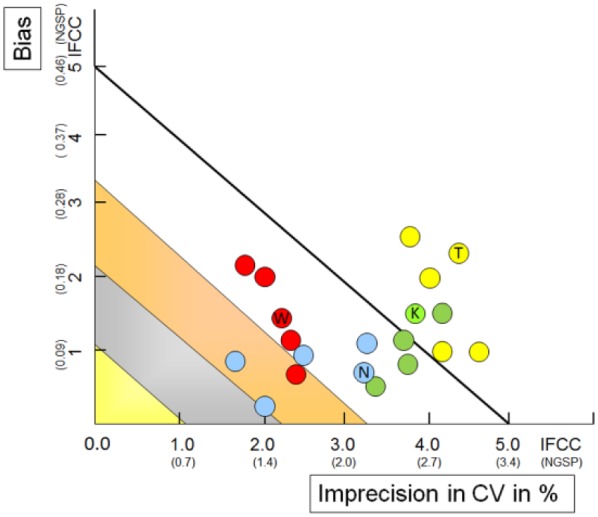
Consistency of performance across samples: IFCC model applied to the performance of manufacturers in the 5 samples in the CAP 2017 GH-5a survey. The mean between-laboratory CV is on the horizontal axis; the mean manufacturer absolute bias (IFCC in mmol/mol; NGSP in %) is on the vertical axis. Red circles show the performance of the Tosoh G8 in the respective 5 samples in CAP 2017 GH-5a. Blue (Sebia Capillarys 2 Flex Piercing), green (Roche c500), yellow (Siemens Vista). For details see text. The inscriptions W, N, K, and T refer to the results of the one of the five samples for which data are shown in Figure 4.
Application Within Laboratory
The IFCC model can be applied within a laboratory. Required are reliable data on bias and imprecision. A laboratory can collect these data itself (bias derived from a certified reference material or from proficiency testing (PT) / external quality assessment (EQA) programs and imprecision from internal quality control data). Most convenient however is to participate in a level-1 EQA program.13 These EQA programs use commutable samples, have target values of the samples assigned with approved reference measurement procedures, and the design of the program is such as that both bias and imprecision are reported. In addition the performance can be compared with the other participants of the program. As an example Figure 3 shows the results of a recent EQA program of the foundation for quality assurance in medical laboratories (SKML, Stichting Kwaliteits Bewaking Medische Laboratoria) in the Netherlands.14 Six times a year laboratories are supplied with 4 fresh whole blood samples targeted with the IFCC RMP. The performance of each of the 125 participating laboratories is represented with a circle (laboratory instruments) or a square (point-of-care testing [POCT] instruments) and the colors refer to the analytical principle of the test. It can be seen that there is a broad variation in performance: 15% is categorized as gold, 28% as silver, 30% as bronze, 18% pass without classification, and 9% fail. There is no strict relation between analytical principle and performance: users of HPLC and Immunochemical methods are both seen in the categories “fail” and “gold” but the prevalence in the colored zones is higher for HPLC users (85%) than for laboratories using immunochemical tests (54%). The same applies to the instrument types: users can be found in nearly all performance categories but the prevalence of failure is higher for POCT instruments (29%) than for laboratory instruments (4%). These differences suggest a method-related performance component. This is investigated in more detail in the next section.
Application Between Laboratories
The IFCC model can also be applied to a group of laboratories. Again data on bias and imprecision are required. The bias is the difference of the mean of all laboratories in the defined group (eg, laboratories using the test of the same manufacturer or all laboratories of a country) and the target assigned with the RMP. The imprecision is the between-laboratory CV of the laboratories in the group. Figure 4 shows as an example the results of a recent PT program of the College of American Pathologists (CAP) in the United States (sample GH5-01 of CAP 2017 GH-5a survey).15 Three times a year five fresh whole blood samples are supplied with target values assigned by the NGSP network laboratories; data were accessed from the NGSP website.15 The black star represents the overall performance of the more than 3000 laboratories participating in the survey. The star is just within the 2-sigma criterion of a TAE of 5 mmol/mol (0.46%). This means that approximately 1 out of 20 laboratories reported an HbA1c with a bias of 5 mmol/mol (0.46%) or more. The circles represent a differentiation to groups of laboratories using a test of the same manufacturer/instrument (see legend for explanation). Figure 4 demonstrates quite a difference in performance between manufacturer groups. Immunochemical methods in general perform less well than methods with other analytical principles. This is mainly due to a higher between-laboratory CV (“shift of green circles to the right”). The performance of POCT instruments is not different from laboratory instruments. Figure 4 shows the performance of one moment in time in one sample. For robust statements it is relevant to investigate the consistency of these observations across samples and over time. Figure 5 shows the performance of 5 samples from the CAP 2017 GH5 survey for 4 manufacturers. Although there are differences from sample to sample these are relatively small. For Tosoh and Siemens differences are mainly seen in the bias, for Sebia in the between-laboratory CV. It can be concluded that performance between samples is quite consistent. Results for methods reported in both CAP 2014 (GH-2a) and 2017 (GH-5a) surveys are compared in Table 1 to investigate performance over time.15 Of the 11 methods that passed the 2-sigma criterion in 2014, 9 passed again in 2017 and 2 failed. Of the 13 methods failing in 2014, 9 failed again and 4 passed in 2017. Thus it can be concluded that the performances of methods are also quite consistent over time. Application of the model to manufacturer groups also informs the manufacturers on the quality of their test in comparison to the competitors and may signal the need for improvement. Measures can be (a) review of the standardization of the test, (b) better education of customers on use and maintenance, (c) strict batch-to-batch management, and (d) replace intrinsic poor tests by a better test. The 2017 CAP data show examples of manufacturers doing this: Tosoh improved standardization and Abbott replaced the poor immunochemical test by a much better enzymatic test.
Table 1.
Comparison of Performance of Manufacturer User Groups in the CAP 2014 GH-2a and 2017 GH-5a Surveys.
| 2014 | Pass 2017 | Fail 2017 |
|---|---|---|
| Pass (n = 11) | 9 | 2 |
| Fail (n = 13) | 4 | 9 |
Overview and Considerations
For decades HbA1c has been the key parameter to monitor long-term glycemic control. Due to standardization efforts of IFCC/NGSP and innovations by the manufacturers, the performance of the test has been improved that much that HbA1c is now recommended for diagnosis and screening.16-18 The focus of quality management is different for both applications. When used to monitor diabetic control, the clinical decision on therapy change is based on the change in two consecutive HbA1c tests. In that case reproducibility is the most important. But when used for diagnosis the interpretation is based on an absolute clinical decision limit and then accuracy of the HbA1c test is the most relevant quality parameter. The consequence is that by now, quality management in the laboratory should focus on both accuracy and reproducibility. Then typical questions arise: “How to establish quality in general?” “What are reasonable criteria?” “How do I estimate the quality in my lab?” “Is poor quality in my lab caused by poor operation of the test or by the intrinsic poor quality of the test itself?” (or “Should I blame myself or the manufacturer?”). The IFCC TF developed a model to address these questions. The model is based on the concept of total error which includes both bias (related to accuracy) and imprecision (related to reproducibility). Application in a single laboratory shows the performance of the laboratory in comparison to performance criteria and (when data of EQA/PT programs are used) other laboratories. Application of the model to manufacturer groups in EQA/PT programs demonstrates the difference in performance between the tests that are on the market. Information taken from these evaluations guides the laboratory to improve quality. When the cause of poor quality is laboratory based, maintenance of the test, training and motivation of the staff should be reviewed. But when the poor quality is due to the method, the method should be replaced. Application of the model to manufacturer groups also informs the manufacturers on the quality of their test in comparison to the competitors and is a trigger to improve. The focus on quality of all who are involved results in an ongoing process of better performance and thus better patient care.
Footnotes
Abbreviations: ADA, American Diabetes Association; CAP, College of American Pathologists; CV, coefficient of variation; DCCT, Diabetes Control and Complications Trial; EASD, European Association for the Study of Diabetes; EQA, external quality assessment; IDF, International Diabetes Federation; IFCC, International Federation of Clinical Chemistry and Laboratory Medicine; NGSP, National Glycohemoglobin Standardization Program; POCT, point-of-care testing; PT, proficiency testing; RMP, reference measurement procedure; SKML, Stichting Kwaliteits Bewaking Medische Laboratoria; TAE, total allowable error; TE, total error; TF, IFCC Task Force on Implementation of HbA1c Standardization.
Declaration of Conflicting Interests: The author(s) declared no potential conflicts of interest with respect to the research, authorship, and/or publication of this article.
Funding: The author(s) received no financial support for the research, authorship, and/or publication of this article.
References
- 1. Westgard JO, Westgard SA. Total analytical error: from concept to application. Available at: www.aacc.org/publications/cln/articles/2013/september/total-analytic-error. Accessed June 2017.
- 2. Bais R, Armbruster D, Jansen RTP, et al. Defining acceptable limits for the metrological traceability of specific measurands. Clin Chem Lab Med. 2013;51(5):973-979. [DOI] [PubMed] [Google Scholar]
- 3. American Diabetes Association. Standards of medical care in diabetes-2011. Diabetes Care. 2011;34(suppl 1):S11-S61. [DOI] [PMC free article] [PubMed] [Google Scholar]
- 4. American Diabetes Association. Standards of medical care in diabetes-2010. Diabetes Care. 2010;33(suppl 1):S11-S61. [DOI] [PMC free article] [PubMed] [Google Scholar]
- 5. Westgard JO, Carey RN, Wold S. Criteria for judging precision and accuracy in method development and evaluation. Clin Chem. 1974;20(7):825-833. [PubMed] [Google Scholar]
- 6. Jeppsson JO, Kobold U, Barr J, et al. Approved IFCC reference method for the measurement of HbA1c in human blood. Clin Chem Lab Med. 2002;40(1):78-89. [DOI] [PubMed] [Google Scholar]
- 7. Westgard QC. Quality requirements: minimum specifications from biological variation database. Available at: www.westgard.com/minimum-biodatabase1.htm. Accessed August 2014.
- 8. Fraser CG, Hyltoft Petersen P, Libeer JC, Ricos C. Proposal for setting generally applicable quality goals solely based on biology. Ann Clin Biochem. 1997;34(Pt 1):8-12. [DOI] [PubMed] [Google Scholar]
- 9. National Institute for Health and Clinical Excellence. Type 2 diabetes: newer agents. Available at: http://www.nice.org.uk/guidance/cg87/resources/cg87-yype-2-diabetes-newer-agents-a-partial-update-of-cg66-short-guideline2. Accessed October 2014. [PubMed]
- 10. Weykamp C, John G, Gillery P, et al. Investigation of 2 models to set and evaluate quality targets for HbA1c: biological variation and sigma-metrics. Clin Chem. 2015;61(5):752-759. [DOI] [PMC free article] [PubMed] [Google Scholar]
- 11. Hoelzel W, Weykamp C, Jeppsson JO, et al. IFCC reference system for measurement of hemoglobin A1c in human blood and the national standardization schemes in the United States, Japan and Sweden: a method-comparison study. Clin Chem. 2004;50(1):166-174. [DOI] [PubMed] [Google Scholar]
- 12. Weykamp CW, Mosca A, Gillery P, Panteghini M. The analytical goals for hemoglobin A(1c) measurement in IFCC units and National Glycohemoglobin Standardization program units are different. Clin Chem. 2011;57(8):1204-1206. [DOI] [PubMed] [Google Scholar]
- 13. Miller WG, Jones GR, Horowitz GL, Weykamp C. Proficiency testing/external quality assessment: current challenges and future directions. Clin Chem. 2011;57(12):1670-1680. [DOI] [PubMed] [Google Scholar]
- 14. SKML. HbA1c EQA Data Available at: www.skml.nl. Accessed June 2017 (password protected).
- 15. National Glycohemoglobin Standardization Program. College of American Pathologists (CAP) survey data. Available at: www.ngsp.org. Accessed June 2017.
- 16. John WG, UK Department of Health Advisory Committee on Diabetes. Use of HbA1c in the diagnosis of diabetes mellitus in the UK. The implementation of World Health Organization guidance 2011. Diabet Med. 2012;29(11):1350-1357. [DOI] [PubMed] [Google Scholar]
- 17. Seino Y, Nanjo K, Tajima N, et al. Report of the Committee on the classification and diagnostic criteria of diabetes mellitus. J Diabetes Investig. 2010;1(5):212-228. [DOI] [PMC free article] [PubMed] [Google Scholar]
- 18. International Expert Committee. International Expert Committee report on the role of the A1c assay in the diagnosis of diabetes. Diabetes Care. 2009;32(7):1327-1334. [DOI] [PMC free article] [PubMed] [Google Scholar]