

Abstract
Translation of ribosomal protein (rp) mRNA is selectively repressed in mouse erythroleukemia (MEL) cells, which cease to proliferate upon differentiation, and in NIH 3T3 cells, for which growth is arrested by either serum starvation, contact inhibition, or treatment with the DNA polymerase inhibitor, aphidicolin. The efficiency of translation of rp mRNAs correlates with the expression of the gene encoding the cap binding protein, eIF-4E, as indicated by the fact that the abundance of the corresponding mRNA and protein also fluctuates in a growth-dependent manner. To examine the hypothesis that eIF-4E plays a role in regulation of the translation efficiency of rp mRNAs, we utilized an NIH 3T3-derived eIF-4E-overexpressing cell line. These cells overproduce eIF-4E to the extent that even under conditions of growth arrest, the abundance of the respective protein in its active (phosphorylated) form is higher than that found in exponentially growing NIH 3T3 cells. Nevertheless, this surplus amount of eIF-4E does not prevent the translational repression of rp mRNAs when the growth of these cells is arrested by blocking DNA synthesis with aphidicolin or hydroxyurea. In complementary experiments we used an in vitro translation system to compare the competitive potential of mRNAs, containing the translational cis-regulatory element (5′ terminal oligopyrimidne tract) and mRNAs lacking such a motif, for the cap binding protein. Our results demonstrate that both types of mRNAs, regardless of their translational response to growth arrest, exhibit similar sensitivity to the cap analogue m7G(5′)ppp(5′)G. It appears, therefore, that the presence of the regulatory sequence at the 5′ terminus of rp mRNAs does not lessen its competitive potential for the cap binding protein and that the growth-dependent decrease in the activity of eIF-4E does not play a key role in the repression of translation of rp mRNAs.
Keywords: Ribosomal protein mRNAs, Oligopyrimidine tract, Translational control, Growth arrest, Initiation factor eIF-4E, Cap binding protein, Cap analogue
THE translation efficiency of vertebrate ribosomal protein (rp) mRNAs is predominantly dependent on the cellular growth status (Avni et al., 1994 and references therein). A similar growth-dependent translational control has been demonstrated for several other mRNAs, including that encoding elongation factor EF-1α (Jefferies et al., 1994b; Yenofsky et al., 1983). One common feature to all these mRNAs rigorously analyzed thus far is the 5′ terminal oligopyrimidine tract (5′ TOP). This element is comprised of a cytidine residue at the cap site followed by an uninterrupted stretch of up to 13 pyrimidines (Amaldi and Pierandrei-Amaldi, 1990; Chitpatima et al., 1988; Makrides et al., 1988; Perry and Meyuhas, 1990; Uetsuki et al., 1989). Mutational analyses have established a critical role for the 5′ TOP in the translational control of rp mRNAs in mammalian cells (Avni et al., 1994; Levy et al., 1991).
A simple model to account for the selective growth-dependent translational control of rp mRNAs assumes the participation of a factor that is a component of the general protein synthesis machinery. If such a factor had a particular low affinity for rp mRNAs, due to their unique sequence at the 5′ terminus, a decrease in its activity or level of expression might lead to a selective diminution in the utilization of these mRNAs. A prime candidate is the initiation factor eIF-4E, which binds specifically to the mRNA cap structure. This protein is a component of a three-subunit complex, eIF-4F, which is involved in ATP-dependent unwinding of 5′ mRNA secondary structure (Rhoads, 1988; Rozen et al., 1990; Sonenberg, 1988). eIF-4E is the least abundant of the translation initiation factors, present at 0.020–0.25 molecules per ribosome, compared to one-three molecules per ribosome for the other initiation factors (Duncan et al., 1987; Hiremath et al., 1985). Hence, the entire eIF-4F complex is a limiting component in the binding of mRNAs to the ribosome, which is considered to be the overall rate-limiting step in translation (Walden et al., 1981). eIF-4E has been implicated in discrimination between weak and strong mRNAs both in in vitro translation systems (Ray et al., 1983; Sarkar et al., 1984) and in vivo (Fagan et al., 1991; Koromilas et al., 1992). The mechanism by which eIF-4E controls the rate of translation initiation is not well understood, but phosphorylation on a single serine residue (Ser-53, Rychlik et al., 1987), correlates positively with the rate of translation (Koromilas et al., 1992 and references therein). The biological significance of the limiting nature of eIF-4E is illustrated most dramatically by the observations that its overexpression causes malignant transformation of rodent fibroblasts (Lazaris-Karatzas and Sonenberg, 1992; Lazaris-Karatzas et al., 1990) and aberrant growth of HeLa cells (De Benedetti and Rhoads, 1990). Moreover, underexpression of the eIF-4E gene slowed the growth of HeLa cells (De Benedetti et al., 1991). These findings demonstrate the importance of eIF-4E in the control of cell growth, most probably at the level of translation initiation.
Several lines of evidence support the notion that eIF-4E could be involved in the selective translational control of rp mRNAs: a) an increase in the translational efficiency of rp mRNAs during transition of Swiss 3T3 cells from nongrowing to growing states occurs simultaneously with enhanced phosphorylation of eIF-4E (Kaspar et al., 1990); b) the translation of mouse rp mRNAs in rabbit reticulocyte lysate is relatively inefficient unless either eIF-4F or eIF-3 is added (Hammond et al., 1991); c) recently, we have observed that the selective repression of rp mRNAs translation during rat liver development and the stimulated translation of these mRNAs following partial hepatectomy is accompanied by parallel fluctuations in the abundance of the mRNAs encoding eIF-4E and eIF-4A (Aloni et al., 1992). It should be noted, however, that other lines of evidence, which are listed in the Discussion section, seem to support the contention that a specific trans-acting factor is involved in this mode of regulation. These opposing arguments have prompted us to assume that 5′ TOP-containing mRNAs are trans-lationally regulated by the combined actions of eIF-4E and a specific factor.
The experiments described below were designed to assess the involvement of eIF-4E in the selective growth-dependent translational control of rp mRNAs. Our results indeed show a good correlation between fluctuations in the utilization of rp mRNAs and the abundance of eIF-4E. However, these alterations are not causally related. Thus, rp mRNAs are selectively repressed in resting NIH 3T3 cells, even in the presence of overexpressed active eIF-4E. Furthermore, the 5′ TOP within rp mRNAs does not seem to affect the competitive potential of these mRNAs for the cap binding protein.
MATERIALS AND METHODS
Cell Culture
Mouse erythroleukemia (MEL) cells were grown in suspension in Dulbecco’s modified Eagle’s medium (DMEM) containing 10% fetal calf serum (FCS) and supplemented with 2 mM glutamine, 100 U/ml penicillin, and 0.1 mg/ml streptomycin. Differentiation was induced by exposure to 5 mM hexamethylen bisacetamide (HMBA) for 72 h. P1798.C7 mouse lymphosarcoma cells were grown in suspension under the conditions described by Cavanaugh and Thompson (1983). Growth of these cells was arrested by their exposure to 10−7 M dexamethasone for 24 h. Cell growth was renewed by hormone withdrawal as previously described (Meyuhas et al., 1987). Monolayers of mouse NIH 3T3 cells were cultured in a medium similar to that used for MEL cells. These cells were growth arrested by either contact inhibition through growth to confluence or by maintenance in a medium containing 0.5% serum for 72 h. In the latter case, cell growth was stimulated by replacing the low-serum medium by a normal growth medium for an additional 24 h. Transformed NIH 3T3/eIF-4E cell line (clone P2, generated as described by Lazaris-Karatzas et al., 1990, 1992) was cultured as the parental NIH 3T3 cells, but was maintained in the presence of 400 μg/ml of G418 (geneticin, Sigma, St. Louis, MO). Growth of these cells was arrested by treating them for 24 h with one of the following drugs: 5 μg/ml aphidicolin (Sigma) or 0.15 mM hydroxyurea (Sigma). Recovery of cell growth was attained by replacing the medium with normal growth medium for an additional 24 h. The dramatic unloading of ribosomes from polysomes upon growth arrest and their recruitment into polysomes upon growth resumption (Meyuhas et al., 1987) was exploited as a diagnostic tool to assess the efficiency of the drug treatment and of its withdrawal.
RNA Isolation and Analysis
Preparation of cytoplasmic extracts, and subsequent isolation of poly(A)+ mRNA and quantitative RNA (Northern) blot analysis were performed as previously described (Meyuhas et al., 1987). In some cases (indicated in the appropriate figure legends), cytoplasmic RNA was extracted as described by Shaw et al. (1984). Poly(A)+ RNA used for translation in vitro was prepared by PolyA-Tract System 1000 (Promega, Madison, WI).
Cell-Free Translation and Analysis of Products
Rabbit reticulocyte lysate (Flexi) was from Promega. Total protein synthesis was measured by monitoring the incorporation of [35S]methionine (Amersham, UK) into trichloroacetic acid-precipitable material (Meyuhas and Perry, 1980). Synthesis in vitro of human growth hormone (hGH) was directed by poly(A)+ mRNA prepared from NIH 3T3 cells stably transfected with constructs expressing the hGH gene (Avni et al., 1994; Levy et al., 1991). The translation reaction was carried out in the presence of unlabeled mixture of all 20 amino acids, and the amount of the resulting hGH was measured by radioimmunoassay with a commercial kit (Nichols Institute, San Juan Capistrano, CA).
Polysome Fractionation
Harvesting of cells grown in suspension was carried out as previously described (Meyuhas et al., 1987). Cells in monolayers were exposed to 90 μg/ml cyclohexamide (Sigma) for 10 min prior to harvesting and during the trypsinization and wash. Cytoplasmic extracts were prepared as previously described (Meyuhas et al., 1987). Size fractionation of polysomes by sucrose gradient centrifugation and extraction of RNA from the polysomal and the subpolysomal fractions were performed as previously described (Aloni et al., 1992). The percentage of an mRNA associated with polysomes was assessed by Northern blot hybridization of poly(A)+ mRNA, isolated from these fractions, with the appropriate probes. Determination of the relative abundance of mRNAs in the polysomal fractions of the various gradients, as well as other quantitaive estimations based on autoradiographic signals, was made by densitometric scanning of the autoradiograms. Exposures were chosen so that the signals were within the linear response range of the film.
Western Blot Analysis
Cells grown in monolayer were washed twice with cold PBS (0.125 M NaCl, 10 mM NaH2PO4, 30 mM K2HPO4) and scraped off by rubber policeman. P1798 cells were collected by centrifugation. Cells were lysed in TNE buffer [20 mM Tris-HCl (pH 7.5), 100 mM NaCl, 0.5% NP-40, 2 mM phenylmethylsulfonyl fluoride (PMSF)] on ice for 15 min with several brief mixings on a Vortex mixer, followed by sonication for 20 s (Braun-Sonic 300 homogenisator, Rochester, NY). Lysates were clarified by centrifugation at 8 krpm for 20 min. Aliquots containing equal amount of protein, as determined by Bradford assay (Bio-Rad), were analyzed on a 12.5% SDS-polyacrylamide gel (SDS-PAGE). Proteins were electroblotted onto nitrocellulose membrane (Schliecher & Schuell, Dassel, Germany) in 25 mM Tris-HCl (pH 7.5), 190 mM glycin, 0.1% SDS, 20% methanol for 1 h at 120 mA. The membrane was blocked with 10% dried skim milk powder and 3% bovine serum albumin in TBST [20 mM Tris-HCl (pH 7.5), 0.5 M NaCl, 0.1% Tween 20] for 1 h at room temperature, washed extensively with TBST, and incubated with both a polyclonal rabbit antibody against a mouse eIF-4E synthetic peptide (Lazaris-Karatzas et al., 1990) and a monoclonal anti-mouse β-actin antibody (Amersham, UK) for 1 h. The membrane was then washed, further incubated with sheep anti-mouse IgG-coupled horseradish peroxidase and donkey anti-rabbit IgG-coupled horseradish peroxidase for 1 h, washed again, developed with ECL detection kit (Amersham, UK), and exposed to x-ray film.
Metabolic Labeling of Cells and Immunoprecipitation of eIF-4E
NIH 3T3 cells were grown in 60-mm-diameter culture dishes, washed with methionine-free DMEM containing 10% dialyzed FCS, and incubated in the same medium for 20 min prior to labeling. Cells were incubated with 1.5 ml of 0.53 mCi/ml of [35S]methionine (Du-Pont NEN, USA) in methionine-free medium for 4 h. Cells were washed twice with ice-cold PBS, scraped off with a rubber policeman, and incubated with 1 ml of RIPA buffer [150 mM NaCl, 1% NP-40, 0.5% deoxycholate, 0.1% SDS, 50 mM Tris-HCl (pH 8.0), 2 mM PMSF] on ice for 30 min with several brief mixings on a Vortex mixer. Lysates were clarified by centrifugation for 15 min in a microfuge. Equal amounts of 35S-labeled proteins (2 × 10⁷ cpm), as monitored by scintillation counting of trichloroacetic acid precipitates, were subjected to immunoprecipitation with polyclonal anti-eIF-4E antibody (Frederickson et al., 1991) for 2 h on ice; 40 ml of 50% suspension of protein A-Sepharose beads (Pharmacia, Uppsala, Sweden) in RIPA was added and the mixture was rotated for 1 h at 4°C. The immunocomplexes were extensively washed once with RIPA, twice with RIPA containing 1 M NaCl and twice more with RIPA, and boiled in 40 ml of loading buffer [100 mM Tris-HCl (pH 6.8), 0.2 M DTT, 4% SDS, 0.2% bromphenol blue (BPB), 20% glycerol]. The supernatant was loaded onto a 12.5% SDS-PAGE. After electrophoresis the gels were fixed, enhanced (EN3HANCE solution, Du-Pont NEN), rinsed with water, dried, and exposed to x-ray film at −70°C.
Two-Dimensional Isoelectric Focusing (IEF) Analysis
Two-dimensional IEF/SDS-PAGE was performed by a modification of O’Farrell’s procedure (O’Farrell, 1975). Monolayer cultures were washed with PBS, scraped off with a rubber policeman in 250 ml of urea lysis buffer [9.2 M urea, 2% NP-40, 2% pH 3.5–10 ampholines (Sigma), 5% β-mercaptoethanol], followed by extensive mixing on a Vortex mixer and incubation on ice for 15 min. The lysates were clarified at 8 krpm for 20 min. First-dimension gel in glass tubes contained 9.2 M urea, 2% NP-40, 4% acrylamide: bisacrylamide (28.4 : 1.6), 2% pH 3.5–10 ampholines. The cathode solution was 20 mM NaOH and the anode solution was 20 mM H3PO4. After prefocusing (30 min at 100 V, 30 min at 200 V, 60 min at 400 V), aliquots containing equal amounts of protein, as determined by Bradford assay, were loaded on the IEF gel tubes and focused overnight at 350 V. Tube gels were equilibrated in 10% glycerol, 2% SDS, 0.1 M Tris-HCl (pH 6.8), 5% β-mercaptoethanol, and 0.2% BPB for 2 h and electrophoresed in the second dimension on a 12.5% SDS-PAGE. Western blot analysis with antibodies raised against mouse β-actin and eIF-4E was carried out as described above.
Probes
The isolated fragment probes used in the Northern blot analysis were: a 0.51-kb SacII-XbaI fragment containing a mouse rpL30 processed gene derived from pIcXba (Wiedemann and Perry, 1984); a 0.29-kb EcoRI-HindIII fragment containing the cDNA insert of mouse rpS16 derived from a subclone in pUC8 (Meyuhas and Perry, 1980); a 0.95-kb PstI fragment containing rat rpS4 cDNA (Gayathri Devi et al., 1989); a 1.15-kb PstI fragment containing mouse α-actin cDNA (Minty et al., 1981); a 1.4-kb EcoRI-HindIII fragment containing mouse eIF-4E cDNA (Lazaris-Karatzas et al., 1990); a 0.58-kb HincII fragment containing the first and second exons and the first intron of mouse β-globin (Konkel et al., 1978).
RESULTS
The Translation of rp mRNAs Is Selectively Repressed During Differentiation of MEL Cells and Growth Arrest of NIH 3T3 Cells
MEL cells are rapidly proliferating, virus-transformed erythroid precursors. Treatment of these cells with a wide variety of chemicals induces their terminal differentiation, which is characterized by expression of erythroid-specific genes and cessation of growth (Marks et al., 1987 and references therein). Surprisingly, previous experiments failed to demonstrate translational repression of an rp mRNA upon terminal differentiation of these cells (Krowczynska et al., 1989; Yenofsky et al., 1983). To reexamine this exceptional behavior, we induced MEL cells to differentiate by HMBA (Marks et al., 1987). Polysomes from untreated or differentiated MEL cells were size fractionated by sucrose gradient centrifugation and the relative loading of various mRNAs onto polysomes was assessed by Northern blot analysis of similar aliquots from the polysomal and subpolysomal fractions (Table 1). Our results demonstrate that the MEL cells exhibit a selective translational repression of rp mRNAs, as exemplified by their polysomal distribution in comparison with that of mRNAs encoding actin and globin. Notably, globin mRNA, which was barely detected in the growing cells, was very efficiently translated following differentiation. The reason for the exceptional drastic decrease in the translation efficiency of rpS16 mRNA upon differentiation of MEL cells (compare with NIH 3T3 cells in Table 1 and Aloni et al., 1992; Meyuhas et al., 1987) is not known.
TABLE 1.
THE EFFECT OF GROWTH STATUS OF MEL CELLS AND NIH 3T3 CELLS ON THE TRANSLATION OF VARIOUS mRNAs
| Percent mRNA in Polysomes* | ||||||
|---|---|---|---|---|---|---|
| MEL | NIH 3T3 | |||||
| Control | HMBA Treated | Control | Contact Inhibited | Serum Starved | Serum Refed | |
| rpS16 | 62 | 7 | 73 | 32 | 17 | 96 |
| rpL30 | 78 | 35 | 81 | 21 | 35 | 80 |
| Actin | 100 | 94 | 92 | 93 | 92 | 100 |
| Globin | — | 93 | — | — | — | — |
Determined as described in Material and Methods; the data were derived from a single experiment for each treatment.
It previously has been shown that growth arrest of NIH 3T3 cells by serum deprivation leads to a selective repression of translation of rp mRNAs (Geyer et al., 1982; Kaspar et al., 1990). To verify whether contact inhibition and serum starvation exert a similar effect on the translation of rp mRNAs, we monitored the polysomal distribution of these mRNAs in NIH 3T3 cells, which were growth arrested by either procedure. The results shown in Table 1 indicate that the translation of rp mRNAs is selectively repressed in resting NIH 3T3 cells, irrespective of the mode of their growth arrest. When serum-starved cells are supplemented with 10% serum they resume, within 24 h, efficient translation of these mRNAs (Table 1, Serum Refed).
The Expression of eIF-4E Gene Decreases in Quiescent Cells
We have recently shown that fluctuations in the translation efficiency of rp mRNAs during development and regeneration of rat liver are accompanied by parallel changes in the abundance of eIF-4E mRNA (Aloni et al., 1992). To examine whether this correlation is confined to the rat liver, we set out to monitor the expression of eIF-4E gene in various cell lines and under different growth conditions. Northern blot analysis revealed that, like in the developing liver, cessation of growth led to a noticeable decrease in the abundance of eIF-4E mRNA in HMBA-treated MEL cells, serum-starved NIH 3T3 cells, and dexamethasone-treated P1798 cells (Fig. 1a). Resumption of growth upon serum stimulation of NIH 3T3 cells or hormone withdrawal of P1798 cells induced accumulation of this mRNA, as previously shown for the regenerating liver (Fig. 1a and Aloni et al., 1992).
FIG. 1.
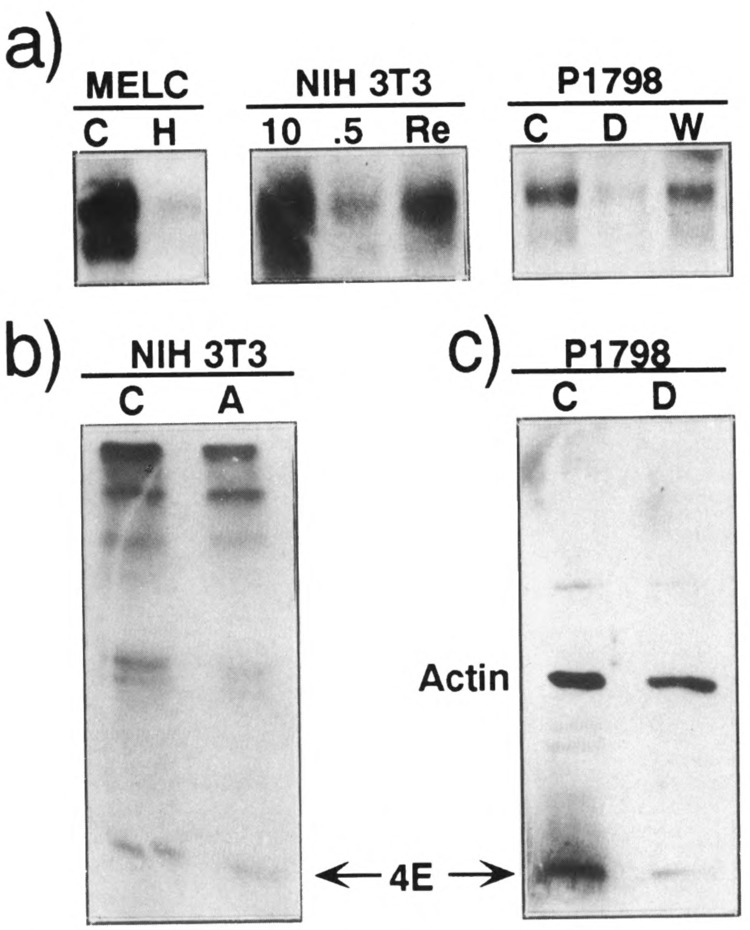
The abundance as well as the synthesis rate and steady-state level of the encoded protein in growing and resting cells, (a) Fluctuations in the relative abundance of eIF-4E mRNA during transitions between growing and resting states. Poly(A)+ mRNA was isolated (Shaw et al., 1984) from untreated (C) or HMBA treated for 72 h (H) MEL cells (MELC); from NIH 3T3 cells, which were either exponentially growing in 10% serum (10), serum starved (.5), or serum stimulated (Re); and from lymphosarcoma cells (P1798), which were either untreated (C), dexamethasone treated for 24 h (D), or 24 h after hormone withdrawal (W). Poly(A)+ mRNA from MEL cells (0.5 μg), P1798 cells (0.5 μg), and from NIH 3T3 cells (2 μg) was analyzed by Northern blot hybridization with eIF-4E probe. Only the two most intense eIF-4E transcripts (1.8 and 1.6 kb long), out of the five normally visualized by this probe (Jaramillo et al., 1991), are presented here, (b) Relative synthesis rate of eIF-4E. Untreated (C) sparsely cultured NIH 3T3 cells and cells treated with 5 μg/ml aphidicolin for 24 h (A) were labeled for 4 h with [35S]methionine and labeled eIF-4E was immunoprecipitated from cell lysates containing equal trichloroacetic acid-precipitable radioactivity. The immunoprecipitates were analyzed by SDS-PAGE as described in Materials and Methods. The eIF-4E band (identified by its mol.wt.) is indicated, (c) Steady-state level of eIF-4E protein. Cellular proteins (38 μg) from untreated (C) and dexamethasone-treated (D) P1798 cells (C) were analyzed by Western immunoblotting as described in Materials and Methods. The bands representing eIF-4E and actin are indicated.
Aphidicolin is a specific inhibitor of DNA polymerase α, which has been shown to reversibly arrest the growth of a large number of cell types (Spadari et al., 1982). When NIH 3T3 cells were exposed to this agent they ceased to proliferate and the translation of rp mRNAs was repressed to the same extent as in cells that were either serum starved or contact inhibited (S. Shama and O. Meyuhas, unpublished results). Similarly, the level of eIF-4E mRNA decreased in aphidicolin-treated NIH 3T3 cells (see NIH lanes in Fig. 2a). The decline in the abundance of eIF-4E mRNA upon aphidicolin treatment was accompanied by a comparable diminution in synthesis rate of eIF-4E protein, as measured by its immunoprecipitation from cells, which had been metabolically labeled with [35S]methionine (Fig. 1b). Finally, when we measured the steady-state level of eIF-4E by Western blot analysis and densitometric scanning of the resulting autoradiogram, we noticed about a twofold decrease in dexamethasone-treated P1798 cells (Fig. 1c) or a fourfold decrease in aphidicolin-treated NIH 3T3 cells (two independent experiments, S. Shama and O. Meyuhas, unpublished results). Thus, the correlation between the repressed translation of rp mRNAs in nongrowing cells and the decrease in the abundance of eIF-4E mRNA and the respective protein seems to be of a general nature.
FIG. 2.
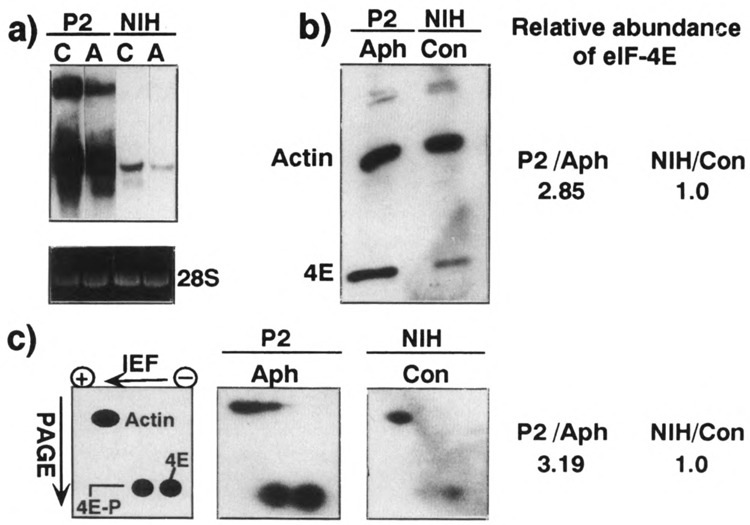
Overexpression of eIF-4E in growing and nongrowing NIH 3T3 cells, (a) Relative abundance of eIF-4E mRNA. Cytoplasmic RNA was extracted from NIH 3T3 cells (NIH) or P2 cells (P2), which were either untreated (C) or aphidicolin treated (A). These RNAs (10 μg) were analyzed by Northern blot hybridization with eIF-4E probe. The ∼5.0-kb transcript apparent in the transfected cells probably reflects readthrough of the polyadenylation signal in the eIF-4E cDNA and termination within the 3′ LTR of the Moloney murine leukemia virus sequence (Lazaris-Karatzas et al., 1990). The ethidium bromide-stained 28S rRNA served as an internal reference standard for showing that equal amounts of RNA were loaded on each lane, (b) eIF-4E protein levels. Cellular proteins (38 μg) from aphidicolin-treated (Aph) P2 cells (P2) and untreated NIH 3T3 cells (NIH) were analyzed by Western immunoblotting and detection by ECL as described in Materials and Methods. The bands representing eIF-4E and actin are indicated. (c) Phosphorylation state of eIF-4E. Cellular proteins (120 μg) from aphidicolin-treated (Aph) P2 cells (P2) and untreated NIH 3T3 cells (NIH) were analyzed by two-dimensional IEF/SDS-PAGE Western immunoblotting and detection by ECL as described in Materials and Methods. The sections of the gels containing actin as well as the phosphorylated (4E-P) and unphosphorylated (4E) forms of eIF-4E are shown in the autoradiograms. The relative position of these proteins and the direction of migration in each dimension are depicted in the scheme at the left. The relative abundance of eIF-4E is presented at the right of (b) and (c). It was determined by densitometric scanning of the respective bands in (b) and of the spots representing the phosphorylated and unphosphorylated forms of the protein in (c). The densitometric signals of eIF-4E were normalized to that of actin in the respective autoradiograms. The values obtained for the growing NIH 3T3 cells were used as a reference, which was arbitrarily set at 1.0, whereas those derived for the aphidicolin-treated P2 cells were normalized to the reference value.
NIH 3T3 Cells Transformed With eIF-4E-Expressing Gene Are Overproducing the Phosphorylated Form Even When Growth Arrested
If indeed the efficiency of translation of rp mRNA is dependent on the abundance of eIF-4E, then eliminating the decrease in the level of this protein below that present in growing cells should preclude the repression of the rp mRNAs upon growth arrest. To examine this hypothesis, we used a clone (P2) of transformed NIH 3T3/eIF-4E cells, which overproduces eIF-4E (Lazaris-Karatzas, 1992). The abundance of eIF-4E mRNA is between 50- to 80-fold higher in P2 cells than that in the parental NIH 3T3 cells (see C lanes in Fig. 2a and Lazaris-Karatzas, 1992).
The overexpression of eIF-4E in these cells has resulted in their ability to form foci on a mono-layer culture (Lazaris-Karatzas et al., 1990) and to grow in a serum-independent manner (Smith et al., 1990). Consequently, the proliferation of P2 cells can be neither arrested by contact inhibition nor by serum starvation. Nonetheless, treatment of these cells by aphidicolin for 24 h led to a complete cessation of cell growth and to an approximately fivefold decrease in the abundance of eIF-4E mRNA (see P2 lanes in Fig. 2a). It should be noted that the steady-state levels of rRNA decrease by twofold in nongrowing cells (Avni et al., 1994, and references therein). Hence, the abundance of eIF-4E mRNA in these cells based on loading of equal amounts of total RNA might be overestimated. Nevertheless, even after correction for this possible mistake, eIF-4E mRNA was still about five times more abundant in aphidicolin-treated P2 cells than in growing NIH 3T3 cells (compare the Aph lane in P2 cells with Con lane in NIH cells Fig. 2a).
Quantification by Western blot analysis and densitometric signals of the autoradiographic signals revealed that the level of eIF-4E (after normalization to the level of actin) in aphidicolin-treated P2 cells, though diminished, was still three times higher than that in exponentially growing parental cells (Fig. 2b,c).
The activity of eIF-4E appears to correlate with its phosphorylation status (Koromilas et al., 1992 and references therein). Hence, the excess of eIF-4E protein in P2 cells does not necessarily indicate that it is also preserved in its active form upon growth arrest. To directly examine this possibility, we performed two-dimensional IEF/PAGE analysis on cell lysates from parental and P2 cells, which were either exponentially growing or aphidicolin treated (Fig. 2c). Quantification of the autoradiographic signals by densitometric scanning and normalization to the level of actin indicated that the resting P2 cells contain a sixfold more phosphorylated eIF-4E than the exponentially growing parental cells.
Overexpression of Phosphorylatable eIF-4E Does Not Prevent the Repressed Translation of rp mRNAs in Nongrowing Cells
To examine the relationship between the level of phosphorylated eIF-4E and the translational control of rp mRNAs, we monitored the polysomal association of these mRNAs in P2 cells. The results, presented in Fig. 3, indicate that aphidicolin treatment of P2 cells selectively repressed the translation of rp mRNAs, similar to that observed in resting parental NIH 3T3 cells (Table 1 and aphidicolin + lanes in Fig. 3). Removal of the inhibitor led to a very efficient recruitment of the rp mRNAs into polysomes (see aphidicolin W lanes in Fig. 3). Similar recovery has been reported for serum-stimulated NIH 3T3 cells (Table 1) and regenerating rat liver (Aloni et al., 1992).
FIG. 3.

The translation of rp mRNAs is repressed upon growth arrest of eIF-4E-overexpressing cells. Cytoplasmic extracts from P2 cells that were either untreated (Con) or growth arrested (+) by 24-h treatment with either aphidicolin or hydroxyurea, or 24 h after withdrawal of the drug (W), were centrifuged through sucrose gradients and separated into polysomal (P) and subpolysomal (S) fractions. Poly(A)+ mRNA from equivalent aliquots of these fractions was analyzed by Northern blot hybridization with the probes indicated at the left. Because of variations in the amount of cytoplasmic extracts separated in each gradient and different exposure times for the + or W lanes, even for the same drug or the same probe, quantitative comparisons of the autoradiographic signal can be made only between the polysomal and subpolysomal fractions of the same gradient. The percentage of mRNA in polysomal fractions was assessed as described in Material and Methods, and the results presented at the right are an average of the number of experiments indicated in parentheses. The SEM in all experiments with three or more measurments was less than 10%. The lower band in actin-probed lane S of hydroxyurea-withdrawal cells is a contamination and not a fast running actin mRNA.
Our demonstration that the excess of eIF-4E, observed in aphidicolin-treated P2 cells, is present in its phosphorylated form, although suggestive, cannot be referred to as an ultimate evidence that its activity is indeed maintained. To more directly address this question, we exploited another growth inhibitor, hydroxyurea. It recently has been shown that the level of cyclin D1 protein is elevated in P2 cells, relative to the parental NIH 3T3 cells or cells transfected with a mutant eIF-4E. Moreover, P2 cells that cease to proliferate upon treatment with hydroxyurea still display accumulation of high levels of this unstable protein (Rosenwald et al., 1993). Nonetheless, despite this apparent augmented activity of eIF-4E in hydroxyurea-treated P2 cells, it failed to prevent the translational repression of rp mRNAs (Fig. 3, hydroxyurea + lanes). Normal translation of rp mRNAs was resumed, however, upon withdrawal of the inhibitor (Fig. 3, hydroxyurea W lanes). Consequently, it appears that overexpression of active eIF-4E cannot relieve the repressed translation of rp mRNAs regardless of the drug used for the growth arrest.
The Translation of 5′ TOP-Containing and -Lacking mRNAs Is Similarly Inhibited by a Cap Analogue
Our model, implying a key role for the cap binding protein in the selective translational control of rp mRNAs, assumes a lower affinity of 5′ TOP-containing mRNAs to the cap binding protein. To examine this supposition we monitored the effect of the cap analogue m7G(5′)ppp(5′)G on the efficiency of in vitro translation of mRNAs with various 5′ termini. To ensure the authenticity of the structure of the 5′ end of the tested mRNAs (as reflected in the transcription initiation site and the extent of capping), we exploited total poly(A)+ RNA from transfected NIH 3T3 cells constitutively overexpressing human growth hormone (hGH) mRNAs with different 5′ termini. The detailed structure of these termini was established by primer extension analysis (Avni et al., 1994). Radioimmunoassay of the hGH produced by translation of these RNAs in rabbit reticulocyte lysate reveals a linear relationship with the amount of total poly(A)+ RNA used (up to 100 ng), as exemplified in Fig. 4a. We selected two clones expressing hGH mRNA, shown to be refractory to growth-dependent translational control [Act(73)-GH and S16CM3-GH] and two clones expressing 5′ TOP-containing hGH mRNAs, which are translationally controlled [S16wt(1–29)-GH and L13a-GH] (Avni et al., 1994). Furthermore, these mRNAs are clearly distinct in the structure of their 5′ termini (see respective sequences in Fig. 4b and c). Clearly, members of each of these groups exhibit similar sensitivity to the inhibitory effect of the cap analogue, and this sensitivity coincides with that of the total poly (A)+ RNA (compare solid to dashed lines in Fig. 4b and c). Hence, it appears that the presence of a 5′ TOP does not diminish the competitive potential of an mRNA for the cap binding protein and thus might suggest a similar affinity for this protein.
FIG. 4.

The effect of the cap analogue, m7G(5′)ppp(5′)G, on the translation efficiency of 5′ TOP-containing and -lacking mRNAs. (a) Dependence of the amount of hGH synthesized in rabbit reticulocyte lysate on the amount of total poly(A)+ RNA used in the translation system. Increasing amounts of total poly(A)+ RNA from NIH 3T3 cells overexpressing S16wt(1–29)-GH were translated in reticulocyte lysate and the amount of hGH synthesized was measured by radioimmunoassay, as described in Materials and Methods. The conversion of radioactivity data into mass was based on radioimmunoassay of hGH standards. (b,c) The effect of increasing concentrations of the cap analogue, m7G(5′)ppp(5′)G, on the translation efficiency of total proteins and hGH mRNA with various 5′ termini. Poly(A)+ RNA (100, 20, 45, and 100 ng) from NIH 3T3 cell lines expressing mRNA encoding: Act(73)-GH (Actin), S16CM3-GH (CM3), S16wt(1–29)-GH (rpS16), and L13a-GH (rpL13a) (Avni et al., 1994; Levy et al., 1991), respectively, were translated in rabbit reticulocyte lysate in the absence or presence of increasing concentrations of the cap analogue. The synthesis of total proteins (dashed line) was monitored by measuring the incorporation of [35S]methionine into trichloroacetic acid-precipitable material and represents an average of numerous experiments. The amount of the hGH synthesized (solid lines) was monitored by radioimmunoassay. In both cases, the results were normalized to the value obtained in the absence of cap analogue and are presented as averages ± SEMs of at least three independent experiments. The reference values were set at 100% and they represent 23, 70, 60, and 80 pg of hGH produced during 90-min incubation with poly(A)+ RNAs listed above, respectively. The variation in the level of synthesized hGH reflects primarily the difference in the abundance of hGH mRNA in each RNA preparation. The sequences depicted in the figure represent the 5′ terminal sequences of the respective transcripts (Avni et al., 1994).
DISCUSSION
Growth-Dependent Translational Control of rp mRNAs in MEL Cells and in NIH 3T3 Fibroblasts
In the present report we have demonstrated that the translation of rp mRNAs is selectively repressed in cells for which growth is arrested by a variety of means, including: chemically induced differentiation, serum starvation, contact inhibition, and chemical inhibition of DNA replication. Taken together, these results and those previously reported (Avni et al., 1994 and references therein) suggest that the growth-dependent translational control of rp mRNAs is a general mechanism established in most mammalian cells examined so far, and operative irrespective of the means used to manipulate the cellular growth status.
Interestingly, three mRNAs have been previously characterized as predominantly stored in untranslated mRNP particles in MEL cells (Yenofsky et al., 1983). Two of them [P40, which was identified as laminin receptor-like protein (Auth and Brawerman, 1992), and P21], although encoding non-r-proteins, were shown to be translationally repressed upon differentiation of MEL cells (Yenofsky et al., 1983). However, the third mRNA encoding P36, which has been identified as ribosomal protein P0 (Krowczynska et al., 1989), was largely untranslated, even in growing MEL cells, and was not further repressed following differentiation (Yenofsky et al., 1983). Hence, the translational behavior in MEL cells of rpP0 mRNA differs noticeably from that of the mRNAs encoding rpS16 and rpL30 monitored in the present experiments. The reason for the distinctive translational properties of rpP0 mRNA is not known, yet they are most probably not attributable to either the nature of the encoded protein (acidic phosphoprotein, in contrast to the basic S16 and L30) or to the structure of its 5′ terminus. This is evident by the fact that rpP2 mRNA, which also encodes an acidic phosphoprotein, is translationally regulated in a growth-dependent manner (Aloni et al., 1992; Meyuhas et al., 1990) and that rpP0 mRNA possesses a typical 5′ TOP (Krowczynska et al., 1989).
Overexpression of eIF-4E Does Not Relieve the Repressed Translation of rp mRNAs in Nongrowing Cells
Growth arrest has been shown to be accompanied by downregulation of genes encoding various initiation factors. These include about a threefold reduction in the abundance of the mRNAs encoding eIF-4A, eIF-2α, and eIF-4D in dexamethasone-treated P1798 lymphosarcoma cells (Huang and Hershey, 1989) or those encoding eIF-4E and eIF-4A in the developing liver (Aloni et al., 1992). In the present report we demonstrated that the abundance of eIF-4E mRNA is modulated, like the translation efficiency of rp mRNAs, in a growth-dependent manner. Moreover, the steady-state level of eIF-4E protein is about two- and fourfold lower in nongrowing P1798 cells or NIH 3T3 cells, respectively, in comparison to its level in these cells when exponentially growing (Fig. 1c and S. Shama and O. Meyuhas, unpublished results).
The selective unloading of ribosomes from rp mRNAs upon cessation of growth and the rapid recruitment of these mRNAs into polysomes following growth stimulation clearly indicate that these mRNAs are translationally regulated at the initiation step (Meyuhas et al., 1987). Hence, it is conceivable that fluctuations in the expression of genes encoding the corresponding factors and particularly the limiting one, eIF-4E, might affect the translation initiation of a subset of highly susceptible mRNAs like rp mRNAs. Indeed, it has been previously shown that increasing the amount of eIF-4F or eIF-4E stimulates the translation of translationally inefficient mRNAs. Thus, the translation of endogenous α-globin mRNA is relatively repressed in rabbit reticulocyte lysate, unless the lysate is supplemented with eIF-4F (Sarkar et al., 1984). Similarly, overexpression of exogenous eIF-4E in retinoblastoma RB355, which contain low levels of endogenous eIF-4E, enhanced the translation of ornithine aminotransferase, which was otherwise selectively repressed (Fagan et al., 1991). Finally, overexpression of eIF-4E relieved the selective translational repression of mRNAs bearing extensive secondary structure in their 5′ untranslated region (Koromilas et al., 1992). In contrast, our results have clearly demonstrated that the efficiency of translation of rp mRNAs, which contain short unstructured 5′ UTR, is regulated independently of the level, the phosphorylation state, or the activity of eIF-4E.
Our results negate, in addition, another fundamental assumption of our initial model, namely the preferential lower competitive potential of translationally controlled mRNAs for the cap binding protein. This has been demonstrated by the fact that translation in reticulocyte lysate of mRNAs subject or refractory to growth-dependent translational control is inhibited to the same extent by the cap analogue m7G(5′)ppp(5′)G. This observation is inconsistent with that previously made by Hammond et al., who suggested that translation of rp mRNA in reticulocyte lysate is preferentially inhibited by m7GDP (Hammond et al., 1991). The discrepancy between these two observations does not seem to reflect the difference between the analogues, as m7GDP and dinucleotides containing m7G have been previously shown to exert a similar translational inhibition, at least in the wheat germ cell-free system (Hickey et al., 1977). Nevertheless, it might reflect several dissimilarities in the experimental design: a) in the present work translation was assessed by direct measurement of the protein products, as opposed to the indirect assessment conducted in the previous one; b) being aware of the variability in these type of experiments, we based our conclusion on multiple measurements with two different 5′ TOP-containing mRNAs and two concentrations of the cap analogue, as opposed to a single rp mRNA species and a single concentration of the cap analogue used in the previous publication.
Possible Involvement of a Specific Trans-Acting Factor in the Translational Control of rp mRNAs
We cannot formally exclude the possibility that the translation efficiency of these mRNAs is determined by the activity of a single or a combination of other translation factors or components of the translational apparatus. One such candidate is the rpS6, which is phosphorylated as a result of stimulation of a variety of cells by mitogenic agents (Erikson, 1991 and references therein). The tight correlation between the phosphorylation state of rpS6 and the translation efficiency of 5′ TOP-containing mRNAs, together with the localization of rpS6 within the mRNA binding site in the ribosome (Bommer et al., 1980) and the fact that EF-1α mRNA partially undergos shift into lighter polysomes upon growth arrest (Jefferies et al., 1994b), have led Thomas and his colleagues to propose that rpS6 phosphorylation increases the affinity of ribosomes to 5′ TOP-containing mRNAs and thus facilitates their initiation (Jefferies et al., 1994b; Thomas and Thomas, 1986). Moreover, pretreatment of Swiss 3T3 cells with the immunosuppressant rapamycin, which selectively blocks the activation of the 70 kDa S6 kinase and rpS6 phosphorylation (Chung et al., 1992; Price et al., 1992), also represses the translation of 5′ TOP-containing mRNAs with little effect on global protein synthesis (Jefferies et al., 1994a).
Notably, different lines of circumstantial evidence suggest that a specific factor might be involved in this selective regulatory mechanism: a) Close inspection of the polysomal profiles of rp mRNAs in lymphosarcoma cells does not reveal a gradual shift of these mRNAs into lighter polysomes upon growth arrest, as would be expected if the translational repression results of a diminished initiation rate due to a relative deficiency in initiation factor(s) or dephosphorylation of rpS6. Instead, the majority of the rp mRNAs are totally excluded from polysomes in resting cells (Meyuhas et al., 1987, 1990). Moreover, most of the rp mRNAs, still associated with polysomes in these cells, are translated by the approximate theoretical maximum number of ribosomes (Agrawal and Bowman, 1987; Meyuhas et al., 1987, 1990). b) Xenopus rp mRNAs are not only characterized by the typical 5′ TOP, but also conform growth-dependent translational control when expressed in mammalian cells (Avni et al., 1994). However, unlike the repressed translation of rp mRNAs in resting mammalian cells, that of Xenopus is also inhibited during early embryogenesis under conditions of extremely rapid proliferation and extensive protein synthesis (Amaldi and Pierandrei-Amaldi, 1990). It is highly unlikely, therefore, to simply ascribe the selective translational repression of rp mRNAs, in the developing Xenopus embryo, to a temporary deficiency of one or more general translational factors, c) The 5′ TOP-containing mRNAs in nongrowing cells seem to be stored unmodified, yet in a repressed form in the mRNP particles (Thomas and Thomas, 1986; Hammond et al., 1991). d) Recently, Slobin and Rao (1993) have shown that a salt wash of RNP prepared in vitro contains a factor(s) that selectively repressed the translation in vitro of EF-1α mRNA. Taken together, these observations support the notion that translational repression of 5′ TOP-containing mRNAs in quiescent mammalian cells, or during early developmental stages of Xenopus, is associated with fluctuations in the amount or activity of a specific translational trans-acting factor(s), and possibly in combination with an as yet unidentified general component of the translational machinery.
ACKNOWLEDGEMENTS
We thank Dr. I. G. Wool for the rat rpS4 cDNA. This research was supported by grants to O. M. from The Council for Tobacco Research U.S.A, The Basic Research Foundation administered by The Israel Academy of Sciences and Humanities, and from the Israeli Ministry of Health.
REFERENCES
- Agrawal A. G. and Bowman L. H. (1987), Biol Chem 262, 4868–4875. [PubMed] [Google Scholar]
- Aloni R., Peleg D., and Meyuhas O. (1992), Mol Cell Biol 12, 2203–2212. [DOI] [PMC free article] [PubMed] [Google Scholar]
- Amaldi F. and Pierandrei-Amaldi P. (1990), Enzyme 44, 93–105. [DOI] [PubMed] [Google Scholar]
- Auth D. and Brawerman G. (1992), Proc Natl Acad Sci USA 89, 4368–4372. [DOI] [PMC free article] [PubMed] [Google Scholar]
- Avni D., Shama S., Loreni F., and Meyuhas O. (1994), Mol Cell Biol 14, 3822–3833. [DOI] [PMC free article] [PubMed] [Google Scholar]
- Bommer U.-A., Noll F., Lutsch G., and Bielka H. (1980), FEBS Lett 111, 171–174. [DOI] [PubMed] [Google Scholar]
- Cavanaugh A. H. and Thompson E. A. (1983), J Biol Chem 258, 9768–9773. [PubMed] [Google Scholar]
- Chitpatima S. T., Makrides S., Bandyopadhyay R., and Brawerman G. (1988), Nucleic Acids Res 16, 2350. [DOI] [PMC free article] [PubMed] [Google Scholar]
- Chung J., Kuo C. J., Crabtree G. R., and Blenis J. (1992), Cell 69, 1227–1236. [DOI] [PubMed] [Google Scholar]
- De Benedetti A., Joshi-Barve S., Rinker-Schaeffer C., and Rhoads R. E. (1991), Mol Cell Biol 11, 5435–5445. [DOI] [PMC free article] [PubMed] [Google Scholar]
- De Benedetti A. and Rhoads R. E. (1990), Proc Natl Acad Sci USA 87, 8212–8216. [DOI] [PMC free article] [PubMed] [Google Scholar]
- Duncan R., Milburn S. C., and Hershey J. W. B. (1987), J Biol Chem 262, 385–388. [PubMed] [Google Scholar]
- Erikson R. L. (1991), J Biol Chem 266, 6007–6010. [PubMed] [Google Scholar]
- Fagan R., Lazaris-Karatzas A., Sonenberg N., and Rosen R. (1991), J Biol Chem 262, 380–388. [PubMed] [Google Scholar]
- Frederickson R., Montine K. S., and Sonenberg N. (1991), Mol Cell Biol 11, 2896–2900. [DOI] [PMC free article] [PubMed] [Google Scholar]
- Gayathri Devi K. R., Chan Y., and Wool I. W. (1989), Biochim Biophys Acta 1008, 258–262. [DOI] [PubMed] [Google Scholar]
- Geyer P. K., Meyuhas O., Perry R. P., and Johnson L. F. (1982), Mol Cell Biol 2, 685–693. [DOI] [PMC free article] [PubMed] [Google Scholar]
- Hammond M. L., Merrick W., and Bowman L. H. (1991), Genes Dev 5, 1723–1736. [DOI] [PubMed] [Google Scholar]
- Hickey E. D., Weber L. A., Baglioni C., Kim C. H., and Sarma R. H. (1977), J Mol Biol 109,173–183. [DOI] [PubMed] [Google Scholar]
- Hiremath L. S., Webb N. R., and Rhoads R. E. (1985), J Biol Chem 260, 7843–7849. [PubMed] [Google Scholar]
- Huang S. and Hershey J. B. (1989), Mol Cell Biol 9, 3679–3684. [DOI] [PMC free article] [PubMed] [Google Scholar]
- Jaramillo M., Pelletier J., Edery I., Nielsen P. J., and Sonenberg N. (1991), J Biol Chem 266, 10446–10451. [PubMed] [Google Scholar]
- Jefferies H. B., Reinhard C., Kozma S. C., and Thomas G. (1994a), Proc Natl Acad Sci USA 91, 4441–4445. [DOI] [PMC free article] [PubMed] [Google Scholar]
- Jefferies H. B., Thomas G., and Thomas G. (1994b), J Biol Chem 269, 4367–4372. [PubMed] [Google Scholar]
- Kaspar R. L., Rychlik W., White M. W., Rhoads R. E., and Morris D. R. (1990), J Biol Chem 265, 3619–3622. [PubMed] [Google Scholar]
- Konkel P. A., Tilghman S., and Leder P. (1978), Cell 5, 1125–1132. [DOI] [PubMed] [Google Scholar]
- Koromilas A. E., Lazaris-Karatzas A., and Sonenberg N. (1992), EMBO J 11, 4153–4158. [DOI] [PMC free article] [PubMed] [Google Scholar]
- Krowczynska A. M., Coutts M., Makrides S., and Brawerman G. (1989), Nucleic Acids Res 17, 6048. [DOI] [PMC free article] [PubMed] [Google Scholar]
- Lazaris-Karatzas A., Smith M. R., Frederickson R. M., Jaramillo M. L., Liu Y., Kung H., and Sonenberg N. (1992), Genes Dev 6, 1631–1642. [DOI] [PubMed] [Google Scholar]
- Lazaris-Karatzas A., Montine K. S., and Sonenberg N. (1990), Nature 304, 596–602. [DOI] [PubMed] [Google Scholar]
- Lazaris-Karatzas A. and Sonenberg N. (1992), Mol Cell Biol 12, 1234–1238. [DOI] [PMC free article] [PubMed] [Google Scholar]
- Levy S., Avni D., Hariharan N., Perry R. P., and Meyuhas O. (1991), Proc Natl Acad Sci USA 88, 3319–3323. [DOI] [PMC free article] [PubMed] [Google Scholar]
- Makrides S., Chitpatima S. T., Bandyopadyhyay R., and Brawerman G. (1988), Nucleic Acids Res 16, 2349. [DOI] [PMC free article] [PubMed] [Google Scholar]
- Marks P. A., Sheffery M., and Rifkind R. A. (1987), Cancer Res 47, 659–666. [PubMed] [Google Scholar]
- Meyuhas O., Baldin V., Bouche G., and Amalric F. (1990), Biochim Biophys Acta 1049, 38–44. [DOI] [PubMed] [Google Scholar]
- Meyuhas O. and Perry R. P. (1980), Gene 10, 113–127. [DOI] [PubMed] [Google Scholar]
- Meyuhas O., Thompson A. E., and Perry R. P. (1987), Mol Cell Biol 7, 2691–2699. [DOI] [PMC free article] [PubMed] [Google Scholar]
- Minty A. J., Caravatti M., Robert B., Cohen A., Daubas P., Weydert A., Gross F., and Buckingham M. E. (1981), J Biol Chem 256, 1008–1014. [PubMed] [Google Scholar]
- O’Farrell P. H. (1975), J Biol Chem 250, 4007–4021. [PMC free article] [PubMed] [Google Scholar]
- Perry R. P. and Meyuhas O. (1990), Enzyme 44, 83–92. [DOI] [PubMed] [Google Scholar]
- Price D. J., Grove J. R., Calvo V., Avruch J., and Bierer B. E. (1992), Science 257, 973–977. [DOI] [PubMed] [Google Scholar]
- Ray B. K., Brendler T. G., Adya S., Daniels-McQueen S., Miller J. K., Hershey J. W. B., Grifo J. A., Merrick W. C., and Thach R. E. (1983), Proc Natl Acad Sci USA 80, 663–667. [DOI] [PMC free article] [PubMed] [Google Scholar]
- Rhoads R. E. (1988), Trends Biochem Sci 13, 52–56. [DOI] [PubMed] [Google Scholar]
- Rosenwald I. B., Lazaris-Karatzas A., Sonenberg N., and Schmidt E. V. (1993), Mol Cell Biol 13, 7358–7363. [DOI] [PMC free article] [PubMed] [Google Scholar]
- Rozen F., Edery I., Meerrovitch K., Dever T. E., Merrick W. C., and Sonenberg N. (1990), Mol Cell Biol 10, 1134–1144. [DOI] [PMC free article] [PubMed] [Google Scholar]
- Rychlik W., Russ M. A., and Rhoads R. E. (1987), J Biol Chem 262, 10434–10437. [PubMed] [Google Scholar]
- Sarkar G., Edery I., Gallo R., and Sonenberg N. (1984), Biochim Biophys Acta 783, 122–129. [DOI] [PubMed] [Google Scholar]
- Shaw P. H., Carneiro M., and Schibler U. (1984), Gene 29, 77–85. [DOI] [PubMed] [Google Scholar]
- Slobin L. I. and Rao M. N. (1993), Eur J Biochem 213, 919–926. [DOI] [PubMed] [Google Scholar]
- Smith M. R., Jaramillo M., Liu Y.-L., Dever T. E., Merrick W. C., Kung H. F., and Sonenberg N. (1990), New Biol 2, 648–654. [PubMed] [Google Scholar]
- Sonenberg N. (1988), Prog Nucleic Acid Res Mol Biol 35, 173–207. [DOI] [PubMed] [Google Scholar]
- Spadari S., Sala F., and Pedrali-Noy G. (1982), Trends Biochem Sci 7, 29–32. [Google Scholar]
- Thomas G. and Thomas G. (1986), J Cell Biol 103, 2137–2144. [DOI] [PMC free article] [PubMed] [Google Scholar]
- Uetsuki T., Naito A., Nagata S., and Kaziro Y. (1989), J Biol Chem 264, 5791–5798. [PubMed] [Google Scholar]
- Walden W. E., Godefrog-Colburn T., and Thach R. E. (1981), J Biol Chem 256, 11739–11746. [PubMed] [Google Scholar]
- Wiedemann L. M. and Perry R. P. (1984), Mol Cell Biol 4, 2518–2528. [DOI] [PMC free article] [PubMed] [Google Scholar]
- Yenofsky R., Careghini S., Krowczynska A., and Brawerman G. (1983), Mol Cell Biol 3, 1197–1203. [DOI] [PMC free article] [PubMed] [Google Scholar]