

Abstract
The E2F transcription factor can regulate expression of numerous cellular genes controlling proliferation, including proto-oncogenes and genes regulating cell cycle progression. Therefore, genes comprising the E2F gene family could potentially contribute to carcinogenesis. To test the potential of E2F to act as a transforming gene, a cDNA encoding E2F-1 was constitutively overexpressed in established rodent cells using a retroviral vector. Overexpressed E2F-1 was functional, as shown by stimulation of a transfected adenovirus E2 promoter driving a chloramphenicol acetyltransferase reporter gene in E2F-1 overexpressing cells. This stimulation was dependent on functional E2F binding sites in the promoter. Examination of phenotype showed that E2F-1 overexpression mediated cell transformation as measured by the ability of cells to form colonies in soft agar medium. In addition, overexpressed E2F-1 shortened the duration of the G1 cell cycle phase in proliferating cells, a property characteristic of other transforming genes. These data provide direct evidence that E2F-1 can act as a transforming gene and a critical regulator of cell cycle progression and suggest the possibility of E2F involvement in carcinogenesis.
Keywords: Cell cycle, E2F, Oncogenes, Transcription factors, Transformation
THE identity of genes whose products contribute to cellular transformation and carcinogenesis remains largely unknown. Members of the E2F family of transcription factors, however, display certain characteristics of known oncogenes (La Thangue, 1994; Nevins, 1992). For example, E2F activates the transcription of several cellular genes: dihydrofolate reductase, DNA polymerase α, p34cdc2, B-myb, and c-myc (Dalton, 1992; Hamel et al., 1992; La Thangue, 1994; Lam and Watson, 1993; Means et al., 1992; Nevins, 1992; Pearson et al., 1991), all of which play an important role in DNA synthesis and cell proliferation. Second, E2F forms a number of distinct complexes containing proteins critical for proper cell cycle progression. Among these complexed proteins are the retinoblastoma (pRb) antioncogene product (Chellappan et al., 1991; Chittenden et al., 1991) and two related molecules, p107 (Cao et al., 1992; Schwarz et al., 1993) and p130 (Cobrinik et al., 1993); cyclins A and E (Lees et al., 1992; Mudryj et al., 1991; Shirodkar et al., 1992) and the cyclin-dependent kinase, p33cdk2 (Devoto et al., 1992). The presence of these complexes fluctuates during the cell cycle (Cobrinik et al., 1993; Shirodkar et al., 1992) and, because it is likely that the proteins associated with E2F regulate its transactivation function (Flemington et al., 1993; Helin et al., 1993a; Krek et al., 1994), they may play an important role in cell cycle control. Finally, a recent report, showing that microinjection of the E2F-1 gene into quiescent cells can drive them into S phase of the cell cycle, demonstrates the ability of E2F to directly initiate cell cycle progression (Johnson et al., 1993). Together, these data establish E2F as an important mediator of cell growth. Therefore, it seemed likely that unregulated expression of E2F could lead to cell transformation.
The hypothesis that E2F is involved in carcinogenesis would be strengthened if it were possible to show that the protein could lead to a phenotype equivalent to malignancy in cultured cells. Therefore, we attempted to overexpress one member of the E2F family, E2F-1, in established rodent cells using a retroviral vector. The data in this article show that E2F-1 could be successfully overexpressed in cells and that the overexpressed E2F-1 protein was functional as measured by its ability to transactivate the adenovirus E2 promoter. E2F-1 overexpressing cells were transformed as measured by their ability to form colonies in soft agar medium (i.e., anchorage-independent growth). Overexpression of E2F-1 also shortened the duration of the G1 cell cycle phase in proliferating cells, a property of other cell cycle regulators and oncogenes. The data presented in this article show that E2F-1 can be stably overexpressed in rodent fibroblasts and provide direct evidence that E2F-1 is a transforming gene, supporting the notion that E2F gene family members may be involved in carcinogenesis.
MATERIALS AND METHODS
Cells and Viruses
Ψ-CRE and Ψ-CRIP (Danos and Mulligan, 1988), Balb/3T3 clone A31 (Aaronson and Todaro, 1968), C3H10T1/2 (Reznikoff et al., 1973), and 3T3 clone 4 cells were used in these experiments. The 3T3 clone 4 cell line was derived by us from a single clone of NIH 3T3 cells (Jainchill et al., 1969) that, by microscopic observation, appeared morphologically flat and more contact inhibited than the parent cells. These cells were grown as previously described (Sladek and Jacob-berger, 1990) in Dulbecco modified Eagle medium (DMEM) supplemented with 5% (v/v) fetal bovine serum and 5% calf serum. Retroviral vectors pX17 (Sladek and Jacobberger, 1992a) and Linker Neo CMV E2F were used. Linker Neo CMV E2F is identical to Linker CMV T (Sladek and Jacobberger, 1992b) except that the large T antigen gene from simian virus 40 was replaced by a cDNA encoding E2F-1 (Helin et al., 1992). Infectious virus was produced from retroviral vector DNAs by transfecting Ψ-CRIP cells and infecting Ψ-CRE cells with medium collected from the transfected cells (Sladek and Jacobberger, 1992b). Ψ-CRE cells were selected in 400 μg G418 per ml of medium as described previously (Sladek and Jacobberger, 1992a). Retrovirus-containing medium was collected from Ψ-CRE cells and used to infect target cells as previously described (Sladek and Jacobberger, 1990). These infected target cells were selected in G418 as above. Pools of at least 100 individual clones for each cell line were used in all experiments.
Cell Cycle Inhibitors
Nocodazole {methyl[5-(2-thienyl-carbonyl)-1H-benzimidazole-2-yl]-carbamate; Sigma, St. Louis, MO} was prepared as described (Chackalaparampil and Shalloway, 1988) and added to cells at a final concentration of 2 μg per ml of medium.
Immunoblotting
Nearly confluent dishes of cells were washed with sterile Tris-buffered saline [TBS; 10 mM Tris (pH 8.0), 50 mM NaCl], then lysed by addition of 1 ml of lysis buffer [50 mM Tris (pH 8.0), 5 mM EDTA, 150 mM NaCl, 0.5% Nonidet P-40, 1 mM phenylmethylsulfonyl fluoride, and 0.01 mg of aprotinin per ml] (Kierstead and Tevethia, 1993) to the cell monolayer. Cells were scraped from the substrate into microfuge tubes and incubated on ice for 30 min with inversion. Lysed cells were centrifuged at 11,150 × g for 10 min at 4°C to remove cell debris. Protein in the supernatant was determined using the BCA Protein Assay Kit (Pierce, Rockford, IL). To 10 μg of protein was added one-sixth the total volume of loading buffer [48 mM Tris (pH 6.8), 18.5% sodium dodecyl sulfate, 3.94 M β-mercaptoethanol, 31% glycerol, and 3% bromophenol blue] and the mixture was boiled for 3 min. Proteins were analyzed by SDS-polyacrylamide electrophoresis using 12.5% gels (Laemmli, 1970).
Proteins were transferred from the gel to Hybond ECL membranes (Amersham, Arlington Heights, IL) using a Hoefer (San Francisco, CA) TE Series Transphor Unit. Membranes were blocked at room temperature on a shaking platform with wash buffer (0.1% Tween-20 in TBS) containing 5% dehydrated lowfat milk for 45 min and then for 45 min in wash buffer containing 1% lowfat milk and 1% bovine serum albumin. The membranes were rinsed in wash buffer and then incubated with 0.4 μg of C-20 rabbit anti-E2F-1 polyclonal antibody (Santa Cruz Biotechnology, Santa Cruz, CA) per ml of wash buffer containing 5% lowfat milk for 2 h. The membranes were washed four times in wash buffer as before and then incubated with a 1 : 2000 dilution of donkey anti-rabbit secondary antibody-HRP (Amersham) in wash buffer containing 5% lowfat milk for 1 h. The membranes were washed three times as before in wash buffer with the wash buffer in the last wash containing no Tween-20. Equal volumes of ECL detection reagents 1 and 2 (Amersham) were mixed and added to the membranes for 1 min. The membranes were then immediately exposed to Hyperfilm-ECL (Amersham). E2F-1 band intensity on the autoradiographs was quantified using an LKB 2202 UltroScan Laser Densitometer (Bromma, Sweden).
Chloramphenicol Acetyltransferase Assays
A procedure given to us by Dr. Ronald Reichel (Jacob et al., 1994) for chloramphenicol acetyl-transferase (CAT) assays was modified and used as described below. Briefly, cells were plated on the day before transfection at 5 × 10⁵ cells per 10-cm dish. Transfections were done using the calcium phosphate method (Ausubel et al., 1987). E2-CAT transfection constructs were pE2 wt CAT and pE2 (−64/60, −45/36) CAT (Loeken and Brady, 1989) as the plasmids containing wild-type and mutant E2 promoters, respectively. E2-CAT DNAs (15 μg) were transfected along with 2 μg of pSV-β-galactosidase (Promega, Madison, WI) as a control for transfection efficiency. Cells were harvested 36 h after transfection using 5x Reporter Lysis Buffer from a commercially available β-galactosidase Enzyme Assay System (Promega) and cell extracts were made using the conditions described by the manufacturer. Extracts were assayed for (β-galactosidase activity. Subsequently, volumes of extract corresponding to equivalent amounts of β-galactosidase activity were assayed for CAT activity as described (Ausubel et al., 1987; Jacob et al., 1994). After separation of the differentially acetylated forms of chloramphenicol on silica gel plates, spots containing monoacetylated [14C]chloramphenicol were identified using the autoradiograph as a template and cut out of the silica gel plate (Ausubel et al., 1987). These spots were counted by liquid scintillation counting to determine CAT activity of the transfected cells.
Soft Agar Assays
Five thousand cells were plated in 1 ml of top agar composed of DMEM supplemented as described above and containing 0.38% Noble agar. This suspension was seeded into 35-mm diameter dishes over a 2-ml layer of solidified bottom agar containing DMEM and 0.5% Noble agar. Dishes were maintained at 37 °C in a humidified 5% CO2 atmosphere. After 3 weeks, colonies were either photographed or counted. For photomicrographs, dishes were stained with p-ionitrotetrazolium violet (Jat et al., 1986) and photographed. For counting, colonies were visualized with a microscope using low-power magnification and those greater than 50 μm in diameter were counted. Six microscope fields per dish were counted and used to calculate the total number of colonies on the entire dish. Colony counts were obtained from at least nine dishes per cell line and the data are expressed as the means of counts from these dishes.
Flow Cytometry
To analyze cellular DNA content, cells were fixed in cold methanol, treated with RNase, and stained with propidium iodide (Jacobberger et al., 1986). Cell analysis was performed using a Coulter EPICS 751 flow cytometer (Coulter Electronics, Miami, FL). Excitation used the 488-nm line of an argon laser operating at 100 mW. Red fluorescence was collected above 570 nm. A doublet discriminator (peak vs. integrated red signal) was used as the primary gate to eliminate cell aggregates. Red fluorescence was displayed on a linear scale. The fraction of the total cell population present in each of the G1, S, and G2 + M cell cycle phases was obtained from DNA histograms by mathematical modeling (Dean, 1987) using MPLUS software (Phoenix Flow Systems, San Diego, CA) (Sladek and Jacobberger, 1992b).
RESULTS
Overexpression of E2F-1 in Rodent Cells
To overexpress the E2F-1 gene in cells, a recombinant retroviral vector encoding the gene, called Linker Neo CMV E2F, was constructed (Fig. 1). In this vector, transcription of a cDNA encoding E2F-1 (Helin et al., 1992) was driven by a human cytomegalovirus immediate early promoter (Boshart et al., 1985). This vector also contained a neomycin phosphotransferase (Neo) gene encoding resistance to the drug G418. Transcription of the Neo gene was driven by the 5′ long terminal repeat of the virus. Because the vector encoded both the Neo and E2F-1 genes, cells infected with virus produced from this construct and selected in G418 would be expected to express the viral-encoded E2F-1 gene.
FIG. 1.
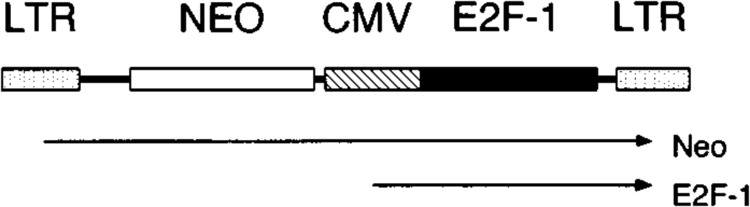
Recombinant retrovirus encoding E2F-1. The Linker Neo CMV E2F retrovirus is pictured. LTR indicates long terminal repeat, NEO indicates neomycin resistance gene, and CMV indicates human cytomegalovirus early promoter. Arrows below the construct indicate transcripts that encode either E2F-1 or neomycin phosphotransferase (Neo) proteins.
To produce infectious virus, the recombinant plasmid encoding Linker Neo CMV E2F was transfected into Ψ-CRIP amphotropic packaging cells (Danos and Mulligan, 1988). Two days later, virus-containing medium was collected from these cells and used to infect Ψ-CRE ecotropic packaging cells (Danos and Mulligan, 1988). Infected Ψ-CRE cells were selected in medium containing G418. Individual clones were pooled and cell extracts for immunoblotting analysis were made from the pooled clones. The extracts were tested for levels of E2F-1 protein in immunoblotting experiments using an E2F-1-specific polyclonal antibody as described in Materials and Methods. The E2F-1-specific antibody detected increased expression in infected cells of at least three E2F-1 proteins that cluster around 60 kDa molecular weight compared to noninfected cells (Fig. 2A). The E2F-1 triplet is also seen in control, uninfected cells after longer exposure of the autoradiographs (Fig. 2B).
FIG. 2.
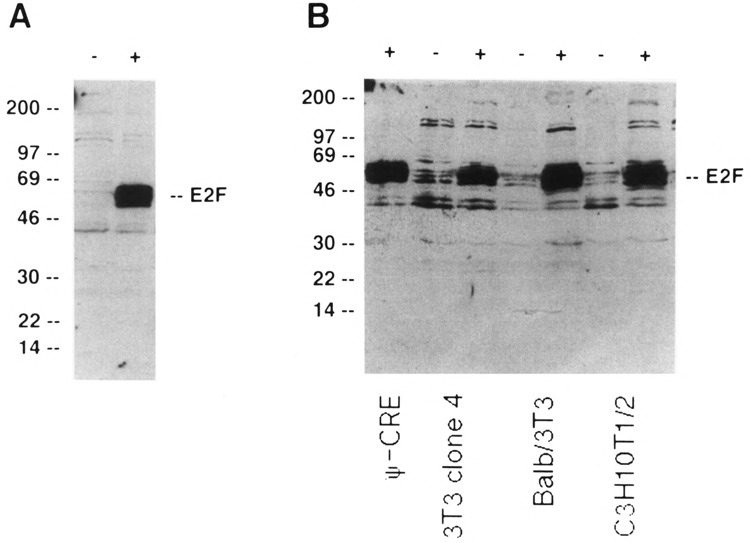
Constitutive overexpression of E2F-1 in established rodent cells. (A) Immunoblot detection of E2F-1 in infected and uninfected Ψ-CRE cells. Ψ-CRE cells (−) and Ψ-CRE cells infected with the Linker Neo CMV E2F retrovirus (+) are shown. The positions of molecular size markers (in kDa) are shown on the left. The position of the E2F-specific band is shown on the right. (B) Immunoblot detection of E2F-1 in infected and uninfected 3T3 clone 4, Balb/3T3 clone A31, and C3H10T1/2 cells. Identity of the cells is designated on the bottom of the autoradiograph. Control cells without virus (−) and cells infected with Linker Neo CMV E2F virus (+) are shown. The positions of molecular size markers and E2F-specific bands are as in (A).
To determine whether E2F-1 could be overexpressed in cells other than Ψ-CRE, virus collected from the pooled Ψ-CRE cells was used to infect three established murine fibroblast lines: Balb/3T3 clone A31, C3H10T1/2, and 3T3 clone 4 cells. Infected cells were selected in G418, pooled, and used to make extracts for immunoblotting analysis as above. Infected cells from all three cell lines overexpressed E2F-1 protein (Fig. 2B). Again, multiple overexpressed E2F-1-specific bands were identified by the antibody. Densitometry showed that levels of E2F-1 expression in these cells were increased from 20- to 30-fold compared to control cells, except in the case of the 3T3 clone 4 cell pool. In the 3T3 clone 4 pool (shown in Fig. 2B), the increase in E2F-1 expression was approximately 10-fold compared to control cells. Therefore, these data show that it was possible to significantly overexpress E2F-1 protein in established rodent cells.
Transcriptional Activity of Overexpressed E2F-1 Protein
To determine whether the overexpressed E2F-1 protein was functional as a transcription factor, we asked whether the adenovirus E2 promoter would be transactivated by E2F in the infected cells (Bagchi et al., 1989; Kovesdi et al., 1986; Raychaudhuri et al., 1990). Plasmids containing the CAT gene for which transcription was driven by either a wild-type E2 promoter consisting of two E2F binding sites or a mutant E2 promoter in which both E2F binding sites were disrupted by mutation (Loeken and Brady, 1989) were transfected into pools of cells that overexpressed E2F-1 and control cells, and CAT activity was measured. A total of five transfection experiments were performed. Three different cell lines were used. Figure 3 shows the data for Ψ-CRE (one experiment), 3T3 clone 4 (mean of two experiments), and C3H10T1/2 (mean of two experiments) cells. The data show that E2F-1 overexpression stimulated CAT activity from the wild-type E2 promoter compared to cells not overexpressing E2F-1. This stimulation was 3.4-fold for Ψ-CRE, 2.4-fold for C3H10T1/2, and 1.3-fold for 3T3 clone 4 cell pools. That the E2F-1-dependent stimulation of the E2 promoter was lower in 3T3 clone 4 cells than in the other cells is reasonable because E2F-1 was overexpressed only 10-fold in 3T3 clone 4 cell pools compared to 20- to 30-fold in Ψ-CRE and C3H10T1/2 cell pools (Fig. 2). The two-to three-fold stimulation of the E2 promoter by E2F is low but is similar to that described by others in both cell transfection experiments (Bandara et al., 1993; Johnson et al., 1993; Wu and Levine, 1994) and in vitro transcription systems (Dynlacht et al., 1994).
FIG. 3.

Transactivation of the E2 promoter by overexpressed E2F-1. CAT assays were performed on Ψ-CRE (one experiment), 3T3 clone 4 (mean of two experiments), and C3H10T1/2 (mean of two experiments). The identity of the cells is indicated above the graphs. Below the graphs is indicated whether the cells were overexpressing E2F-1 (+ or − E2F; + is over-expression, − is control) or whether the transfected CAT construct contained a wild-type or mutant E2 promoter (wild-type E2 pr; + is wild-type, − is mutant). CAT activity for each graph was normalized to the value obtained with cells not over-expressing E2F-1 that were transfected with a CAT construct containing the mutant E2 promoter. This value was designated 1.0. In all experiments, a plasmid encoding a β-galactosidase gene was cotransfected along with the CAT constructs and used as a control for transfection efficiency as described in Materials and Methods.
In comparison to the wild-type E2 promoter, there was a significant reduction in CAT activity from the mutant E2 promoter in both E2F-1 over-expressing cells (reduction compared to wild-type E2 promoter was 7.5-fold for Ψ-CRE, 6.6-fold for C3H10T1/2, and 2.5-fold for 3T3 clone 4 cells) and control cells not overexpressing E2F-1 (reduction compared to wild-type E2 promoter was 2.4-fold for Ψ-CRE, 4.0-fold for C3H10T1/2, and 1.9-fold for 3T3 clone 4 cells). This shows that high levels of CAT activity required functional E2F binding sites in these constructs. Importantly, significant stimulation of CAT activity in E2F-1 overexpressing cells compared to control cells was not detected in the absence of intact E2F binding sites in the E2 promoter (stimulation was 1.1-fold for Ψ-CRE, 1.5-fold for C3H10T1/2, and 0-fold for 3T3 clone 4 cells). Therefore, the stimulation was dependent on functional E2F binding sites in these constructs.
Transformation of Cells Overexpressing E2F-1
We were interested to know if E2F-1 overexpressing cells possessed the in vitro equivalent of a cancer cell phenotype. Because anchorage-independent growth of fibroblasts correlates highly with tumor formation in the animal (Barrett et al., 1979), we tested E2F-1 overexpressing cells for anchorage-independent growth by plating the cells in soft agar medium and assaying for ability of the cells to form colonies (Rizzino, 1987). In these experiments, as in those previous studies, pooled clones of cells were used (see Materials and Methods) to eliminate the possibility that clonal effects would be described.
Figure 4 shows micrographs of both control uninfected and Linker Neo CMV E2F infected E2F-1 overexpressing cells after growth in soft agar medium for 3 weeks. The micrographs show that E2F-1 overexpressing cells formed colonies in soft agar and were therefore capable of proliferating in an anchorage-independent manner. Control, uninfected cells did not form colonies under these conditions. Similar results were obtained for cultures of Ψ-CRE and 3T3 clone 4 cells that overexpressed E2F-1 (data not shown).
FIG. 4.
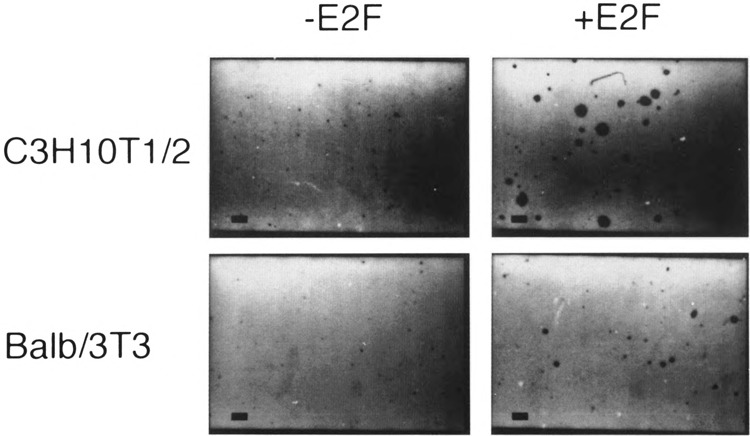
Transformation of C3H10T1/2 and Balb/3T3 clone A31 cells. Cells were plated in soft agar medium, stained, and photographed. Identity of cells is indicated to the left of the pictures and whether they overexpress E2F-1 is shown on the top. Magnification is ×40. The bar at the lower left corner of each micrograph is 200 μm.
To quantify anchorage-independent growth, colonies greater than 50 μm in diameter were scored. Control cells in these experiments were either uninfected cells (as in Fig. 4) or cells infected with the pX17 virus that encodes the Neo gene but not E2F-1 (Sladek and Jacobberger, 1992a). pX17-infected control cells were selected in G418 as were Linker Neo CMV E2F-infected cells. The data for these quantitative experiments are presented in Fig. 5 as the percentage of the total plated cells that formed colonies. The data show that control cells (i.e., uninfected or pX17-infected cells) for all four cell lines formed colonies at a frequency of 0–0.7%. E2F-1 overexpressing cells, however, formed colonies at a frequency of 3.4–9.2%. The lowest frequency of colony formation in E2F overexpressing cells was in the pool of 3T3 clone 4 cells that expressed E2F-1 at a level relatively lower level (10-fold increase over background) than the other cell lines used in these studies (20- to 30-fold increase over background; see Fig. 2). For all four cell lines that were tested, the transformation frequency of E2F-1 overexpressing cells was statistically significant compared to that of control cells. Paired t-test statistics comparing the colony-forming frequency of uninfected vs. Linker Neo CMV E2F-infected cells yielded values of 0.0001 for each of the four cell lines tested. pX17-infected cells were included as controls for two cell lines, 3T3 clone 4 and Balb/3T3 clone A31. Paired t-test statistics comparing the colony-forming frequency of uninfected vs. pX17-infected cells for these two cell lines yielded values of 0.0842 for 3T3 clone 4 and 0.2564 for Balb/3T3 clone A31. These data show that the colony-forming frequencies of uninfected and pX17-infected cells were not significantly different from one another. Therefore, selection of infected cells in G418 does not cause transformation. The conclusion from these experiments is that E2F-1 overexpression leads to cell transformation because they grow in an anchorage-independent manner as measured by growth in soft agar.
FIG. 5.
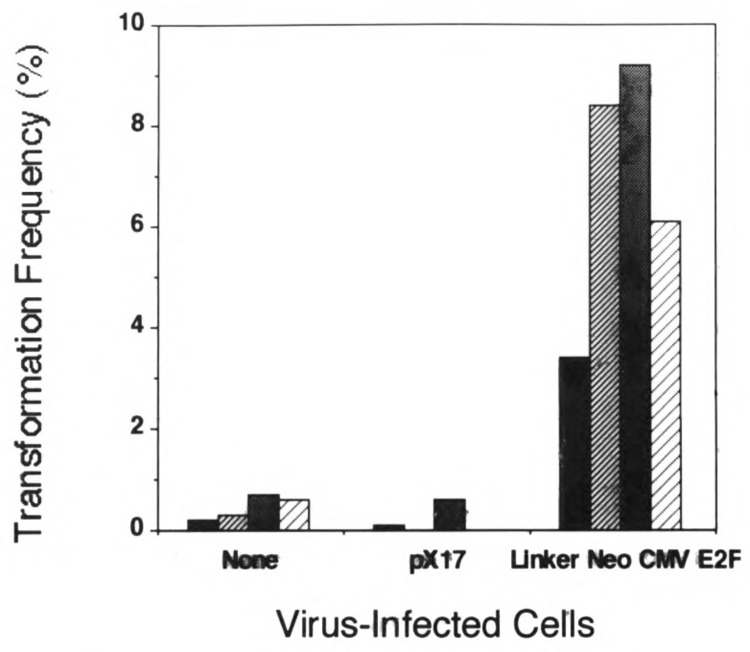
Frequency of transformation. Colonies greater than 50 μm in diameter were scored after 3 weeks of growth. Transformation frequency was expressed as the percentage of total plated cells that formed colonies. The designations for each cell line are: 3T3 clone 4, filled columns; C3H10T1/2, narrow striped columns; Balb/3T3 clone A31, shaded columns; and Ψ-CRE, wide striped columns.
E2F-1 Overexpression Decreases the Duration of the G1 Cell Cycle Phase in Proliferating Cells
Shortening the G1 cell cycle phase duration of proliferating cells is a property of oncogenes and cell cycle regulatory genes, c-myc (Karn et al., 1989), large T antigen from simian virus 40 (Sladek and Jacobberger, 1992a), cyclin E (Ohtsubo and Roberts, 1993), D type cyclins (Quell et al., 1993), and the E1 protein of bovine papillomavirus (Belyavskyi et al., 1994) all produce this phenotype. Therefore, we performed experiments to determine if E2F-1 overexpression would shorten the G1 phase duration in proliferating cells. These experiments were done by adding the mitotic blocking agent, nocodazole, directly to exponentially proliferating cell cultures. Because nocodazole blocks completion of mitosis, cells that are present in the S or G2 + M phases at the time of nocodazole addition never progress to the G1 phase. Therefore, no new cells enter the G1 compartment after addition of the drug. This means that, after nocodazole addition to cells, the percentage of total cells in the G1 phase decreases over time because the cells in G1 at the time of drug addition progress out of G1 towards the mitotic block. By measuring the percentage of total cells present in the G1 phase at various times after nocodazole addition to the cultures, the exit rate of cells from G1 can be calculated. A shorter G1 phase duration will be reflected in a more rapid exit rate of cells from the G1 compartment (Sladek and Jacobberger, 1992a). The data in Fig. 6 show that, when these experiments were done with E2F-1 overexpressing cells and compared to non-overexpressing controls, E2F-1 overexpressing cells exited the G1 phase at a faster rate than control cells. This was found for all three cell lines tested. The conclusion from these experiments is that E2F-1 overexpression shortens the duration of the G1 cell cycle phase in proliferating cells. Therefore, besides anchorage-independent growth, E2F-1 overexpression hastens entrance of proliferating cells into the S phase.
FIG. 6.
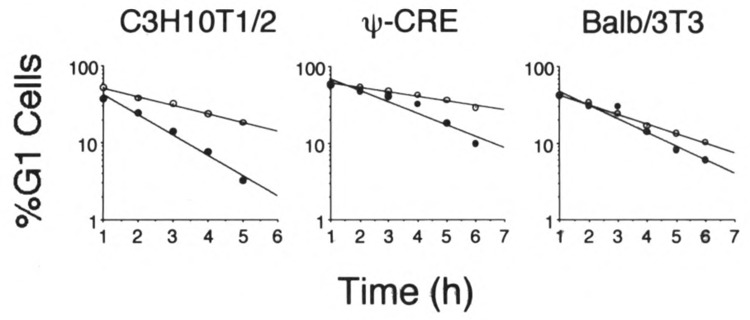
E2F-1 overexpression decreases the duration of the G1 cell cycle phase in proliferating cells. Exponentially growing control (○) and Linker Neo CMV E2F-infected (•) cells were treated with nocodazole at 0 h. At the indicated times thereafter, cells were trypsinized, fixed, stained, and analyzed for DNA content by flow cytometry. The percentages of G1 phase cells as percentages of total cells were obtained from computer analysis of the DNA histograms and plotted against the time after nocodazole addition that the cell sample was taken. Regression lines were drawn through the points, r 2 for all lines was ≥ 0.92. Data for three cell lines are shown. Identity of the cell lines is indicated above each graph. For C3H10T1/2 and Balb/3T3 clone A31 cells, the controls were pX17 infected and selected in G418. For Ψ-CRE cells the controls were uninfected Ψ-CRE.
DISCUSSION
We investigated the possibility that overexpression of the gene encoding the E2F-1 transcription factor would lead to phenotypes indicative of cell transformation in cultured cells. To overexpress E2F-1, we chose a retroviral expression vector (Fig. 1). An E2F-1-specific antibody was used to examine extracts from infected cells in immunoblotting experiments for E2F-1 overexpression. Quantification of the immunoblots showed that E2F-1 was overexpressed 20- to 30-fold in Ψ-CRE, Balb/3T3 clone A31, and C3H10T1/2 cell pools (Fig. 2). In contrast, E2F-1 was overexpressed only 10-fold in the 3T3 clone 4 cell pool (Fig. 2).
The immunoblotting experiments detected a group of at least three E2F-1 proteins in virus-infected cells that clustered around 60 kDa in molecular weight (Fig. 2). These multiple E2F-1 protein bands were present in all four of the cell lines in which E2F-1 was overexpressed. The same bands were present in control cells in lower abundance. The identity of the multiple E2F-1 -specific bands is not known but, because they arise from expression of a single cDNA, they could be modified forms of the protein. It is known that E2F is phosphorylated and that its DNA binding activity (Bagchi et al., 1989), and possibly transactivation function (Krek et al., 1994), is regulated by this phosphorylation. One possibility is that the multiple E2F-1 bands seen in our immunoblots represent differentially phosphorylated forms of E2F-1. Interestingly, differentially phosphorylated forms of the pRb protein can be separated by SDS-polyacrylamide electrophoresis (DeCaprio et al., 1988; Lee et al., 1987; Ludlow et al., 1989).
Overexpressed E2F-1 protein was functional because it could transactivate the adenovirus E2 promoter in transient transfection assays (Fig. 3). Transactivation was dependent on functional E2F binding sites in the E2 promoter. Therefore, the effect was specifically due to E2F action on the promoter. The level of E2F stimulation of the E2 promoter in these experiments was low (1.3- to 3.4-fold), but similar levels of promoter stimulation by E2F have been previously reported in both transfection experiments (Bandara et al., 1993; Johnson et al., 1993; Wu and Levine, 1994) and in vitro transcription systems (Dynlacht et al., 1994). It should be noted that maximal transactivation by E2F is only achieved in the presence of the DP-1 protein (Bandara et al., 1993; Helin et al., 1993b; Krek et al., 1993). DP-1 protein was not overexpressed along with E2F-1 in these experiments. Therefore, considering that E2F-1 was overexpressed 10- to 30-fold, DP-1 levels may have been limiting.
In our experiments, the weakest stimulation of the wild-type E2 promoter by E2F-1 (1.3-fold) was found in 3T3 clone 4 cells that expressed E2F-1 10-fold over background. Stronger stimulation of the E2 promoter was found in Ψ-CRE (3.4-fold) and C3H10T1/2 (2.4-fold) cells that expressed E2F-1 20- to 30-fold over background. These data suggest a dose-dependent effect of E2F-1 on tran-scriptional regulation and, as will be discussed below, on phenotype.
The cells overexpressing functional E2F-1 protein were examined and found to possess phe-notypes common to malignant cells. Cells overexpressing E2F-1 were able to grow in an anchorage-independent manner as demonstrated by their ability to form colonies in soft agar medium (Figs. 4 and 5). Anchorage-independent growth of fibroblasts is highly correlative with the ability of cells to form tumors in animals (Barrett et al., 1979). Therefore, E2F-1 overexpression leads to a transformed phenotype in these cells. This phenotype appeared to be dose dependent because the transformation efficiency of 3T3 clone 4 cells with 10-fold E2F-1 overexpression was lower (3.4%) than that for cells with 20- to 30-fold E2F-1 over-expression (6.1% for Ψ-CRE cells, 9.2% for Balb/3T3 clone A31 cells, 8.4% for C3H10T1/2 cells).
The finding that E2F-1 overexpression leads to cell transformation is consistent with other known activities of E2F. First, target genes known to be regulated by E2F play an important role in DNA synthesis and cell proliferation control (Dalton, 1992; Hamel et al., 1992; Lam and Watson, 1993; Means et al., 1992; Ogris et al., 1993; Pearson et al., 1991; Weintraub et al., 1992). Overexpression of E2F could increase the expression of these genes, resulting in transformation. Second, E2F-1 transcription factor activity is negatively regulated through complex formation with other proteins, including pRb (Flemington et al., 1993; Helin et al., 1993a) and cyclin A (Krek et al., 1994). Over-expression of E2F would likely result in subversion of this negative regulation and possible transformation by the mechanism above. Third, transiently overexpressed E2F-1 can drive quiescent cells into S phase of the cell cycle (Johnson et al., 1993). Stable overexpression of E2F resulting in transformation could be an extension of this phenotype.
A second phenotype found in cells overexpressing E2F-1 was a shortened G1 cell cycle phase duration compared to control cells (Fig. 6). Early entry into S phase, as occurs when the G1 phase duration is shortened, is a cellular phenotype produced by genes causing transformation (Belyavskyi et al., 1994; Karn et al., 1989; Ohtsubo and Roberts, 1993; Quell et al., 1993; Sladek and Jacobberger, 1992a). That the G1 cell cycle phase was specifically affected is consistent with the point during the cell cycle when E2F is known to act. E2F-1 expression is normally cell cycle regulated and it is initially synthesized in middle to late G1 phase (Kaelin et al., 1992; Slansky et al., 1993). In addition, cellular promoters known to be regulated by E2F-1 are activated in middle to late G1 (Lam and Watson, 1993; Means et al., 1992). Because E2F-1 synthesis and transcriptional activity occurs in middle to late G1 phase, it is reasonable to expect that if overexpressed E2F-1 would have a cell cycle effect, it would be in the G1 phase.
Besides the cell proliferation phenotypes that we describe here and that others have previously reported (Johnson et al., 1993), overexpression of E2F-1 has been shown to produce another cellular effect. Recent experiments have shown that over-expression of E2F-1 causes cells to undergo programmed cell death (i.e., apoptosis) that is dependent on the presence of a wild-type p53 gene product (Wu and Levine, 1994). One possible explanation for these diverse phenotypes may be that the cells we have used in our experiments do not contain wild-type p53. It has been shown that immortalized rodent cell lines derived from continued passage of primary embryo cells have mutations in p53 (Harvey and Levine, 1991). Because the cells used in these experiments were derived from continued passage of primary mouse embryo cultures, perhaps the cells used here contain mutated p53. It is therefore possible that overexpression of E2F without wild-type p53 may result in an oncogenic phenotype, but if wild type p53 is present, apoptosis will result. Experiments to test this possibility are underway. Therefore, because p53 alteration is a frequent genetic event in human cancers (Harris and Hollstein, 1993), it is intriguing to speculate that overexpression of the E2F family of proteins may contribute to carcinogene-sis in these cancers.
Finally, while this paper was being prepared for publication, a similar report appeared demonstrating that E2F-1 overexpression in rat fibro-blasts leads to cell transformation (Singh et al., 1994). Our data are consistent with the findings of Singh and coworkers and, in addition, show that E2F-1 overexpression shortens the duration of the G1 cell cycle phase.
ACKNOWLEDGEMENTS
We thank Drs. Kristian Helin and Ed Harlow, William Kaelin and David Livingston, and Wen-Hwa Lee for sending E2F plasmids. We are grateful to Dr. Ronald Reichel for essential discussions, comments on the manuscript, and for providing the E2-CAT plasmids. We thank Drs. Kenneth Beaman for use of his microscope, K.-P. Chang for comments on the manuscript, Michael Fennewald for use of his laser densitometer, Alexander Jacob and Asish Ghosh for instruction on performing CAT assays, Donna King and Mr. Joel Saban for computer help, and Judith Potashkin for helpful discussions. This work was supported by a Basic Medical Research Grant from the Life & Health Insurance Medical Research Fund awarded to T.L.S.
REFERENCES
- Aaronson S. A. and Todaro G. J. (1968), J Cell Physiol 72, 141–148. [DOI] [PubMed] [Google Scholar]
- Ausubell F. M., Brent R., Kingsson R. E., Moore D. D., Smith J. A., Seidman J. G., and Struhl K. (eds.) (1987) in Current Protocols in Molecular Biology, John Wiley & Sons, New York. [Google Scholar]
- Bagchi S., Raychaudhuri P., and Nevins J. R. (1989), Proc Natl Acad Sci USA 86, 4352–4356. [DOI] [PMC free article] [PubMed] [Google Scholar]
- Bandara L. R., Buck V. M., Zamanian M., Johnston L. H., and La N. B. T.(1993), EMBO J 12, 4317–4324. [DOI] [PMC free article] [PubMed] [Google Scholar]
- Barrett J. C., Crawford B. D., Mixter L. O., Schechtman L. M., Ts’o P. O. P., and Pollack R. (1979), Cancer Res 39, 1504–1510. [PubMed] [Google Scholar]
- Belyavskyi M., Miller J., and Wilson V. (1994), Cytometry 16, 129–137. [DOI] [PubMed] [Google Scholar]
- Boshart M., Weber F., Jahn G., Dorsch-Hèsler K., Fleckenstein B., and Schaffner W. (1985), Cell 41, 521–530. [DOI] [PubMed] [Google Scholar]
- Cao L., Faha B., Dembski M., Tsai L. H., Harlow E., and Dyson N. (1992), Nature 355, 176–179. [DOI] [PubMed] [Google Scholar]
- Chackalaparampil I. and Shalloway D. (1988), Cell 52, 801–810. [DOI] [PubMed] [Google Scholar]
- Chellappan S. P., Hievert S., Mudryj M., Horowitz J. M., and Nevins J. R. (1991), Cell 65, 1053–1061. [DOI] [PubMed] [Google Scholar]
- Chittenden T., Livingston D. M., and Kaelin W. G. Jr. (1991), Cell 65, 1073–1082. [DOI] [PubMed] [Google Scholar]
- Cobrinik D., Whyte P., Peeper D. S., Jacks T. and Weinberg R. A. (1993), Genes Dev 7, 2392–2404. [DOI] [PubMed] [Google Scholar]
- Dalton S. (1992), EMBO J 11, 1797–1804. [DOI] [PMC free article] [PubMed] [Google Scholar]
- Danos O. and Mulligan R. C. (1988), Proc Natl Acad Sci USA 85, 6460–6464. [DOI] [PMC free article] [PubMed] [Google Scholar]
- Dean P. N. (1987), in Techniques in Cell Cycle Analysis (Gray J. W. and Darzynkiewicz Z., eds.), Humana Press, Clifton, NJ, pp. 207–253. [Google Scholar]
- DeCaprio J. A., Ludlow J. W., Figge J., Shew J.-Y., Huang C.-M., Lee W.-H., Marsilio E., Paucha E., and Livingston D. M. (1988), Cell 54, 275–283. [DOI] [PubMed] [Google Scholar]
- Devoto S. H., Mudryj M., Pines J., Hunter T., and Nevins J. R. (1992), Cell 68, 167–176. [DOI] [PubMed] [Google Scholar]
- Dynlacht B. D., Flores O., Lees J. A., and Harlow E. (1994), Genes Dev 8, 1772–1786. [DOI] [PubMed] [Google Scholar]
- Flemington E. K., Speck S. H., and Kaelin W. G. Jr. (1993), Proc Natl Acad Sci USA 90, 6914–6918. [DOI] [PMC free article] [PubMed] [Google Scholar]
- Hamel P. A., Gill R. M., Phillips R. A., and Gallie B. L. (1992), Mol Cell Biol 12, 3431–3438. [DOI] [PMC free article] [PubMed] [Google Scholar]
- Harris C. C. and Hollstein M. (1993), N Engl J Med 329, 1318–1327. [DOI] [PubMed] [Google Scholar]
- Harvey D. M. and Levine A. J. (1991), Genes Dev 5, 2376–2384. [DOI] [PubMed] [Google Scholar]
- Helin K., Lees J. A., Vidal M., Dyson N., Harlow E., and Fattaey A. (1992), Cell 70, 337–350. [DOI] [PubMed] [Google Scholar]
- Helin K., Harlow E., and Fattaey A. (1993a) Mol Cell Biol 13, 6501–6508. [DOI] [PMC free article] [PubMed] [Google Scholar]
- Helin K., Wu C. L., Fattaey A. R., Lees J. A., Dynlacht B. D., Ngwu C., and Harlow E. (1993b), Genes Dev 7, 1850–1861. [DOI] [PubMed] [Google Scholar]
- Jacob A., Budhiraja S., Qian X., Clevidence D., Costa R. H., and Reichel R. R. (1994), Nucleic Acids Res 22, 2126–2133. [DOI] [PMC free article] [PubMed] [Google Scholar]
- Jacobberger J. W., Fogelman D., and Lehman J. M. (1986), Cytometry 7, 356–364. [DOI] [PubMed] [Google Scholar]
- Jainchill J. L., Aaronson S. A., and Todaro G. J. (1969), J Virol 4, 549–553. [DOI] [PMC free article] [PubMed] [Google Scholar]
- Jat P. S., Cepko C. L., Mulligan R. C., and Sharp P. A. (1986), Mol Cell Bid 6, 1204–1217. [DOI] [PMC free article] [PubMed] [Google Scholar]
- Johnson D. G., Schwarz J. K., Cress W. D., and Nevins J. R. (1993), Nature 365,349–352. [DOI] [PubMed] [Google Scholar]
- Kaelin W. G. Jr., Krek W., Sellers W. R., DeCaprio J. A., Ajchenbaum F., Fuchs C. S., Chittenden T., Li Y., Farnham P. J., Blanar M. A., Livingston D. M., and Flemington E. K.(1992), Cell 70, 351–364. [DOI] [PubMed] [Google Scholar]
- Karn J., Watson J. V., Lowe A. D., Green S. M., and Vedeckis W. (1989), Oncogene 4, 773–787. [PubMed] [Google Scholar]
- Kierstead T. D. and Tevethia M. J. (1993), J Virol 67, 1817–1829. [DOI] [PMC free article] [PubMed] [Google Scholar]
- Kovesdi I., Reichel R., and Nevins J. R. (1986), Cell 45, 219–228. [DOI] [PubMed] [Google Scholar]
- Krek W., Livingston D. M., and Shirodkar S. (1993), Science 262, 1557–1560. [DOI] [PubMed] [Google Scholar]
- Krek W., Ewen M. E., Shirodkar S., Arany Z., Kaelin W. G. Jr., and Livingston D. M. (1994), Cell 78, 161–172. [DOI] [PubMed] [Google Scholar]
- La Thangue N. B. (1994), Trends Biochem Sci 19, 108–114. [DOI] [PubMed] [Google Scholar]
- Laemmli U. K. (1970), Nature 227,680–685. [DOI] [PubMed] [Google Scholar]
- Lam E. W.-F. and Watson R. J. (1993), EMBO J 12, 2705–2713. [DOI] [PMC free article] [PubMed] [Google Scholar]
- Lee W.-H., Shew J.-Y., Hong F. D., Sery T. W., Donoso L. A., Young L.-J., Bookstein R., and Lee E. Y.-H. P. (1987), Nature 329, 642–645. [DOI] [PubMed] [Google Scholar]
- Lees E., Faha B., Dulic V., Reed S. I., and Harlow E. (1992), Genes Dev 6, 1874–1885. [DOI] [PubMed] [Google Scholar]
- Loeken M. R. and Brady J. (1989), J Biol Chem 264, 6572–6579. [PubMed] [Google Scholar]
- Ludlow J. W., DeCaprio J. A., Huang C.-M., Lee W.-H., Paucha E., and Livingston D. M. (1989), Cell 56, 57–65. [DOI] [PubMed] [Google Scholar]
- Means A. L., Slansky J. E., McMahon S. L., Knuth M. W., and Farnham P. J. (1992), Mol Cell Biol 12, 1054–1063. [DOI] [PMC free article] [PubMed] [Google Scholar]
- Mudryj M., Devoto S. H., Hiebert S. W., Hunter T., Pines J., and Nevins J. R. (1991), Cell 65, 1243–1253. [DOI] [PubMed] [Google Scholar]
- Nevins J. R. (1992), Science 258, 424–429. [DOI] [PubMed] [Google Scholar]
- Ogris E., Rotheneder H., Mudrak I., Pichler A., and Wintersberger E. (1993), J Virol 67, 1765–1771. [DOI] [PMC free article] [PubMed] [Google Scholar]
- Ohtsubo M. and Roberts J. M. (1993), Science 259, 1908–1912. [DOI] [PubMed] [Google Scholar]
- Pearson B. E., Nasheuer H.-P., and Wang T. S.-F. (1991), Mol Cell Biol 11, 2081–2095. [DOI] [PMC free article] [PubMed] [Google Scholar]
- Quell D. E., Ashmun R. A., Shurtleff S. A., Kato J.-y., Bar-Sagi D., Roussel M. F., and Sherr C. J.(1993), Genes Dev 7, 1559–1571. [DOI] [PubMed] [Google Scholar]
- Raychaudhuri P., Bagchi S., Neill S., and Nevins J. R. (1990), J Virol 64, 2702–2710. [DOI] [PMC free article] [PubMed] [Google Scholar]
- Reznikoff C. A., Brankow D. W., and Heidelberger C. (1973), Cancer Res 33, 3231–3238. [PubMed] [Google Scholar]
- Rizzino A. (1987), Methods Enzymol 146, 341–352. [DOI] [PubMed] [Google Scholar]
- Schwarz J. K., Devoto S. H., Smith E. J., Chellappan S. P., Jakoi L., and Nevins J. R. (1993), EMBO J 12, 1013–1020. [DOI] [PMC free article] [PubMed] [Google Scholar]
- Shirodkar S., Ewen M., DeCaprio J. A., Morgan J., Livingston D. M., and Chittenden T. (1992), Cell 68, 157–166. [DOI] [PubMed] [Google Scholar]
- Singh P., Wong S. H., and Hong W. (1994), EMBO J 13, 3329–3338. [DOI] [PMC free article] [PubMed] [Google Scholar]
- Sladek T. L. and Jacobberger J. W. (1990), J Virol 64, 3135–3138. [DOI] [PMC free article] [PubMed] [Google Scholar]
- Sladek T. L. and Jacobberger J. W. (1992a), J Virol 66, 1059–1065. [DOI] [PMC free article] [PubMed] [Google Scholar]
- Sladek T. L. and Jacobberger J. W. (1992b), Oncogene 7, 1305–1313. [PubMed] [Google Scholar]
- Slansky J. E., Li Y., Kaelin W. G., and Farnham P. J. (1993), Mol Cell Biol 13,1610–1618. [DOI] [PMC free article] [PubMed] [Google Scholar]
- Weintraub S. J., Prater C. A., and Dean D. C. (1992), Nature 358, 259–261. [DOI] [PubMed] [Google Scholar]
- Wu X. and Levine A. J. (1994), Proc Natl Acad Sci USA 91, 3602–3606. [DOI] [PMC free article] [PubMed] [Google Scholar]