

Abstract
Social relationships play an important role in the uptake, maintenance, and cessation of smoking behavior. However, little is known about the natural co-occurrence of social network features in adult smokers’ networks and how multidimensional features of the network may connect to abstinence outcomes. The current investigation examined whether qualitatively distinct subgroups defined by multiple characteristics of the social network could be empirically identified within a sample of smokers initiating a quit attempt. Egocentric social network data were collected from 1571 smokers (58% female, 83% white) engaged in a 3-year smoking cessation clinical trial. Using nine indicator variables reflecting both risk and protective network features, finite mixture models identified five social network subgroups: High Stress/High Contact, Large and Supportive, Socially Disconnected, Risky Friends and Low Contact, and High Contact with Smokers and Light Drinkers. External variables supported the validity of the identified subgroups and the subgroups were meaningfully associated with baseline demographic, psychiatric, and tobacco measures. The Socially Disconnected subgroup was characterized by little social interaction, low levels of stress, and low exposure to social environmental smoking cues, and had the highest probability of successful cessation at 1-week compared to all other social network subgroups. At 6 months post-treatment its members had higher abstinence rates than members of the High Stress/High Contact subgroup and the Risky Friends and Low Contact subgroup. The present study highlights the heterogeneity of smokers’ social milieus and suggests that network features, especially those entailing exposure to smoking cues and contexts, heighten risk for smoking cessation failure.
Keywords: smoking cessation, social networks, social relationships, smoking behavior, finite mixture modeling
Worldwide, smoking is both common and deadly: 1.2 billion people smoke, and smoking remains the leading preventable cause of premature mortality (Cahill, Stevens, Perera, & Lancaster, 2013; US Department of Health and Human Services, 2014). While most smokers report wanting to quit (CDC, 2011), even with the use of pharmacotherapy or counseling 80% of quit attempts fail within the first month (Fiore et al., 2008; Hughes, Keely, & Naud, 2004; Kenford et al., 1994). To guide the development of more effective treatments, a deeper understanding of the variety of influences that support or undermine the cessation process is needed.
Social relationships play an important role in our health and health behaviors (see e.g., Cohen, 2004; Stroebe & Stroebe, 1996). Many health behaviors, including tobacco use, are developed and reinforced in the context of a person’s social network (e.g., Christakis & Fowler, 2008; Rosenquist, Murabito, Fowler, & Christakis, 2010). While multiple studies have examined the connection between smoking and the social network, most research has focused on the networks of adolescents (e.g., Hoffman, Sussman, Unger, & Valente, 2006; Kobus, 2003; Urberg, Degirmencioglu, & Pilgrim, 1997). Research examining the social networks of adult smokers has generally focused on correlations between successful smoking cessation and individual features of the network such as network members’ tobacco use (Hitchman, Fong, Zanna, Thrasher, & Laux, 2014; Ockene, Benfari, Nuttall, Hurwitz, & Ockene, 1982), perceived social support of the network (Bums, Rothman, Fu, Lindgren, & Joseph, 2014; Johnson et al., 2008), network stress (Slopen et al., 2013), or spousal/partner smoking (Hawkins, Hollingworth, & Campbell, 2010). Overall, little is known about the natural co-occurrence of social network features or characteristics of adult smokers’ networks, the extent to which smokers differ in patterns of network characteristics, and how multidimensional features of the network connect to abstinence outcomes.
While traditional variable-centered approaches (e.g., linear regression) describe relationships among a set of variables within a sample or population, person-centered techniques (e.g., cluster analysis) identify qualitatively distinct groupings of similar individuals based on their responses to a set of variables. As a tool for identifying unique types of individuals within the population, person-centered methods are useful because they are able to identify groups of individuals who may share similar etiology, temporal course, or distal outcomes. Tobacco studies have used person-centered analyses to empirically identify qualitatively distinct groups of smokers defined by their pattern of smoking or course of smoking development. These subgroups reliably predict important smoking outcomes such as successful cessation or later nicotine dependence, and are distinguished by key demographic, health, and/or lifestyle characteristics (e.g., Chassin, Presson, Pitts, & Sherman, 2000; Laska, Pasch, Lust, Story, & Ehlinger, 2009). Person-centered strategies can also characterize smokers’ social networks, revealing not only how network features tend to cohere or come together to form qualitatively distinct subgroupings of smokers’ social contexts, but also the relative frequencies with which such subgroups occur. Furthermore, these subgroups may differentially predict important smoking outcomes such as a smoker’s ability to quit. Identifying the presence of distinct network systems (Von Bertalanffy, 1956) has the potential to advance our understanding of cessation outcome likelihood because it captures the additive and interactive effects of multiple network features that may surround a smoker when he or she decides to quit, potentially illuminating the mechanisms that drive cessation failure. In addition, it can highlight other salient features (e.g., demographic, nicotine dependence) that may differentiate these groups. This innovative approach seems warranted given the evidence of strong relations amongst social network features, the serious health risks associated with tobacco-use, and the limited success of current tobacco interventions (Fiore et al., 2008).
The present research will empirically define social network subgroups building on the findings of variable-centered analyses which have identified multiple risk and protective characteristics of the social network that are empirically associated with smoking behavior and with successful quit attempts. These indicator variables include general characteristics of the network such as network size (Berkman, Glass, Brissette, & Seeman, 2000; Valente et al., 2007), “closeness” of contact (Berkman & Syme, 1979; Christakis & Fowler, 2008), perceived support and stress from network members (Carey, Kalra, Carey, Halperin, & Richards, 1993; Cohen & Lichtenstein, 1990; Lawhon, Flumfleet, Hall, Reus, & Munoz, 2009; Westmaas, Bontemps-Jones, & Bauer, 2010), and the smoking and drinking patterns of network members (Hitchman et al., 2014; Shiffman, Paty, Gnys, Kassel, & Hickcox, 1996; Room, 2004).
The present research uses a person-centered analytic technique (finite mixture modeling) and data from a large smoking cessation trial to address four inter-related aims: 1) to determine the number and types of social network subgroups that best summarize the social network data from a sample of smokers engaged in a quit attempt; 2) to validate the identified social network subgroups using pre-selected individual difference variables independent of the mixture modeling analysis; 3) to determine whether the network subgroups predict smoking abstinence at 1-week and 6-months after a quit attempt, and; 4) to provide descriptive characterizations of the identified social network subgroups and determine if the network subgroups vary on important demographic, health, and smoking behaviors in clinically and substantively meaningful ways using descriptive and exploratory post hoc analyses,. While we use the term “subgroups” to describe the results, it is important to bear in mind that finite mixture modeling is a probabilistic (“fuzzy”) clustering technique where each individual’s membership in a subgroup is probabilistic instead of deterministic. Although this probabilistic clustering assignment has advantages (e.g., accounting for measurement error on the grouping variables), relating such latent groupings to specific individuals involves separate probabilistic inference which will be discussed later in this report.
Methods
Participants were 1571 smokers (58% female, 83% white) who completed baseline assessments as part of a 3-year smoking cessation and health outcomes clinical trial conducted in Madison and Milwaukee, Wisconsin. Adult smokers were recruited via media advertisements and local/regional news stories from January 2005 to June 2007. Inclusion criteria included: smoking >10 cigarettes per day during the past six months, having an alveolar carbon monoxide level > 9, expressing a motivation to quit smoking, reporting no medical contraindications to study medications, and reporting no clinical diagnosis of psychosis, bipolar disorder, or schizophrenia. The study received human subject’s approval from the University of Wisconsin Health Sciences Institutional Review Board, and was registered with clinicaltrials.gov as: Smoking Cessation Medications: Efficacy, Mechanisms and Algorithms: NCT00332644. For more details, see Piper et al. (2009).
Participants were screened via telephone to establish eligibility, and attended an informational session where they provided written informed consent. Participants attended three baseline visits and completed a medical history, physiological measures of health status, smoking history, tobacco dependence, social network composition, demographics, and a biochemical assessment of smoking status (a carbon monoxide [CO] breath test).
At the last baseline session, participants were randomized to one of six treatment conditions: (1) bupropion SR; (2) nicotine lozenge; (3) nicotine patch; (4) nicotine patch + nicotine lozenge; (5) bupropion SR + nicotine lozenge; or (6) placebo. Participants then set a quit date for the following week and had follow-up assessments on their quit day and at one, two, four, eight, and 26 weeks after their quit day where vital signs, adverse events, and smoking status were recorded. Of the smokers who initially agreed to participate in the clinical trial and completed the social network assessment at baseline (N=1571), 1504 participants were randomized into the trial.
Measures: Social Network Indicators
Social network characteristics were assessed with an interviewer-administered instrument at baseline. Participants were asked to list the names of their romantic partner and up to nine people who, during the past year, provided emotional or instrumental support, socialized or spent time with them regularly, or were “important” to them. The identification of new network members was terminated when the respondent stopped identifying new members, or when the total network size reached 10. Network sizes thus varied from 0 to 10. After listing the individuals in their network, participants answered questions about each network member including demographic information, relationship to the participant, amount of contact with the participant, smoking and drinking behaviors, amount of emotional support provided, and the amount of stress these individuals caused.
The first step of finite mixture modeling is to select the set of grouping (indicator) variables to group individuals on. Based on the existing literature, nine indicator variables (see below) from participants’ baseline social network interviews were used to identify discrete social network subgroups. Due to specifications within the tEIGEN family of mixture models (Andrews & McNicholas, 2012) and the teigen package (Andrews & McNicholas, 2014) in R (R Development Core Team, 2014), only continuous indicator variables were used to specify the mixture models.
Number of network members.
A point was given for each unique network member identified (including a romantic partner) during the baseline social network interview. Points were added together to create a score which ranged from 1–10.
Percent of network members who are current smokers.
One point was given to each network member identified as a current smoker (reported as a “daily smoker” or “social smoker”). Because the number of current smokers in the network may depend on an individual’s network size, the sum score was divided by the number of network members and multiplied by 100 to obtain a percentage.
Percent of network members who are heavy drinkers.
One point was given to each network member identified as a heavy drinker (reported as a “frequent or heavy social drinker,” “problem drinker,” or “alcoholic”) and a percentage was created.
Mean days of contact with network members.
Participants were asked for each network member: “In the last 30 days, about how many days have you had contact with this person?” A mean contact score was created by summing the number of days the participant reported having contact with each network member across all network members and dividing by the number of network members.
Support of network.
Participants rated the emotional supportiveness of each network member over the past year from 0 = Not at all to 3 = A lot (“this person provided or would have provided emotional support”). A continuous sum score was created by summing the amount of emotional support across the total number of network members.
Percent of network members who are friends.
One point was given for each network member identified as a “close friend” or “friend” and a percentage was created.
Stress of network.
Participants rated the stressfulness of each network member over the past year from 0 = Not at all to 3 = A lot (“was this person a source of stress or conflict for you?”). A continuous sum score was created.
Mean days of contact with current smokers.
For each network member identified as a current smoker, the number of days of contact during the last 30 days were summed across these network members and a mean was created.
Mean days of contact with current drinkers.
For each network member identified as a current drinker, the number of days of contact during the last 30 days were summed across these network members and a mean was created.
Measures: Validation Measures
To provide external validation for the subgroups extracted, measures independent of the social network indices used to identify the groups were selected from the data set. These variables were predicted to significantly differentiate the extracted network subgroups.
Stressful life events.
Life events were sampled from the Social Readjustment Rating Scale (SRRS; Hobson et al., 1998). The SRRS assesses the number of potentially stressful events experienced during the participant’s lifetime with life events ranging from minor (e.g., change in eating habits) to major (e.g., death of a close family member).
Drinking behaviors.
Participants reported: (a) Number of drinking days during the past 30 days, and (b) Number of drinks consumed when drinking.
Mental health.
Participants completed the Composite International Diagnostic Interview (CIDI), a structured clinical interview that provides both past-year diagnoses as well as lifetime diagnoses for mental health and substance use disorders (Kessler & Ustun, 2004).
Smoking environment.
Participants completed the Social-Environmental Goads, a subscale from the Wisconsin Inventory of Smoking Dependence Motives (WISDM; Piper et al., 2004). The WISDM Goads subscale reflects the perceived influence of social and environmental smoking cues on smoking motivation. Participants also reported whether they lived with a partner or a non-partner who currently smokes.
Social network characteristics.
Additional characteristics of smokers’ social networks were examined to further test the validity of the extracted social network subgroups. Participants were asked about their network drinking/smoking buddies (“Did you have a group of ‘drinking (smoking) buddies’ that you drank (smoked) with regularly?”). These questions were used to create: (a) percent of network classified as smoking buddies, and (b) percent of network classified as drinking buddies. In addition, the number of current smokers in the network who smoked a Tittle’ to ‘a lot’ around the participant was used to create: (c) percent of network who smoke around the participant.
Measures: Descriptive Measures
Demographics and smoking variables.
Baseline questionnaires assessed demographics (e.g., gender, race, age, and education level) and smoking history/behaviors including age of smoking initiation, number of cigarettes smoked per day, cessation self-efficacy, and motivation to quit smoking. Participants also completed the 6-item Fagerstrom Test of Nicotine Dependence (FTND; Heatherton et al., 1991).
Social network characteristics.
Additional characteristics of smokers’ social networks were examined to further describe the extracted social network subgroups including: (a) percent of network who are family members, and (b) percent of network who are supportive non-smokers (i.e., “former smoker” or “non-smoker” and emotionally supportive with a score of > 2 on the emotionally supportive variable).
Measures: Abstinence Outcomes
Smoking status.
Smoking status was assessed as 7-day point-prevalence abstinence (“Have you smoked at all, even a puff, in the last seven days?”) at 1 week and 6 months after the target quit date. Abstinence was biochemically confirmed using alveolar carbon monoxide (CO <10 ppm) assessments conducted using a Micro-3 Smokerlyzer (Bedfont Scientific, Williamsburg, Virginia).
Data Analysis
Finite mixture modeling (FMM) with multivariate t-distributions.
FMM’s were fit to identify distinct subgroups of smokers’ social networks based on nine indicator variables (network size, frequency of contact, emotional support, stress, percentage of friends, percent of current smokers and heavy drinkers, and contact with smokers and drinkers). FMM (also called latent profile analysis or model-based clustering) is a person-centered data clustering technique intended to yield an optimal grouping of individuals within the population who are similar to one another on a set of continuous variables, while at the same time being meaningfully different from members of other subgroups (Muthen, 2001). Because FMM assumes that these subgroups are unobserved, the number of subgroups and subgroup membership must be inferred from a set of “indicator” variables. FMM assigns individuals to these groups based on how “close” each individual is to a subgroup’s set of indicator variable means, or the subgroup’s centroid.
FMM’s are known to be particularly sensitive to non-normal data features (Bauer & Curran, 2003; Peel & McLachlan, 2000; Tofighi & Enders, 2008). Thus, to accommodate the possibility of non-normal data features, FMM’s were fit with mixtures of Student /-distributions utilizing the teigen package in R. As a heavy tailed approximation to the normal distribution, mixtures of Student /-distributions allowed the possibility of modelling both heavy-tailed and normal mixture components in cases where some subgroups were sampled from both normal and heavy tailed distributions.
Model fitting procedure.
FMM’s with mixtures of Student /-distributions were estimated with 1 to 7 mixture components (subgroups). For each individual G component mixture model fit (i.e., 1-component, 2-component... 7-component), three different initialization techniques were employed to obtain starting values for the expectation-conditional maximization (ECM) algorithm (Meng & Rubin, 1993): a soft-randomization scheme (SR), a hard-randomization scheme (HR), and traditional k-means (KM)1 clustering. For all models, the ECM algorithm was set to a convergence criterion (M step) of 1 × 10”9 as suggested by Uebersax (2000). Other algorithmic and model-fitting specifications (e.g., max-number of iterations, df start values, etc.) were set to the teigen package defaults. Finally, the /EIGEN family of models employed in the teigen package allows for various constraints to the covariance matrix and degrees of freedom of the multivariate mixture model. When fitting the various mixture models, all 28 possible /EIGEN models (derived by the eigen-decomposition of the covariance matrix with constrained or unconstrained degrees of freedom) were estimated in an effort to find the best-fitting model.
Model selection.
Model selection is one of the more complicated issues when conducting an FMM analysis. While the use of model-fit indices such as the BIC can guide the selection of an optimal final model (Nylund, Asparouhov, & Muthen, 2007), it has also been suggested that model selection in FMM contexts should proceed based on a combination of model fit indices, inspection of the model’s parameters, interpretability, and linkage to substantive theory (Bauer & Curran, 2003; Muthen, 2003). Therefore, to select a final model, models with the lowest BIC and AIC values (Forster, 2000; Forster, 2002; Sober, 2002) were selected and examined for differences on the extracted subgroups’ indicator means or medians utilizing background social network, smoking, and behavioral science theory as a substantive guide. Consideration was also given to the subgroups parameter estimates, log-likelihood, and proportion of the sample assigned to each subgroup of the fitted models.
Social network subgroup validation.
Because FMM estimates each individual’s posterior probability of membership in each subgroup based on their response to the set of indicator variables, there is uncertainty associated with each individual’s subgroup assignment. To reduce bias when estimating the association between independent variables and subgroup membership, the final teigen model was re-estimated in Mplus (Muthen & Muthen, 1998–2015) using the R3STEP procedure based on Vermunt (2010) to correct for classification uncertainty. The R3STEP procedure estimates multinomial logistic regression models that include the covariates as predictors of the latent subgroups. To adjust for multiple tests of significance, all pairwise tests were adjusted for the false discovery rate (FDR; Benjamini & Hochberg, 1995).
Prediction of smoking cessation outcomes.
To assign each individual to a unique network subgroup, a “classify-analyze” approach was taken where participants were assigned to the social network subgroup corresponding to their highest posterior probabilities2. To determine if the identified subgroups differentially predicted cessation success at 1-week and 6-months post quit, logistic regression models were fit with social network subgroup membership as the primary dummy-coded predictors and gender, race, education, nicotine dependence (FTND), cigarettes smoked per day, and treatment (active vs. placebo) as covariates.
Social network subgroup description.
After identifying the social network subgroups, exploratory analyses were conducted using the R3 STEP procedure in Mplus to examine network subgroup differences on demographic, smoking, drinking, psychopathology, health, and social network measures, adjusting for the FDR.
Results
The majority of participants were female (58%), Caucasian (83%), and were unlikely to have obtained a college degree (Table 1). Participants were about 44 years old and smoked approximately 21 cigarettes per day (SD = 8.94). During their baseline social network interview, smokers reported an average of 7.7 social network members (out of a possible 10; 27% of smokers reported a full network of 10 individuals), moderate levels of network support (M = 14.60, SD = 6.07), and low levels of network stress (M = 4.86, SD = 3.48). Current smokers made up 38% of participants’ networks (SD = 22.65).
Table 1.
Sample Demographics and Social Network Indicator Variables (Means, Percentages, and Standard Deviations)
| Continuous Variables | Mean | SD |
| Age | 44.65 | 11.15 |
| Categorical Variables | n | % |
| Female | 864 | 58 |
| Non-White | 259 | 17 |
| Married | 658 | 44 |
| Has a Partner | 975 | 62 |
| College Education or > | 324 | 22 |
| Social Network Indicator Variables | Mean | SD |
| Number of Network Members | 7.70 | 2.32 |
| Current Smokers (% of Network) | 38.19 | 22.65 |
| Heavy Drinkers (% of Network) | 10.66 | 14.22 |
| Average Contact with Network Members | 14.50 | 5.74 |
| Support of Network | 14.60 | 6.07 |
| Friends (% of Network) | 44.41 | 25.18 |
| Stress of Network | 4.86 | 3.48 |
| Average Contact with Current Smokers | 13.16 | 8.43 |
| Average Contact with Drinkers | 13.36 | 6.75 |
Note. N = 1571
Identification of Social Network Subgroups
FMM’s containing one through seven mixture components were fit to the nine social network indicators in the dataset. Table 2 shows the model-fit indices for the 1, 2, 3, 4, 5, and 6 component mixture models extracted by the teigen package. Examination of Table 2 reveals that as the number of components increased, the BIC and AIC decreased until the 6-subgroup model, where all three model-fit indices increased above both 5-subgroup models (SR and KM). Substantive examination of the 4, 5, and 6-subgroup models revealed that the 4-subgroup model combined two substantively meaningful subgroups and contained a group that was made-up of 51% of the sample. In addition, both 6-subgroup models contained small (e.g., < 8% of the sample) and substantively meaningless subgroups. Examination of the two 5-subgroup models revealed that while the 5-subgroup KM model fit the data the best, two of the indicator variance estimates were 0 (suggesting a potentially spurious solution), and the solution included a substantively meaningless subgroup. Taking these findings into consideration and given that the 5-subgroup SR model had the second lowest BIC and AIC value, the 5-subgroup SR model was selected as the final model and was used for all subsequent analyses. The final model’s component degrees of freedom were unconstrained with values of 2.0, 11.3, 7.7, 2.9, and 18.4 for classes 1 through 5 respectively, and revealed largely non-normal mixture components3.
Table 2.
Model Fit Statistics
| Model | Covariance Matrix Decomposition | Log-Likelihood | AIC | BIC |
|---|---|---|---|---|
| 1-Cluster Modelkm | UUUU | −18033.92 | 36177.84 | −36472.62 |
| 2-Cluster Modelkm | CUCC | −16819.16 | 33840.32 | −34381.63 |
| 3-Cluster Modelsr | CUCU | −16036.94 | 32371.88 | −33170.44 |
| 4-Cluster Modelsr | CUCU | −15471.95 | 31335.92 | −32386.36 |
| 5-Cluster Modelsr | CUCU | −14994.02 | 30474.04 | −31776.39 |
| 5-Cluster Modelkm | CUCU | −14820.21 | 30126.42 | −31428.78 |
| 6-Cluster Modelsr | CUCC | −15553.65 | 31677.37 | −33204.75 |
| 6-Cluster Modelkm | CUCU | −15189.76 | 30959.52 | −32513.77 |
Note. sr = Soft Randomization; km = k-means; C = Constrained; U = Unconstrained
Description of Identified Social Network Subgroups Based on Indicators
Table 3 and Figure 1 provide an overall synthesis and graphical description of each subgroup’s social network indicator means. Effect size calculations and mean comparisons across subgroups indicated that the identified subgroups were well-separated with minimal overlap. See Supplemental Table 1 for all indicator means with accompanying omnibus Kruskall-Wallis and Mann-Whitney pairwise comparison tests.
Table 3.
Social Network Subgroups and Differentiating Indicator Variables
| Social Network Subgroups (% of sample) | Social Network Indicator Results |
|---|---|
| High Contact/High Stress (8%) | Highest amount of contact with network members Highest level of network stress |
| Large and Supportive (22%) | Largest network size Highest level of emotional support |
| Socially Disconnected (16%) | Smallest network size Lowest level of emotional support Lowest level of network stress Smallest % of friends in network No heavy drinkers Smallest % of current smokers Lowest level of contact with smokers and drinkers |
| Risky Friends and Low Support (19%) | Largest % of friends Lowest level of network contact Low levels of emotional support Highest % of Smokers and Drinkers |
| High Contact with Smokers and Light Drinkers (35%) | No heavy drinkers Highest level of contact with smokers and drinkers |
Figure 1.
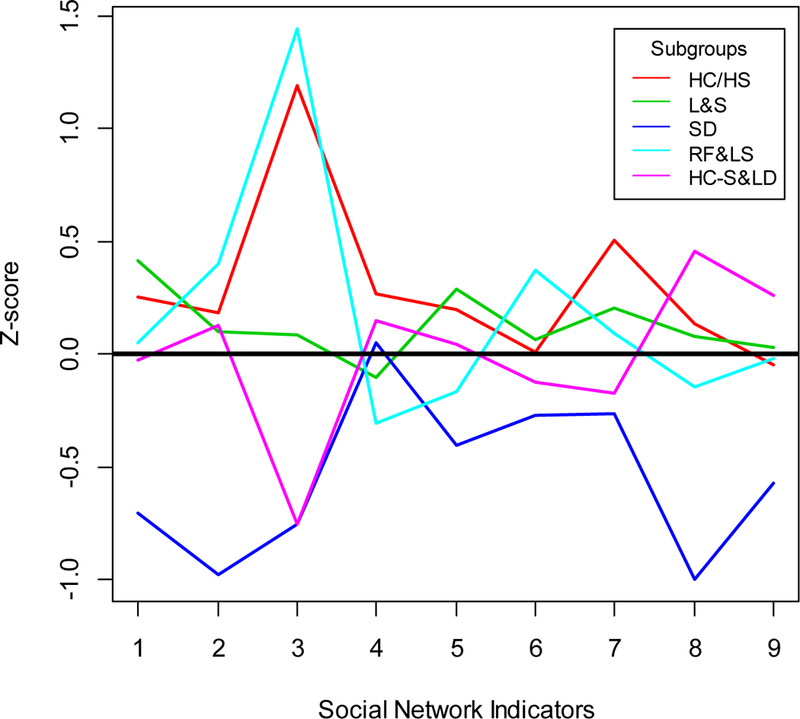
Line-Graph of Indicator Means (standardized) by Subgroup. Social Network Indicators are as follows: 1 = Number of Network Members; 2 = Current Smokers (% of Network); 3 = Heavy Drinkers (% of Network); 4 = Average Contact with Network Members; 5 = Support of Network; 6 = Friends (% of Network); 7 = Stress of Network; 8 = Average Contact with Smokers; 9 = Average Contact with Drinkers. HC/HS = High Contact/High Stress; L&S = Large and Supportive; SD = Socially Disconnected; RF&LS = Risky Friends and Low Support; HC-S & LD = High Contact with Smokers and Light Drinkers.
Subgroup 1 (n = 122, 8%) contained smokers who reported the highest amount of contact with members of their network and the highest amount of network stress. Members of this subgroup also endorsed a high number of network members, a high proportion of heavy drinkers, and high amounts of contact with current smokers compared to other subgroups. Based on these patterns, Subgroup 1 was labeled High Contact High Stress. Subgroup 2 (n = 351, 22%) contained smokers who reported the largest number of network members and received the highest amount of emotional support from their network. This subgroup was labeled Large and Supportive. Subgroup 3 (n = 254, 16%) contained individuals who reported the fewest network members, lowest level of emotional support and network stress, and had the smallest proportion of individuals in their network who they considered to be “friends.” In addition, these individuals reported that their network contained no heavy drinkers, the smallest proportion of current smokers, and the smallest amount of average contact with current smokers and drinkers. Subgroup 3 was labeled Socially Disconnected. Smokers in Subgroup 4 (n = 296, 19%) reported the highest proportion of “friends,” current smokers, and heavy drinkers in their network, but the lowest amount of average contact with network members and low levels of emotional support. This subgroup was labeled Risky Friends and Low Support. Subgroup 5 (n = 548, 35%) was the largest of the five subgroups. Individuals in this subgroup reported a high amount of overall contact with network members, and the highest amount of contact with current smokers and drinkers when compared to all other extracted subgroups, but no heavy drinkers. This subgroup was named High Contact with Smokers and Light Drinkers.
Validation of Identified Social Network Subgroups
The social network subgroups were found to be meaningfully related to pre-selected independent validation variables (see Table 4). For example, smokers in the High Contact/High Stress subgroup scored highest on the Social Readjustment measure of overall life stress and were the least likely to live alone. Smokers in the Risky Friends and Low Support subgroup had the highest number of drinking days per month, were the most likely to smoke with their friends, and had the highest proportion of drinking buddies. Members of this group also scored highest on the WISDM Social-Environmental Goads subscale (indicating that their smoking was triggered by environmental cues). Smokers in the High Contact with Smokers and Light Drinkers subgroup were the most likely to live with a partner or spouse who smoked. Finally, members of the Socially Disconnected subgroup reported the lowest percentage of smoking and drinking buddies in their network, had the smallest proportion of network members who actively smoked with them, reported the lowest score on the WISDM Social-Environmental Goads subscale, were the most likely to live alone, and were the least likely to live with a smoker. While these smokers reported the fewest number of stressful life events, they also reported the largest number of drinks when drinking.
Table 4.
Independent Validation Variables by Subgroup (Means, Percentages, and Between Group Differences)
| Variable | High Contact/ High Stress | Large & Supportive | Socially Disconnected | Risky Friends & Low Support | High Contact with Smokers & Light Drinkers | p |
|---|---|---|---|---|---|---|
| Living Environment | ||||||
| Live Alone (%) | 13e | 16b | 25bcej | 18c | 17j | 0.003 |
| Health and Substance-Use | ||||||
| Stressful Life Events | 184.95eg | 183.78bi | 149.24bce | 174.60cd | 156.90dgi | 0.000 |
| Drinking Days/Month | 4.20f | 5.20h | 4.71c | 7.87cdfh | 4.98d | 0.000 |
| # Drinks When Drinking | 3.59eg | 3.20 | 12.07ce | 3.62cd | 2.91dg | 0.000 |
| DSM Diagnosed Alcohol Abuse | 2.82g | 2.99i | 2.96j | 2.81d | 3.34dgij | 0.002 |
| DSM Diagnosed Drug Dependence | 4.61 | 4.79 | 4.71 | 4.81 | 4.78 | 0.325 |
| DSM Diagnosed Drug Abuse | 3.70g | 3.97 | 4.07c | 3.68cd | 4.21dg | 0.000 |
| Smoking Environment | ||||||
| Social-Environmental GOADS | 3.63e | 3.39bh | 2.62bcej | 3.90cdh | 3.48dj | 0.000 |
| Live With a Partner Who Smokes (%) | 29eg | 27bi | 8.6bcej | 28cd | 38dgij | 0.000 |
| Lives with a Non-Partner Smoker (%) | 22e | 14b | 8.2bcej | 18c | 14j | 0.003 |
| Social Network Characteristics (non-indicator) | ||||||
| Friends that Smoke | 2.79e | 2.64bh | 2.34bcej | 2.89cdfh | 2.63dj | 0.000 |
| Smoke with Participant (% of Network) | 41.09ef | 39.85bh | 15.70bcej | 47.78cdfh | 40.47dj | 0.000 |
| Smoking Buddies (% of Network) | 12.54aeg | 10.39ab | 3.25bcej | 11.35c | 8.77gi | 0.000 |
| Drinking Buddies (% of Network) | 16.88efg | 15.81bh | 6.25bcej | 26.47cdfh | 12.46dgi | 0.000 |
Note. Superscripts indicate the post-hoc pairwise comparison tests that reached ap-value of .05 or less controlling for the false discovery rate. Superscript values are as follows:
= High Contact/High Stress vs. Large and Supportive;
= Large and Supportive vs. Socially Disconnected;
= Socially Disconnected vs. Risky Friends and Low Support;
= Risky Friends and Low Support vs. High Contact with Smokers and Light Drinkers;
= High Contact/High Stress vs. Socially Disconnected;
= High Contact/High Stress vs. Risky Friends and Low Support;
= High Contact/High Stress vs. High Contact with Smokers and Light Drinkers;
= Large and Supportive vs. Risky Friends and Low Support;
= Large and Supportive vs. High Contact with Smokers and Light Drinkers;
= Socially Disconnected vs. High Contact with Smokers and Light Drinkers
Prediction of Smoking Cessation Outcomes
The social network subgroups differentially predicted short and long-term abstinence (see Table 5). Smokers in the Socially Disconnected subgroup had the highest abstinence rates at 1 week (44%) and 6 months (38%). Using the Socially Disconnected subgroup as the reference group, and adjusting for nicotine dependence, gender, race, education, and treatment, we found that the other four subgroups had significantly lower abstinence rates at 1 week. At 6 months, the Socially Disconnected subgroup still had significantly higher abstinence rates than the High Contact/High Stress (OR = 1.87, p = 0.02) and Risky Friends and Low Support (OR = 1.46, p = 0.05) subgroups. In addition, at 6 months, smokers in the High Contact with Smokers and Light Drinkers subgroup were somewhat more likely to be abstinent than smokers in the High Contact/High Stress subgroup, but this difference was not significant (OR = 1.48, p = 0.10).
Table 5.
Abstinence Rates and Logistic Regression Results Examining Social Network Subgroups on 1-week and 6-month Abstinence Controlling for Covariates (Socially Disconnected Subgroup Reference)
| 1-Week Abstinence | 6-Month Abstinence | |||||
|---|---|---|---|---|---|---|
| % abstinent | OR | p | % abstinent | OR | p | |
| (Intercept) | - | 0.786 | 0.406 | - | 0.98 | 0.952 |
| Fagestrom - Nicotine Dependence | - | 0.822 | 0.006 | - | 0.80 | 0.002 |
| # Cigs. Smoked Per Day | - | 0.995 | 0.434 | - | 0.98 | 0.009 |
| Female | - | 1.021 | 0.860 | - | 0.76 | 0.019 |
| Non-White | - | 0.492 | 0.000 | - | 0.60 | 0.001 |
| College Ed. or > | - | 1.390 | 0.014 | - | 1.52 | 0.002 |
| Treatment | - | 1.981 | 0.000 | - | 1.86 | 0.001 |
| High Contact/High Stress | 30 | 0.525 | 0.009 | 24 | 0.54 | 0.017 |
| Large & Supportive | 35 | 0.602 | 0.005 | 34 | 0.79 | 0.190 |
| Risky Friends & Low Support | 34 | 0.585 | 0.004 | 32 | 0.69 | 0.051 |
| High Contact with Smokers & Light Drinkers | 34 | 0.598 | 0.002 | 33 | 0.79 | 0.170 |
| Socially Disconnected (reference) | 44 | - | - | 38 | - | - |
| Total Sample (n = 1571) | 35 | - | - | 33 | - | - |
Social Network Subgroup Description
Table 6 displays the results from the descriptive analyses and shows that the extracted subgroups varied on important demographic, smoking, drinking, psychopathology, health, and social network variables in substantively meaningful ways. The Socially Disconnected subgroup contained the highest proportion of older and non-white individuals. These smokers had smoked for the highest number of years, and were the oldest when they started smoking daily. These smokers were also the most likely to be diagnosed with a panic attack disorder and were the least likely to live with a smoker. Socially Disconnected smokers also reported the highest proportion of supportive former smokers in their network. Smokers in the Risky Friends and Low Support subgroup were the least motivated to quit and reported the smallest proportion of supportive former smokers in their network. They were also the youngest smokers (excluding members of the High Contact/High Stress subgroup). The High Contact/High Stress subgroup appeared to be primarily composed of female smokers. Interestingly, there were no significant differences across subgroups in the number of cigarettes smoked per day, FTND scores, baseline selfefficacy, education, self-reported health, or depression.
Table 6.
Descriptive Variables by Subgroup (Means, Percentages, and Between Group Differences)
| Variable | High Contact/High Stress | Large & Supportive | Socially Disconnected | Risky Friends & Low Support | High Contact with Smokers & Light Drinkers | p |
|---|---|---|---|---|---|---|
| Demographics | ||||||
| Age | 42.aeg | 44.01abhi | 48.96bcej | 41 44cdh | 45,40dgij | 0.000 |
| Female (%) | 72.00aefg | 62.00abh | 50.00bej | 48.00dfh | 62.00dgi | 0.000 |
| Married (%) | 37.00g | 47.00 | 44.00 | 39.00d | 48.00dg | 0.055 |
| Non-White (%) | 18.00 | 14.00b | 27.00bcj | 13.00c | 17.00j | 0.000 |
| Smoking Behaviors | ||||||
| Age of Daily Smoking | 16.57ae | 17.49abhhi | 18.20bcej | 16.89ch | 17.27ij | 0.001 |
| Years Smoked | 24.38eg | 25.45bhi | 29.64bcej | 23.35cdh | 27.29dgij | 0.000 |
| #Cigs. Smoked Per Day | 21.79 | 20.85 | 21.92 | 21.99 | 21.25 | 0.462 |
| Motivation to Quit | 9.16f | 9.10b | 9.21c | 8.86cdfh | 9.14d | 0.001 |
| Self-Efficacy | 5.40 | 5.72 | 5.60 | 5.48 | 5.65 | 0.104 |
| Fagerstrom - Nicotine Dependence | 5.84a | 5.18a | 5.49 | 5.38 | 5.37 | 0.069 |
| Health and Mental Health | ||||||
| Self-Reported Health | 2.75 | 2.72h | 2.71 | 2.87dh | 2.73d | 0.105 |
| DSM Diagnosed Major Depressive Disorder | 3.98 | 4.33 | 4.33 | 4.32 | 4.33 | 0.249 |
| DSM Diagnosed Panic Attack | 3.49e | 3.71b | 4 14bcej | 3.71c | 3.68j | 0.009 |
| Social Network Characteristics (non-indicator) | ||||||
| Family (% of Network) | 37.79af | 32.53ab | 33.35c | 27.25cdfh | 35.28d | 0.000 |
| Supportive Former Smokers (% of Network) | 36.09ef | 36.25bb | 53.26bcej | 29.09cdfh | 36.74dj | 0.000 |
Note. Superscripts indicate the post-hoc pairwise comparison tests that reached p-value of ~ . 10 or less. Pairwise comparisons not reaching a p-value of .05 or less are highlighted in bold. All p-values are adjusted for the false discovery rate. Superscript values are as follows:
= High Contact/High Stress vs. Large and Supportive;
= Large and Supportive vs. Socially Disconnected;
= Socially Disconnected vs. Risky Friends and Low Support;
= Risky Friends and Low Support vs. High Contact with Smokers and Light Drinkers;
= High Contact/High Stress vs. Socially Disconnected;
= High Contact/High Stress vs. Risky Friends and Low Support;
= High Contact/High Stress vs. High Contact with Smokers and Light Drinkers;
= Large and Supportive vs. Risky Friends and Low Support;
= Large and Supportive vs. High Contact with Smokers and Light Drinkers;
= Socially Disconnected vs. High Contact with Smokers and Light Drinkers
Discussion
This research used finite mixture modeling and nine different social network characteristics to identify five distinct social network subgroups within a sample of smokers initiating a quit attempt. These empirically derived network subgroups were meaningfully associated with baseline demographic, psychiatric, and tobacco measures, as well as to smoking cessation success.
The Socially Disconnected network subgroup was associated with the highest likelihood of establishing and maintaining long-term abstinence. This subgroup had the highest probability of successful cessation at 1-week compared to all other social network subgroups. At the 6-month follow-up date, the Socially Disconnected subgroup was significantly more likely to be abstinent than the High Contact/High Stress and the Risky Friends and Low Support subgroups. These differences remained at the 1-week and 6-month marks even while controlling for individual difference factors found to be related to successful cessation in this sample (Piper et al., 2010) highlighting the social network as an independent influence on cessation success.
The Socially Disconnected networks were small and characterized by relatively little social interaction. This network environment appeared to expose members to both risk and protective factors for smoking. The Socially Disconnected subgroup was characterized by the fewest network members, few friends, living alone, and derived little emotional support from their network. These features have been linked to a failure to quit (Lawhon et al., 2009; Johnson et al., 2008; Tauras & Chaloupka, 1999), reduced likelihood of abstinence maintenance (Roski, Schmid, & Lando, 1996), persistent or “hard-core” smoking, and/or a lack of exposure to antismoking stimuli (Emery, Gilpin, Ake, Farkas, & Pierce, 2000). However, the Socially Disconnected subgroup was also characterized by the lowest proportion of smokers in the network, the lowest amount of contact with network smokers, a low number of smoking buddies, and a small proportion of network members who smoked with them. These features, in combination with relatively low levels of social stress within the network and infrequent contact with drinkers or drinking stimuli, all suggest a social environment largely insulated from many of the cardinal instigators of smoking lapse and relapse. Notably, despite the relatively low levels of emotional support characterizing the Socially Disconnected type of network, this network was characterized by the highest proportion of supportive former smokers. Ex-smokers may provide especially effective abstinent-specific support during a quit attempt (Murray, Johnston, Dolce, Lee, & O’Hara, 1995; Lawhon et al., 2009).
The low levels of reported network stress and life-event stress associated with the Socially Disconnected network may also have served as a protective feature. A lack of exposure to various forms of psychosocial or life-event stress reduces cognitive or physiological strain associated with stressful events or environments, thus decreasing maladaptive behavioral responses (e.g., smoking) needed to cope with such adversities (Childs & de Wit, 2010; Cohen & Lichtenstein, 1990; Slopen et al., 2013).
While social support is generally considered to promote smoking cessation, features of the Large and Supportive network, which included a high proportion of emotionally supportive members, did not translate into the best abstinence outcomes. For instance, this network subgroup was associated with a relatively high likelihood of marriage, a factor typically associated with positive health and behavioral outcomes (e.g., Robins & Regier, 1991; Johnson, Backlund, Sorlie, & Loveless, 2000). However, this subgroup attained lower abstinence rates than the Socially Disconnected network. While this difference may reflect a complex constellation of factors, the current findings support recent calls for a more nuanced understanding of the links between social support and cessation (see e.g., Westmaas et al., 2010). For instance, one study failed to find associations between emotional support and smoking cessation (Burns et al., 2014). Therefore, cessation success may depend on the type of social support (e.g., emotional, instrumental, abstinent-specific), source of support (e.g., partner, former smoker), timing of support, or a combination of these factors.
The High Stress/High Contact subgroup was comprised primarily of socially connected women who surrounded themselves with current smokers and heavy drinkers. Therefore, this subgroup was apparently exposed to fairly high levels of smoking related cues: i.e., drinking cues, smoking cues, and stress (Pomerleau & Pomerleau, 1991; Shiffman, 1982; Wills, 1986). This may explain the high levels of nicotine dependence and low abstinence rates associated with this type of network. The relatively high levels of stress characterizing this subgroup may also have contributed to the relatively poor smoking outcomes of individuals in this network.
The Risky Friends and Low Contact subgroup was characterized by smokers who reported many friends, but relatively little interaction with or support from these friends. In addition, this network subgroup was largely comprised of heavy drinkers and current smokers. Thus, the “friends” in these networks may have served as powerful vectors for relapse following a quit attempt, given the strong links between smoking and drinking cues and the motivation to smoke (Childs & de Wit, 2010; Shiffman, 1982; Sinha, Sinha, Li, Sinha, & Li, 2007). In addition, this network was characterized by a relatively low motivation to quit smoking, possibly compounding the effects of smoking cue exposure. This subgroup was relatively young and especially unlikely to be married, reported the largest proportion of drinking buddies, actively smoked with other network members, and reported the smallest proportion of supportive former smokers. Taken together, these features paint a picture of a network containing mainly superficial “party friends” (such as drinking buddies), with interactions likely revolving around social activities that exposed members to smoking cues and contexts (e.g., parties, bars).
Finally, the High Contact with Smokers and Light Drinkers subgroup was the largest of the five social network subgroups (35% of the sample), and was characterized by high contact with both current smokers and drinkers, but not heavy drinkers. Thus, this subgroup was likely heavily exposed to smoking and drinking contexts and cues, factors that have been strongly linked to smoking lapse and relapse (Christakis & Fowler, 2008; Hitchman et al., 2014; Richmond & Ross, 2008; Shiffman et al., 1996; Shiffman et al., 1997). Interestingly, this subgroup consumed the lowest average number of drinks when consuming alcohol compared to other subgroups, but evidenced high levels of alcohol abuse or drug abuse. It is possible that members of this subgroup had prior problems with substance use and abuse and were limiting their alcohol use as a consequence.
Causes of Indicator Coherence
One contribution of this work is that it describes the types of social networks that are commonly present amongst groups of smokers. Such knowledge might help organize our understanding of the factors that lead to cessation failure and therefore might contribute to treatment development. This raises the question of why certain sets of characteristics might reliably co-occur among smokers. For instance, why is it that certain features of the Socially Disconnected group co-occur; i.e., a lack of social contact, lack of perceived support, and a lack of contact with smokers and drinkers? Or, why is it that relatively high numbers of current smokers, heavy drinkers, and friends co-occur in the networks of the Risky Friends and Low Support smokers? It is possible that such coherence of indicators reflects multiple processes such as homophily (selection), where network members seek out similar others in predictable ways. In contrast, network members may model and reinforce certain types of behavior (e.g., substance-use) for one another. It also may be the case that broad personality characteristics serve as 3rd variables, affecting both the nature of smokers’ networks and independently affecting cessation success. This would be consistent with evidence that personality traits predict many of the relevant indicators: e.g., cessation success (e.g., Leventhal et al., 2012), drug and alcohol use, and patterns of social relationships (Asendorpf & Wilpers, 1998; Chassin, Flora, & King, 2004; Kahler et al., 2009). It is also possible that some network indicators commonly co-occur in the environmental ecology of specific types of smokers. For example, smoking and drinking typically co-occur in social settings such as bars or parties (Nichter, Nichter, Carkoglu, Lloyd-Richardson, & TERN, 2010), and smokers who frequent these events/contexts would likely be exposed to both factors. Thus, further research is needed to explicate the causal role that social network constructs play in the causal paths that affect smoking cessation outcomes.
Strengths, Limitations, and Future Directions
There are several strengths of this study, including the use of a novel clustering method to empirically identify multidimensional social network types within a sample of smokers, and the validation of the extracted subgroups with independent covariates and important distal outcomes. Examination of network types within a person-centered framework also captured multidimensional associations among network characteristics that might have escaped detection with the use of variable-centered (e.g., factor analysis, regression analysis) methods. Finally, the large sample size and prospective design afforded an excellent opportunity to characterize the nature of smokers’ social networks and explore their relations with subsequent cessation success.
Several limitations should be noted. First, although the sample size used for clustering was large (N = 1571), the extraction of mixture components and parameter estimates can be sensitive to sample size (e.g., Nylund, Asparouhov, & Muthen, 2007). Given the complexity of the modeling technique and the small percentage of individuals in some of the subgroups (specifically subgroup 1; n = 122), it is possible that the sample size affected the recovery of parameters and/or extraction of the subgroups. However, validation analyses, linking the subgroups to cessation outcomes, and the use of substantive theory as a guide for model selection supports the validity of the results. Second, the social network subgroups were based exclusively on baseline data. Therefore, this study does not address how smokers’ social networks might have changed during the quit attempt (see Bray, Smith, Piper, Roberts, & Baker, 2016). Third, the dataset included only smokers who wanted to quit smoking and participated in a longitudinal trial. Therefore, the social network subgroups extracted in this study may not apply to all smokers. Finally, the present study utilized ego-centered network data to define an individual’s social network and measure network member’s behavior. Thus, the network connections and network behaviors are based on the perceptions of the participant, rather than on reports from identified network members or objective data; therefore the data may be subject to bias arising from a common reporter (e.g., Bauman & Ennett, 1996).
Although this research highlights the vital role that exposure to smoking cues appears to play in the processes of quitting and returning to smoking, the present study does not reveal what it is about cue exposure that is so harmful. For example, is it the elicitation of drug conditioned responses, the desire to bond with other smokers by sharing the experience of smoking, or the mere availability of cigarettes? Indeed, all of these factors may be influential. In addition, while the current study examined the connection between social network subgroups and smoking cessation, it is possible that the identified subgroups are associated with other clinically relevant smoking outcomes. It would be of considerable interest to examine network associations with outcomes such as smoking reduction, dependence, treatment response, and withdrawal severity. Although many questions remain, this research does suggest that one reason that relapse may be so prevalent among some groups of smokers is that risk factors densely co-occur in their networks, with some networks conveying exposure to drinking cues, observation of smoking, and cigarette availability. Such exposure appears to be toxic despite the presence of other factors that might, in theory, mitigate this effect (e.g., perceived social support, low stress, a large network, substantial interaction with network members). Thus, this research with its focus on the social environment of a smoker, suggests, ironically, that certain drug cues are inextricably connected to the social ecology of some smokers and may be critical determinants of cessation outcome above and beyond individual characteristics typically identified as focal risk factors for cessation failure.
Conclusion
The present study characterizes the types of social networks found among smokers prior to a quit attempt, revealing both the heterogeneity of smokers’ social milieus, and the fact that different networks convey very different patterns of exposure to risk and protective factors for smoking cessation. In particular, network subgroups characterized by high levels of exposure to smoking and drinking cues were associated with an especially high likelihood of smoking cessation failure. Future research should explore the mechanisms via which network membership confers risk (e.g., enhanced cue-induced craving) and the extent to which network membership conveys risk information not available from individual risk variables.
Supplementary Material
Acknowledgments
This research was supported by grant P50 DAO 19706 from the National Institute on Drug Abuse and by grant M01 RR03186 from the General Clinical Research Centers Program of the National Center for Research Resources awarded to Michael Fiore and Timothy B. Baker.
Footnotes
Preliminary results contained in the current manuscript were previously disseminated at the 27th and 28th annual convention for the Association for Psychological Science, and the 22nd and 23rd annual meeting for the Society for Prevention Research.
The k-means initialization procedure in teigen derives initialization values from a k-means clustering procedure and utilizes the parameter estimates derived from the k-means analysis as starting values in the ECM algorithm.
The final selected model had an entropy of 0.93. Therefore, it was deemed appropriate to utilize a classify-analyze approach to subgroup assignment.
The degrees of freedom (df) parameter controls the mass and length of the tails of the Student /-distribution. When the df are small the distribution lias heavier tails. When the df are large, the Student t resembles the normal distribution.
Contributor Information
Albert J. Burgess-Hull, Human Development and Family Studies, School of Human Ecology, University of Wisconsin-Madison
Linda J. Roberts, Human Development and Family Studies, School of Human Ecology, University of Wisconsin-Madison
Megan E. Piper, Center for Tobacco Research and Intervention, University of Wisconsin-Madison
Timothy B. Baker, Center for Tobacco Research and Intervention, University of Wisconsin-Madison
References
- Altergott K (1985). Marriage, gender, and social relations in late life. Social Bonds in Later Life, 51–70. [Google Scholar]
- Andrews JL, & McNicholas PD (2012). Model-based clustering, classification, and discriminant analysis via mixtures of multivariate t-distributions. Statistics and Computing, 22(5), 1021–1029. [Google Scholar]
- Andrews JL & McNicholas PD (2014). teigen: Model-based clustering and classification with the multivariate t-distribution. R package version 2. [Google Scholar]
- Asendorpf JB, & Wilpers S (1998). Personality effects on social relationships. Journal of personality and social psychology, 74(6), 1531. [Google Scholar]
- Bauer DJ, & Curran PJ (2003). Distributional assumptions of growth mixture models: implications for over extraction of latent trajectory classes. Psychological methods, 5(3), 338. [DOI] [PubMed] [Google Scholar]
- Bauman KE, & Ennett ST (1996). On the importance of peer influence for adolescent drug use: commonly neglected considerations. Addiction, 91(2), 185–98. [PubMed] [Google Scholar]
- Benjamini Y, & Hochberg Y (1995). Controlling the False Discovery Rate: A Practical and Powerful Approach to Multiple Testing. Journal of the Royal Statistical Society. Series B Methodological). WileyRoyal Statistical Society, 10.2307/2346101 [DOI] [Google Scholar]
- Berkman LF, & Glass T (2000). Social integration, social networks, social support and health In Berkman LF & Kawachi I (Eds.), Social Epidemiology (pp. 137–173). Oxford University Press. [Google Scholar]
- Berkman LF, Glass T, Brissette I, & Seeman TE (2000). From social integration to health: Durkheim in the new millennium. Social Science & Medicine, 51(6), 843–857. [DOI] [PubMed] [Google Scholar]
- Berkman LF, & Syme SL (1979). Social networks, host resistance, and mortality: A nine-year follow-up study of Alameda County residents. American Journal of Epidemiology, 109(2), 186–204. [DOI] [PubMed] [Google Scholar]
- Bray BC, Smith RA, Piper ΜE, Roberts LJ, & Baker TB (2016). Transitions in Smokers’ Social Networks after Quit Attempts: A Latent Transition Analysis. Nicotine & Tobacco Research, ntwl73. [DOI] [PMC free article] [PubMed] [Google Scholar]
- Burns RJ, Rothman AJ, Fu SS, Lindgren B, & Joseph AM (2014). The relation between social support and smoking cessation: Revisiting an established measure to improve prediction. Annals of Behavioral Medicine, 47(3), 369–375. [DOI] [PMC free article] [PubMed] [Google Scholar]
- Cahill K, Stevens S, Perera R, & Lancaster T (2013). Pharmacological interventions for smoking cessation: an overview and network meta-analysis. The Cochrane Library, 2013(5), 1–52. doi: 10.1002/14651858.CD009329.pub2. [DOI] [PMC free article] [PubMed] [Google Scholar]
- Carey ΜP, Kalra DL, Carey KB, Halperin S, & Richards CS (1993). Stress and unaided smoking cessation: a prospective investigation. Journal of Consulting and Clinical Psychology, 61(5), 831. [DOI] [PubMed] [Google Scholar]
- Centers for Disease Control and Prevention (2011). Quitting smoking among adults—United States, 2001 −2010. MMWR. Morbidity and Mortality Weekly Report, 60(44), 1513. [PubMed] [Google Scholar]
- Chassin L, Flora DB, & King KM (2004). Trajectories of alcohol and drug use and dependence from adolescence to adulthood: the effects of familial alcoholism and personality. Journal of abnormal psychology, 113(4), 483. [DOI] [PubMed] [Google Scholar]
- Chassin L, Presson CC, Pitts SC, & Sherman SJ (2000). The natural history of cigarette smoking from adolescence to adulthood in a midwestern community sample: Multiple trajectories and their psychosocial correlates. Health Psychology, 19(2), 223. [PubMed] [Google Scholar]
- Childs E, & De Wit H (2010). Effects of acute psychosocial stress on cigarette craving and smoking. Nicotine & Tobacco Research, 12(A), 449–453. [DOI] [PMC free article] [PubMed] [Google Scholar]
- Christakis NA, & Fowler JH (2008). The collective dynamics of smoking in a large social network. New England Journal of Medicine, 555(21), 2249–2258. [DOI] [PMC free article] [PubMed] [Google Scholar]
- Cohen S (2004). Social relationships and health. American Psychologist, 59(8), 676. [DOI] [PubMed] [Google Scholar]
- Cohen S, & Lemay EP (2007). Why would social networks be linked to affect and health practices? Health Psychology, 26(4), 410. [DOI] [PubMed] [Google Scholar]
- Cohen S, & Lichtenstein E (1990). Perceived stress, quitting smoking, and smoking relapse. Health Psychology, 9(4), 466. [DOI] [PubMed] [Google Scholar]
- Emery S, Gilpin EA, Ake C, Farkas AJ, & Pierce JP (2000). Characterizing and identifying “hard-core” smokers: Implications for further reducing smoking prevalence. American Journal of Public Health, 90(3), 387. [DOI] [PMC free article] [PubMed] [Google Scholar]
- Fiore MC, Jaen CR, Baker T, Bailey WC, Benowitz NL, Curry SEEA, ... & Henderson PN (2008). Treating tobacco use and dependence: 2008 update. Rochblle, MD: US Department of Health and Human Services. [Google Scholar]
- Forster MR (2000). Key concepts in model selection: Performance and generalizability. Journal of mathematical psychology, 44(1), 205–231. [DOI] [PubMed] [Google Scholar]
- Forster MR (2002). Predictive accuracy as an achievable goal of science. Philosophy of Science, 69(S3), S124–S134. [Google Scholar]
- US Department of Health and Human Services. (2014). The health consequences of smoking— 50 years of progress: a report of the surgeon general. Atlanta, GA: Centers for Disease Control and Prevention. [Google Scholar]
- Hanson BS (1994). Social network, social support and heavy drinking in elderly men-a population study of men born in 1914, Malmo, Sweden. Addiction, 89(6), 725–732. [DOI] [PubMed] [Google Scholar]
- Hawkins J, Hollingworth W, & Campbell R (2010). Long-term smoking relapse: A study using the British household panel survey. Nicotine & tobacco research, 72(12), 1228–1235. [DOI] [PubMed] [Google Scholar]
- Heatherton TF, Kozlowski LT, Frecker RC, & FAGERSTROM KO (1991). The Fagerstrom test for nicotine dependence: a revision of the Fagerstrom Tolerance Questionnaire. British journal of addiction, 86(9), 1119–1127. [DOI] [PubMed] [Google Scholar]
- Hitchman SC, Fong GT, Zanna ΜP, Thrasher JF, & Laux FL (2014). The relation between number of smoking friends, and quit intentions, attempts, and success: Findings from the International Tobacco Control (ITC) Four Country Survey. Psychology of Addictive Behaviors, 28(4), 1144. [DOI] [PMC free article] [PubMed] [Google Scholar]
- Hobson CJ, Kamen J, Szostek J, Nethercut CM, Tiedmann JW, & Wojnarowicz S (1998). Stressful life events: A revision and update of the social readjustment rating scale. International Journal of Stress Management, 5(1), 1–23. [Google Scholar]
- Hoffman BR, Sussman S, Unger JB, & Valente TW (2006). Peer influences on adolescent cigarette smoking: A theoretical review of the literature. Substance Use & Misuse, 77(1), 103–155. [DOI] [PubMed] [Google Scholar]
- Hughes JR, Keely J, & Naud S (2004). Shape of the relapse curve and long-term abstinence among untreated smokers. Addiction, 99(1), 29–38. [DOI] [PubMed] [Google Scholar]
- Johnson DA, Alexander G, Kapke A, McClure J, Wiese C, Greene S, & Strecher V (2008). Abstract PS 1–28: The Relationship of Social Support and Smoking Cessation Among African Americans Enrolled in the Project Quit Study. Clinical Medicine & Research, 6(3–4), 137–137. [Google Scholar]
- Johnson NJ, Backlund E, Sorlie PD, & Loveless CA (2000). Marital status and mortality: The national longitudinal mortality study. Annals of epidemiology, 10(4), 224–238. [DOI] [PubMed] [Google Scholar]
- Kahler CW, Daughters SB, Leventhal AM, Rogers ML, Clark MA, Colby SM, ... & Buka SL (2009). Personality, psychiatric disorders, and smoking in middle-aged adults. Nicotine & Tobacco Research, 11(7), 833–841. [DOI] [PMC free article] [PubMed] [Google Scholar]
- Kenford SL, Fiore MC, Jorenby DE, Smith SS, Wetter D, & Baker TB (1994). Predicting smoking cessation: who will quit with and without the nicotine patch. JAMA, 271(8), 589–594. [DOI] [PubMed] [Google Scholar]
- Kessler RC, & Gstun TB (2004). The world mental health (WMH) survey initiative version of the world health organization (WHO) composite international diagnostic interview (CIDI). International Journal of Methods in Psychiatric Research, 13(2), 93–121. [DOI] [PMC free article] [PubMed] [Google Scholar]
- Kobus K (2003). Peers and adolescent smoking. Addiction, 98(s1), 37–55. [DOI] [PubMed] [Google Scholar]
- Laska MN, Pasch KE, Lust K, Story M, & Ehlinger E (2009). Latent class analysis of lifestyle characteristics and health risk behaviors among college youth. Prevention Science, 10(4), 376–386. [DOI] [PMC free article] [PubMed] [Google Scholar]
- Lawhon D, Humfleet GL, Hall SM, Reus VI, & Munoz RF (2009). Longitudinal analysis of abstinence-specific social support and smoking cessation. Health Psychology, 28(4), 465. [DOI] [PubMed] [Google Scholar]
- Leventhal AM, Japuntich SJ, Piper ME, Jorenby DE, Schlam TR, & Baker TB(2012). Isolating the role of psychological dysfunction in smoking cessation: Relations of personality and psychopathology to attaining cessation milestones. Psychology of Addictive Behaviors, 26(4), 838. [DOI] [PMC free article] [PubMed] [Google Scholar]
- Meng XL, & Rubin DB (1993). Maximum likelihood estimation via the ECM algorithm: A general framework. Biometrika, 80(2), 267–278. [Google Scholar]
- Murray RP, Johnston JJ, Dolce JJ, Lee WW, & O’Hara P (1995). Social support for smoking cessation and abstinence: The Lung Health Study. Addictive behaviors, 20(2), 159–170. [DOI] [PubMed] [Google Scholar]
- Muthen B (2001). Latent variable mixture modeling In Marcoulides GA & Schumacker RE (Eds.), New developments and techniques in structural equation modeling (pp. 1–33), Psychology Press. [Google Scholar]
- Muthen B (2003). Statistical and substantive checking in growth mixture modeling: Comment on Bauer and Curran (2003). Psychological methods, 5(3), 369–377. [DOI] [PubMed] [Google Scholar]
- Muthen LK, & Muthen BO (1998–2015). Mplus User’s Guide. Seventh Edition Los Angeles, CA: Muthen & Muthen. [Google Scholar]
- Nichter M, Nichter M, Carkoglu A, Lloyd-Richardson E, & Tobacco Etiology Research Network. (2010). Smoking and drinking among college students: “It’s a package deal”. Drug and alcohol dependence, 106(1), 16–20. [DOI] [PubMed] [Google Scholar]
- Nylund KL, Asparouhov T, & Muthen BO (2007). Deciding on the number of classes in latent class analysis and growth mixture modeling: A Monte Carlo simulation study. Structural Equation Modeling, 14(4), 535–569. [Google Scholar]
- Ockene JK, Benfari RC, Nuttall RL, Hurwitz I, & Ockene IS (1982). Relationship of psychosocial factors to smoking behavior change in an intervention program. Preventive Medicine, 77(1), 13–28. [DOI] [PubMed] [Google Scholar]
- Peel D, & McLachlan GJ (2000). Robust mixture modelling using the t distribution. Statistics and Computing, 10 (4), 339–348. [Google Scholar]
- Pomerleau OF, & Pomerleau CS (1991). Research on stress and smoking: Progress and problems. British Journal of Addiction, 86(5), 599–603. [DOI] [PubMed] [Google Scholar]
- Piper ME, Cook JW, Schlam TR, Jorenby DE, Smith SS, Bolt DM, & Loh WY (2010). Gender, race, and education differences in abstinence rates among participants in two randomized smoking cessation trials. Nicotine & Tobacco Research, 12(6), 647–657. [DOI] [PMC free article] [PubMed] [Google Scholar]
- Piper ME, Piasecki TM, Federman EB, Bolt DM, Smith SS, Fiore MC, & Baker TB (2004). A multiple motives approach to tobacco dependence: The Wisconsin Inventory of Smoking Dependence Motives (WISDM-68). Journal of Consulting and Clinical Psychology, 72(2), 139. [DOI] [PubMed] [Google Scholar]
- Piper ME, Smith SS, Schlam TR, Fiore MC, Jorenby DE, Fraser D, & Baker TB (2009). A randomized placebo-controlled clinical trial of 5 smoking cessation pharmacotherapies. Archives of General Psychiatry, 66(11), 1253–1262. [DOI] [PMC free article] [PubMed] [Google Scholar]
- R Core Team (2014). R: A language and environment for statistical computing. R Foundation for Statistical Computing, Vienna, Austria: URL http://www.R-project.org. [Google Scholar]
- Richmond CA, & Ross NA (2008). Social support, material circumstance and health behaviour: Influences on health in First Nation and Inuit communities of Canada. Social Science & Medicine, 67(9), 1423–1433. [DOI] [PubMed] [Google Scholar]
- Robins LN , & Regier DA (1991). Psychiatric disorders in America: The epidemiologic catchment area study. New York, NY: The Free Press. [Google Scholar]
- Room R (2004). Smoking and drinking as complementary behaviours. Biomedicine & Pharmacotherapy, 58(2), 111–115. [DOI] [PubMed] [Google Scholar]
- Rosenquist JN, Murabito J, Fowler JH, & Christakis NA (2010). The spread of alcohol consumption behavior in a large social network. Annals of Internal Medicine, 152(7), 426–433. [DOI] [PMC free article] [PubMed] [Google Scholar]
- Roski J, Schmid LA, & Lando HA (1996). Long-term associations of helpful and harmful spousal behaviors with smoking cessation. Addictive Behaviors, 21(2), 173–185. [DOI] [PubMed] [Google Scholar]
- Shiffman S (1982). Relapse following smoking cessation: A situational analysis. Journal of Consulting and Clinical Psychology, 50(1), 71. [DOI] [PubMed] [Google Scholar]
- Shiffman S, Hickcox M, Paty JA, Gnys M, Richards T, & Kassel JD (1997). Individual differences in the context of smoking lapse episodes. Addictive Behaviors, 22(6), 797–811. [DOI] [PubMed] [Google Scholar]
- Shiffman S, Paty JA, Gnys M, Kassel JA, & Hickcox M (1996). First lapses to smoking: Within-subjects analysis of real-time reports. Journal of Consulting and Clinical Psychology, 64(2), 366. [DOI] [PubMed] [Google Scholar]
- Sinha R, Sinha R, Li CSR, Sinha R, & Li CSR (2007). Imaging stress-and cue-induced drug and alcohol craving: Association with relapse and clinical implications. Drug and Alcohol Review, 26( 1), 25–31. [DOI] [PubMed] [Google Scholar]
- Slopen N, Kontos EZ, Ryff CD, Ayanian JZ, Albert MA, & Williams DR (2013). Psychosocial stress and cigarette smoking persistence, cessation, and relapse over 9–10 years: A prospective study of middle-aged adults in the United States. Cancer Causes & Control, 24(10), 1849–1863. [DOI] [PMC free article] [PubMed] [Google Scholar]
- Sober E (2002). Instrumentalism, parsimony, and the Akaike framework. Philosophy of Science, 69(S3), S112–S123. [Google Scholar]
- Stroebe W, & Stroebe M (1996). The social psychology of social support. New York, NY: Guilford Press. [Google Scholar]
- Tauras JA, & Chaloupka FJ (1999). Determinants of smoking cessation: An analysis of young adult men and women (No. w7262). National Bureau of Economic Research. [Google Scholar]
- Tofighi D, & Enders CK (2008). Identifying the correct number of classes in growth mixture models Advances in latent variable mixture models, (pp. 317–341). Information Age Publishing, Inc. [Google Scholar]
- Uebersax JS (2000). A brief study of local maximum solutions in latent class analysis. Retrieved from http://www.john-uebersax.com/stat/local.htm
- Urberg KA, Degirmencioglu SM, & Pilgrim C (1997). Close friend and group influence on adolescent cigarette smoking and alcohol use. Developmental Psychology, 33(5), 834. [DOI] [PubMed] [Google Scholar]
- Valente TW, Ritt-Olson A, Stacy A, Unger JB, Okamoto J, & Sussman S (2007). Peer acceleration: Effects of a social network tailored substance abuse prevention program among high-risk adolescents. Addiction, 702(11), 1804–1815. [DOI] [PubMed] [Google Scholar]
- Vermunt JK (2010). Latent Class Modeling with Covariates: Two Improved Three-Step Approaches. Political Analysis, 75(4), 450–469. [Google Scholar]
- Von Bertalanffy L (1956). General system theory. General systems, 7(1), 11–17. [Google Scholar]
- Westmaas JL, Bontemps-Jones J, & Bauer JE (2010). Social support in smoking cessation: reconciling theory and evidence. Nicotine & Tobacco Research, ntq077. [DOI] [PubMed] [Google Scholar]
- Wills TA (1986). Stress and coping in early adolescence: Relationships to substance use in urban school samples. Health Psychology, 5(6), 503. [DOI] [PubMed] [Google Scholar]
Associated Data
This section collects any data citations, data availability statements, or supplementary materials included in this article.