

Abstract
Type 2 alternative NADH dehydrogenases (NDH‐2) participate indirectly in the generation of the electrochemical proton gradient by transferring electrons from NADH and NADPH into the ubiquinone pool. Due to their structural simplicity, alternative NADH dehydrogenases have been proposed as useful tools for gene therapy of cells with defects in the respiratory complex I. In this work, we report the presence of three open reading frames, which correspond to NDH‐2 genes in the genome of Ustilago maydis. These three genes were constitutively transcribed in cells cultured in YPD and minimal medium with glucose, ethanol, or lactate as carbon sources. Proteomic analysis showed that only two of the three NDH‐2 were associated with isolated mitochondria in all culture media. Oxygen consumption by permeabilized cells using NADH or NADPH was different for each condition, opening the possibility of posttranslational regulation. We confirmed the presence of both external and internal NADH dehydrogenases, as well as an external NADPH dehydrogenase insensitive to calcium. Higher oxygen consumption rates were observed during the exponential growth phase, suggesting that the activity of NADH and NADPH dehydrogenases is coupled to the dynamics of cell growth.
Keywords: alternative NAD(P)H dehydrogenases, corn smut fungi, electron transport chain, gene expression, NADH/NADPH quinone oxidoreductase, Ustilago maydis
Abbreviations
- 6PGD
6 phosphogluconate dehydrogenase
- Aox
alternative oxidase
- EtOH‐DH
ethanol dehydrogenase
- EtOH‐mm
ethanol minimal medium
- Fum
fumarate
- G3P‐DH
glycerol 3‐phosphate dehydrogenase
- G6P‐DH
glucose 6‐phosphate dehydrogenase
- Glc‐mm
glucose minimal medium
- HK
hexokinase
- HK
hexokinase
- Lac‐DH
lactate dehydrogenase
- Lac‐mm
lactate minimal medium
- Mal
malate
- NDH‐2
alternative NADH dehydrogenases
- OAA
oxaloacetate
- PFK‐1
phosphofructokinase 1
- PK
pyruvate kinase
- Pyr
pyruvate
- Succ
succinate
- YPD
yeast extract, peptone, and dextrose medium
Type 2 NADH dehydrogenases (NDH‐2) are alternative respiratory components that allow a cellular response to different environmental conditions 1. NDH‐2 have molecular masses of about 50–60 kDa, and they are typically attached to both sides of the inner mitochondrial membrane. These proteins are insensitive to rotenone but sensitive to flavone 2, 3. As NDH‐2 do not pump protons (H+) across the membrane, they have no direct participation in the generation of the proton electrochemical gradient 4, 5; however, NDH‐2 allow the transfer of electrons from NADH and NADPH into the respiratory chain, supporting the synthesis of ATP 6, 7.
The presence of alternative components such as NDH‐2 in the electron transport chain was first described in mitochondria of plants and fungi, and later, they were found in the plasma membrane of several Eubacteria and Archaea 8. Transcripts of these alternative elements were also present in animals from marine environments 9. The 3‐D structure of the Saccharomyces cerevisiae internal NADH dehydrogenase (scNdi1) corresponds to a homodimeric protein, with a hydrophobic region that allows its binding to the membrane 10, 11. A similar structure was described for Caldalkalibacillus thermarum's NDH‐2 12. Besides scNdi1, S. cerevisiae has two additional alternative components: the external NADH dehydrogenases scNde1 and scNde2 13, 14. It has been shown that scNdi1 is part of respiratory supercomplexes 15, 16, similar to the respirasomes described in mitochondria of plant, fungi, and animal cells 17, 18, 19. An understanding of NDH‐2 is of great importance because they are potential targets of pharmacological agents against parasites of animals and plants that became resistant to traditional antibiotics 20, 21, 22. On the other hand, scNdi1 has also been proposed for gene therapy to rescue cells with defects in complex I 23, 24, 25 .
In Ustilago maydis, a phytopathogenic fungus of Zea mays which establishes a biotrophic relationship with the plant, the presence of at least one external and one internal NDH‐2 has been described, as well as an alternative oxidase (Aox) 26.
Through an in silico analysis, three open reading frames for NDH‐2 were found in U. maydis genome. The three predicted amino acid sequences (um02164, um03669, and um11333) contained two Rossman fold domains and two glycine‐rich motifs for the binding of NAD(P)H and FAD. One of these enzymes (um03669) shows a putative calcium binding domain. To evaluate the activity of NDH‐2s in U. maydis, oxygen consumption assays were performed in permeabilized cells cultured under glycolytic (glucose) or gluconeogenic (ethanol and lactate) growth conditions 27. The results showed the presence of rotenone‐insensitive NADH dehydrogenase activity on both sides of the inner mitochondrial membrane and an external NADPH dehydrogenase activity. Under all conditions, NDH‐2 activities were higher at the exponential phase than in the stationary phase of the growth curve. There was no activation by calcium of the alternative NADPH dehydrogenase under any condition. Transcripts of the three genes were expressed in all culture conditions, but only two of the three NDH‐2 proteins (um03669 and um02164) were found in mitochondria. Oxygen consumption rates with NADH or NADPH were different in the two growth phases of the cells.
Materials and methods
Materials
Analytical grade reagents were purchased from Sigma Chemical Co. (St. Louis, MO, USA), Bio‐Rad (Hercules, CA, USA), Agilent Technologies (La Jolla, CA, USA), Axygen Biosciences (Union City, CA, USA), and Millipore (Billerica, MA, USA). Ustilago maydis ATCC 201384 FB2 was obtained from the American Type Cell Collection (Manassas, VA, USA).
Bioinformatic methods
To obtain the NDH‐2 sequences of U. maydis, a protein BLAST 28 in the U. maydis database (https://www.helmholtz-muenchen.de/ibis/institute/groups/fungal-microbial-genomics/resources/mumdb/index.html) was performed. Multiple sequence alignment of the NDH‐2 amino acid sequences was carried out with Clustal X 29. Pairwise identities were calculated by local sequence alignment, using SIM (http://ca.expasy.org/tools/sim-prot.html), with a gap open penalty of 12, a gap extension penalty of 4, and BLOSUM62 as the comparison matrix. MITOPROT was used for the prediction of mitochondrial signal peptides 30.
Strains and cell cultures
Ustilago maydis strains were grown at 28 °C in either rich YPD medium (1.0% glucose, 0.25% peptone, and 0.5% yeast extract) or minimal medium (mm) supplemented with different carbon sources (1.0% glucose, 0.4% ethanol, or 1.0% lactate), and 0.3% ammonium sulfate as the nitrogen source, and supplemented with 1x salt solution 31. In all cases, cells were cultured in 100 mL of YPD medium for 18–24 h, harvested by centrifugation at 1000 g, and washed twice with sterile H2O, and the final suspension was used to inoculate 1 L of medium with 4.5 × 10⁸ cells (initial OD of 0.02 at 600 nm). Cells were harvested at the exponential or stationary phases of growth and suspended in distilled H2O at a final ratio of 1 mL·g−1 wet weight. Cell growth was followed by measuring the optical density at 600 nm.
Cell permeabilization and oxygen consumption
Plasma membrane permeabilization was achieved by incubation of U. maydis cells with 0.03% of digitonin for approximately 1 min inside the Clark electrode chamber, as described by Vercesi 27 and Robles‐Martínez 32. All experiments were carried out in KME buffer (100 mm KCl, 50 mm Mops/KOH, and 0.5 mm EGTA, pH 7.4). Oxygen consumption was measured in a 1.5 mL chamber at 30 °C, using a Clark‐type electrode connected to an YSI5300A biological oxygen monitor. The assays were carried out using 5 to 10 mg of cells (wet weight), and after the experiment, an aliquot of the cell suspension was used to obtain the dry weight. NADH, NADPH, pyruvate–malate, succinate, ethanol, glycerol‐3‐phosphate, and lactate were used as substrates.
Mitochondria isolation
The method described by Sierra‐Campos 33 was used with minor modifications: Cells were collected by centrifugation at 5000 g for 5 min, 4 °C and washed twice with lysis buffer (20 mm Tris/HCl, 330 mm sucrose, 2 mm EDTA, 1 mm EGTA, 100 mm KH2PO4) and the final pellets resuspended in 1 mL of the lysis supplemented with 0.2% BSA, 0.5 mm β‐mercaptoethanol, and 1 mm PMSF. Rupture of the cells was performed at 4 °C by a mechanical method, using a Mini‐Bead Beater with glass beads of 0.5 μm of diameter. To avoid damage of mitochondria, four cycles of 30 s were selected for the rupture, with 2 min pauses on ice. The crude extract was centrifuged at 5000 g for 10 min at 4 °C. The supernatant was recovered and centrifuged at 10 000 g for 10 min at 4 °C, and the mitochondrial pellet was suspended in a small volume of lysis buffer and kept at −70 °C.
Enzyme assays
The activities of glycolytic enzymes were determined as described by Saavedra et al. 34.
Determination of protein concentration
Protein concentration was determined as described by Lowry et al., using bovine serum albumin (BSA) as standard.
Sodium dodecyl sulfate polyacrylamide gel electrophoresis
Mitochondrial proteins were resolved by SDS/PAGE on 10% (w/v) polyacrylamide slab gels 35.
Tandem mass spectrometry (LC/ESI‐MS/MS)
Mitochondrial samples were subjected to electrophoresis, and both the whole lane and a piece of the gel containing bands between 30 and 90 kDa were sent to the Proteomics Core Facility at the University of Arizona, USA, where the proteins associated with mitochondria were identified with 99.9% confidence.
RNA extraction and RT‐PCR
To measure the RNA expression of um11333, um02164, and um03669, cells grown under the different culture conditions were harvested at the stationary phase (24 h for Glc, YPD, and EtOH, and 150 hrs for lactate), followed by RNA purification using the AxyPrep Multisource Total RNA Miniprep Kit (Axygen Biosciences). One microgram of total RNA was reverse transcribed using the protocol for gene‐specific of the iScriptTM Select cDNA Synthesis Kit. The U. maydis actin gene was used as endogenous control. Primers used for the cDNA synthesis and RT‐PCR are shown in Table 1.
Table 1.
Primers used for the cDNA synthesis and the amplification of each U. maydis NDH‐2 transcript. After the extraction of total RNA from cells, cDNA was synthetized with the cDNA primers, following the protocol for gene‐specific described in iScriptTM Select cDNA Synthesis Kit®. Next, the forward and reverse primers were used to amplify short regions (200 bp) of each cDNA
| Primers | cDNA | Forward DNA | Reverse DNA |
|---|---|---|---|
| um11333 | 5′‐AGGACGAGTCCAACAAGGAC‐3′ | 5′‐AGGACGAGTCCAACAAGGAC‐3′ | 5′‐GACCCTGGTGTGTGTACTGG‐3′ |
| um02164 | 5′‐TTATCTCGCCGCACAACTAC‐3′ | 5′‐TTATCTCGCCGCACAACTAC‐3′ | 5′‐TCGCTCCTATCCTCGAAAGT‐3′ |
| um03669 | 5′‐CTAGGCAGCATGTACGCACT‐3′ | 5′‐CTAGGCAGCATGTACGCACT‐3′ | 5′‐CGTCGTACTGGTCAAACACC‐3′ |
| Actin | 5′‐TTAGAAGCACTTGCGGTGCACG‐3′ | 5′‐GACTTGGACATCCGAAAGGA‐3 | 5′‐TTCGAGATCCACATCTGCTG‐3′ |
Statistical analysis
To evaluate the significance of the differences between the distinct groups, a one‐way or two‐way ANOVA were applied to the data. The one‐way ANOVA was used when growth conditions (YPD, Glc‐mm, Lac‐mm, and EtOH‐mm) were tested against each respiratory substrate. The two‐way ANOVA considered two factors, growth conditions and expression of each mRNA for the PCR experiment, and growth conditions and growth phase for the activity of each respiratory substrate.
Results and Discussion
In a previous work, some of the components of the respiratory chain of U. maydis mitochondria were identified using permeabilized cells 33, 36. The activity of both rotenone‐insensitive external and internal NADH dehydrogenase was described. In addition, low activities associated with both glycerol 3‐phosphate and NADPH dehydrogenases were found. Activities for lactate or alcohol dehydrogenase were not detected. Here, we analyzed the expression of some of these enzymes in cells grown under different conditions and at different stages of the growth curve.
Bioinformatic analyses
To determine the number of NDH‐2 genes present in the U. maydis genome, a basic local alignment search (BLAST) was performed (https://blast.ncbi.nlm.nih.gov). The amino acid sequence of the internal NADH dehydrogenase (scNdi1) of S. cerevisiae was used as a query. We found three putative open reading frames for NDH‐2, UM02164, UM3669, and UM1133. We found that the protein with the highest similarity to scNdi1 was um02164, with a value of 51%, and an identity of 34%; the other two amino acid sequences showed identities higher than 25% and similarities above 40%. MITOPROT (http://ihg.gsf.de/ihg/mitoprot.html) analysis of these three sequences showed the presence of mitochondrial signal peptides in each protein. The probability of exporting to mitochondria was 0.8972, 0.9896, and 0.9940 for um11333, um02164, and um03669, respectively. The alignment of 12 NDH‐2 sequences from fungi and one from plants (Solanum tuberosum NDB1soltu) revealed the high conservation of the two nucleotide binding motifs (Fig. 1A,B). The amino acid residues required for the binding of NADH and NADPH are highlighted in Fig. 2. In both um02164 and um11333 sequences, the classic acidic motif (EA) is present, and these enzymes might have NADH dehydrogenase activity, while um03669 has nonacidic amino acid residues (QS), suggesting that only this isoform might have both NADH and NADPH dehydrogenase activities as suggested by Desplats 37, Blaza 38, and Meng‐Shu 39.
Figure 1.

Multiple alignment using 13 NDH‐2 sequences. The first three sequences (klNDI1, klNDE1, klNDE2) correspond to Kluyveromyces lactis NDH‐2. The next three (scNde1, scNde2, and scNdi1) are the NDH‐2 of Saccharomyces cerevisiae. The following three sequences correspond to the three NDH‐2 of U. maydis (um11333, um2164, and um3669). The next three sequences correspond to Neurospora crassa NDH‐2 (ncNdi1, ncNde1, ncNde2). Finally, the last sequence corresponds to an NDH‐2 of Solanum tuberosum. The alignment was performed using Clustall W2 (http://www.ebi.ac.uk/Tools/msa/clustalw2). Symbols: ‘*’, the amino acid is conserved in all sequences; ‘:’, the amino acid type is conserved; ‘.’, the amino acid profile is preserved. In both panels, the glycine‐rich motifs are highlighted with blue boxes. Hydrophobic amino acids are colored yellow, residues with negative charge in red, residues with a hydroxyl group in purple, and proline and cysteine in white. Shaded in gray inside the third blue box are placed the amino acid with negative charge (D or E) or with a carboxamide group (N or Q) proposed by Desplats 37 as acidic or no acidic sequences that discriminate the activity of NADH or NADPH dehydrogenase. The um03669 sequence is colored green.
Figure 2.

Multiple sequence alignment for the calcium binding domain (CBD). The amino acids involved in Ca2+‐binding are in bold type and highlighted; those that contribute with the main‐chain carbonyl oxygen are shaded in gray, as proposed by Graberek 46. Hydrophobic amino acids are colored in yellow, the residues with a positive charge in blue, with a negative charge in red, and with a hydroxyl group in purple. Calcium binding has been experimentally determined in the four mammalian proteins (calcyclin, calmodulin, myosin_RLC, and myosin_ELC); in addition, 4 fungal sequences (klNde2, um03669, ncNdi1, ncNde1) and the sequence of the plant Solanum tuberosum (NDB1_SOLTU) are shown.
The protein um03669 is grouped in the NDH‐2 B clade 5, 40, contains a putative calcium binding domain (CBD) (Fig. 2) with similarity to the CBD of other fungal (Kluyveromyces lactis and Neurospora crassa, klNDE2 and nceNd1), and plant (Solanum tuberosum, NDB1_SOLTU) NDH‐2s, where activation by calcium has been proposed 41, 42, 43, 44. However, activation by calcium was not detected in klNDE2 45. Another case in which the presence of a putative calcium binding domain was not associated with calcium activation is the NDH‐2 of Plasmodium falciparum (pfNDH‐2) 46. Interestingly, the um03669, as well as the other three fungal sequences analyzed in Fig. 2, lack the two essential negative residues and the hydroxylated amino acid residue required for calcium binding. These residues correspond to the z and x positions in the loop for the Ca2+ binding domain, defined by the X—Y‐Z—Y–X–Z motif 47.
Cell growth in different media
To study the expression and role of the three rotenone‐resistant dehydrogenases from U. maydis, growth curves were obtained under the following culture conditions: YPD, glucose minimal (Glc‐mm), ethanol minimal (EtOH‐mm), and lactate minimal (Lac‐mm) media. When cells were cultured in YPD, Glc‐mm, or EtOH‐mm, the stationary phase was reached at about 24 h after inoculation (Fig. S1 and 26). As shown in Fig. S2, the concentration of glucose in the culture medium was still high after 24 h of growth. In contrast, for cells grown with other gluconeogenic carbon sources such as Lact‐mm, the stationary phase was reached at around 150 h (Fig. S1 and 26). YPD was the best condition for cell growth, with the highest biomass production (8 g wet weight·L−1) and a duplication time of 2.4 h. Ethanol was also a good carbon source for the generation of biomass in short times (duplication time of 3.2 h). With lactate, the duplication time was over 20 h (Fig. S1 and 26).
Respiratory activities by permeabilized cells
Next, cells harvested at the exponential or stationary phases were permeabilized in the same Clark electrode chamber with digitonin at a final concentration of 0.03–0.2% (w/v), as described by Vercesi 27. Oxygen consumption assays in permeabilized cells were performed with different substrates and inhibitors (Figs 3 and 4). Both NADH and NADPH were used to assess the participation of the alternative external NADH and NADPH dehydrogenases. Pyruvate–malate was used to evaluate the activity of the internal NADH dehydrogenase. In all cases in which the NDH‐2 was studied, the experiments were carried out in the presence of 10 μm of rotenone. The concentration of rotenone used in the assay was sufficient to inhibit complex I but not the NDH‐2 36. To evaluate other electron input sites in the respiratory chain of U. maydis mitochondria, ethanol, succinate, glycerol 3‐phosphate, or lactate was used to assess the participation of each specific dehydrogenase in both growth phases. As can be seen in Figs 3 and 4, permeabilized cells showed external rotenone‐resistant NADH and NADPH dehydrogenase activities in both the exponential and stationary phases, regardless the culture conditions. The internal NADH dehydrogenase activity was found in both growth phases with ethanol and lactate as carbon sources, but with glucose, this activity was mostly present in the exponential phase.
Figure 3.
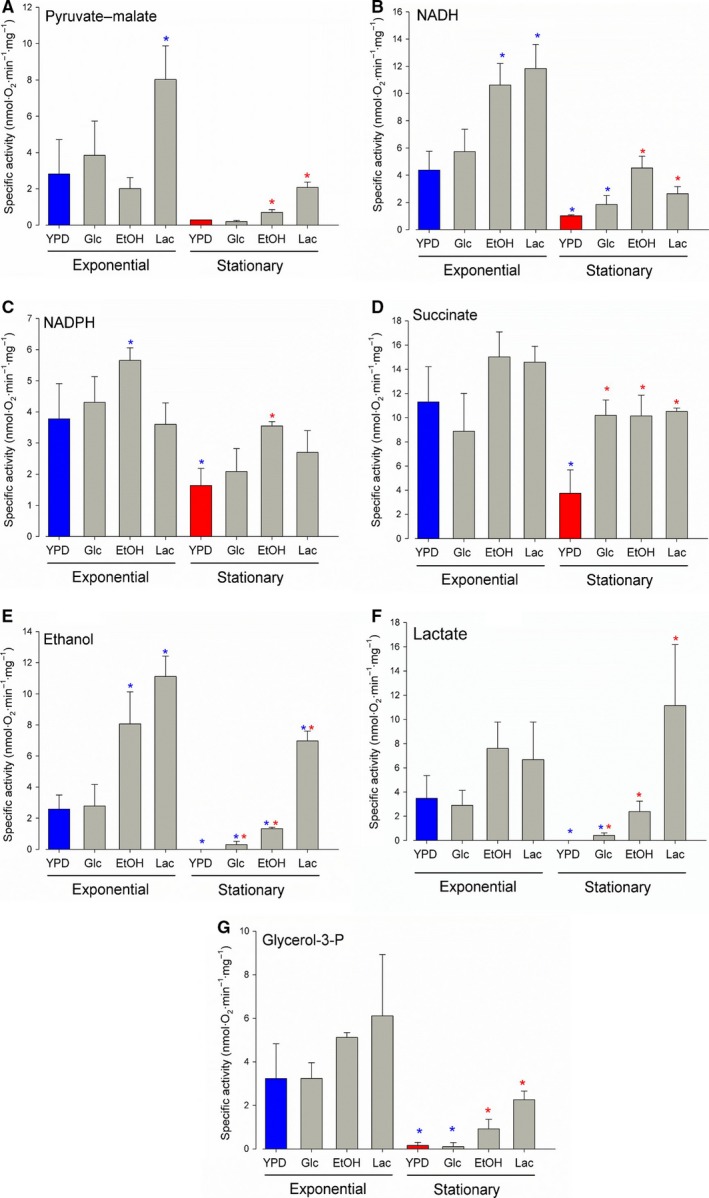
Oxygen consumption by permeabilized cells. Cells were permeabilized with digitonin inside the oxymeter chamber following standardized methods proposed by Robles‐Martínez 48. After permeabilization, different respiratory substrates were used to evaluate the rate of oxygen consumption. (A) 5 mm pyruvate‐malate, (B) 1 mm NADH, (C) 1 mm NADPH, (D) 7 mm succinate, (E) 130 mm ethanol, (F) 15 μm lactate and (G) 1 mm glycerol‐3‐phosphate. Data represent the average and standard deviation of three independent experiments. Blue asterisks on the bars indicate a significant difference with respect to the exponential‐YPD condition. Within the stationary phase, red asterisks indicate a significant difference taking as control the stationary‐YPD condition. A two‐way ANOVA was used for the analysis with a P < 0.05.
Figure 4.

Time courses of oxygen consumption by permeabilized U. maydis cells harvested at the exponential phase. Cells were permeabilized with digitonin inside the oxymeter chamber following standardized methods proposed by Robles‐Martínez 48. After permeabilization, oxygen consumption was stimulated by the addition of the indicated substrates. (A) NADPH, NADH and flavone. (B) NADPH, succinate, and KCN. (C) NADPH plus calcium, followed by rotenone, KCN and nOG. (D) To discriminate between complex I and the internal NDH‐2 activities, pyruvate‐malate was used as substrate, and rotenone plus flavone to inhibit the respiratory chain activity. (E) Ethanol plus NAD +. For permeabilization of cells, digitonin at 0.03% (v/v) was used. The concentration of substrates was: 10 mm succinate, 130 mm ethanol, 1 mm NADH, 1 mm NADPH, and 5 mm of both pyruvate and malate. Inhibitors were used at the following concentrations: 10 μm rotenone, 47 μm flavone, 1 mm potassium cyanide (KCN), 1 μm n‐octylgalate (nOG). Calcium was used at a concentration of 1.2 mm, and NAD+ at 1 mm.
In general, activities were higher in the exponential phase than in the stationary phase for all the culture conditions (Fig. 3). Although oxygen consumption was higher with NADH than with NADPH, both activities were within the same order of magnitude. All the pathways feeding the electron transport chain were active in the exponential phase, independently of the culture media. On the other hand, in the stationary phase there was a large decrease in oxygen consumption driven by pyruvate–malate, NADH, glycerol 3‐phosphate, lactate, and ethanol. This was more evident in cells obtained from YPD and Glc‐mm, in which some of the activities were undetectable. It is worth noting that oxygen consumption rates with NADH and ethanol as respiratory substrates were twofold higher in cells grown in nonglycolytic carbon sources (EtOH‐mm and Lac‐mm) in comparison with media containing glucose, and this observation occurred in both, the exponential and stationary phases. Ethanol was a good respiratory substrate, mostly in cells from the exponential phase of growth, and oxygen consumption was not altered by the addition of NAD+ (Figs 3 and 4E), suggesting that the alcohol dehydrogenase is located in the mitochondrial matrix. In contrast to lactate, ethanol supported a rapid growth of the cells, resembling the growth kinetics obtained in the presence of glucose. This finding is interesting because there is no lactic or alcoholic fermentation in U. maydis yeast 34, 36, but cells can consume very efficiently ethanol as a carbon source and as a respiratory substrate. The results also show that the expression of the alcohol, glycerol 3‐phosphate, and lactate dehydrogenases was not specific for each culture condition. Thus, when cells were grown in ethanol, respiratory activities in permeabilized cells can be supported by lactate and glycerol 3‐phosphate. It seems that when U. maydis yeasts are cultured in media with gluconeogenic carbon sources (ethanol and lactate) or under conditions of high energy demand (exponential phase), several pathways that feed the electron transport chain are expressed in mitochondria. However, we found that during the exponential phase, the activity of some components (external NADH‐DH, G3P‐DH, lactate‐DH, and EtOH‐DH) was lower in cells cultured in the presence of glucose (Fig. 3). This decrease was more evident during the stationary phase, in which the activities of the G3P‐DH, lactate‐DH, and EtOH‐DH were insignificant in cells cultured in the presence of glucose (Fig. 3). It should be noted that the concentration of glucose in the culture medium is still high in the stationary phase (Fig. S2) 48.
Next, we studied the activity of the respiratory chain of U. maydis to sequential additions of different substrates. Regardless of the order of addition of saturating concentrations of either NADH or NADPH, there was no increase in the oxygen consumption upon the addition of the second substrate, for example, adding NADH after NADPH did not increase the respiratory activity (Fig. 4A). This result suggests that both substrates interact with the same NDH‐2 enzymes. In contrast, once the saturation with NADH or NADPH was reached, a subsequent addition of succinate, pyruvate–malate, or glycerol 3‐phosphate increased the rate of oxygen consumption (Fig. 4B). Figure 4C shows that NADPH dehydrogenase activity did not respond to high concentrations of calcium, as occurs in other fungal systems such as N. crassa and some plants 41, 44. As both the mRNA and the protein with the calcium binding domain (um03669) were synthesized in the four culture conditions, the lack of an effect of calcium on the respiratory activity of permeabilized cells is in agreement with the absence of critical residues in the putative calcium binding domain of this protein. The experiment displayed in Fig. 4D suggests the presence of an internal NDH‐2, insensitive to rotenone but sensitive to flavone.
RNA and protein expression
Expression of the three U. maydis NADH dehydrogenases was analyzed by RT‐PCR in cells harvested at the stationary phase of growth. For normalization, the actin mRNA was used as reference 49. Figure 5 shows similar levels of expression for the three RNA transcripts in cells cultured under different conditions. Proteomic analysis further revealed that only the NADH dehydrogenases um02164 and um03669 were associated with mitochondria of U. maydis cells cultured in EtOH‐mm, Lac‐mm, and YPD culture media and harvested at the exponential phase of growth (Table 2), while peptides of um11333 were not detected in mitochondria. Taken together, these results suggest that in U. maydis a posttranscriptional regulation may exist that allows the differential translation of certain mRNA. In addition, due to the important role of these enzymes in the intermediary metabolism, regulation by covalent modifications like phosphorylation–dephosphorylation should be considered. In this sense, there are several putative phosphorylation sites in the amino acid sequences of the three NDH‐2 from U. maydis (data not shown). In support of this suggestion, phosphorylation of scNDI1 and scNDE1 has been reported 50, 51.
Figure 5.

Reverse transcription‐polymerase chain reaction of the NDH‐2s transcripts in Ustilago maydis. Cells grown under different conditions and harvested at the exponential phase were disrupted to obtain total RNA. Using the primers described in Table 1, RT‐PCR was carried out to evaluate the levels of each transcript using the actin transcript for normalization. Data represent the average of three independent experiments.
Table 2.
Representative enzymes of some metabolic pathways found in cells cultured under different culture conditions. The samples were sent to the research laboratory in Arizona, USA, as described under the materials and methods. The numbers represent a weighted value of the abundance of each protein under each condition. 6‐P‐gluconate dehydrogenase, 6 phosphogluconate dehydrogenase; Aox, alternative oxidase; FBPase‐1, fructose bisphosphatase 1; G3PDH, glyceraldehyde 3 phosphate dehydrogenase; Glc‐6‐P dehydrogenase, glucose‐6‐phosphate dehydrogenase; Glycerol‐3‐P dehydrogenase, glycerol‐3‐phosphate dehydrogenase; GPI, glucose 6 phosphate isomerase; ND, no determined; ND2, alternative NADH dehydrogenase 2; PEP‐CK, phosphoenolpyruvate carboxykinase; PGK, phosphoglycerate kinase; PK, pyruvate kinase; TPI, triose phosphate isomerase
| Enzyme | Accession number | YPD | EtOH‐mm | Lac‐mm |
|---|---|---|---|---|
| Glycolysis | ||||
| GPI | A0A0D1DUK2 | 5 | 12 | 5 |
| Aldolase | A0A0D1E8V6 | 6 | 12 | 12 |
| TPI | A0A0D1DYK6 | ND | 9 | 6 |
| G3P dehydrogenase | A0A0D1CU24 | 7 | 13 | 19 |
| PGK | A0A0D1DSH4 | 12 | 13 | 12 |
| Enolase | A0A0D1E2E4 | 11 | 13 | 9 |
| PK | A0A0D1E735 | 14 | 22 | 15 |
| Gluconeogenesis | ||||
| FBPase‐1 | A0A0D1C717 | ND | 8 | ND |
| PEP‐CK | A0A0D1E2J3 | ND | 32 | 25 |
| Phosphate pentose pathway | ||||
| Glc‐6‐P dehydrogenase | A0A0D1BZD5 | 5 | 4 | ND |
| 6‐P‐gluconate dehydrogenase | A0A0D1CRJ9 | 13 | 12 | 17 |
| Transaldolase | A0A0D1DYQ2 | 3 | 5 | 6 |
| Transketolase | A0A0D1CJR1 | 8 | 10 | 14 |
| Krebs cycle | ||||
| Citrate synthase | A0A0D1CAY8 | 23 | 20 | 18 |
| Aconitase | A0A0D1DXN8 | 28 | 26 | 38 |
| Isocitrate dehydrogenase | A0A0D1E633 | 17 | 18 | 15 |
| 2‐oxoglutarate dehydrogenase | A0A0D1CAI6 | 15 | 7 | 11 |
| Succinyl‐CoA synthase | A0A0D1E476 | 12 | 9 | 9 |
| Succinate dehydrogenase | A0A0D1DVG5 | 16 | 41 | 43 |
| Fumarase | A0A0D1E945 | 12 | 6 | 11 |
| Malate dehydrogenase | A0A0D1BZ90 | 6 | 20 | 18 |
| Respiratory complexes and ATP synthase | ||||
| Complex I | A0A0D1DQS4 | 15 | 26 | 33 |
| Complex II | A0A0D1CDW6 | 16 | 41 | 43 |
| Complex III | A0A0D1CAD4 | 24 | 28 | 26 |
| Complex IV | A0A0D1DRD6 | 13 | 14 | 11 |
| Complex V | A0A0D1E227 | 45 | 62 | 57 |
| Respiratory alternative elements | ||||
| Lactate dehydrogenase | A0A0D1E9U3 | ND | 7 | 27 |
| ND2 um02164 | A0A0D1E082 | 7 | 18 | 24 |
| ND2 um03669 | A0A0D1DV23 | 24 | 7 | 16 |
| Glycerol‐3P dehydrogenase | A0A0D1CVJ0 | 15 | 10 | 21 |
| Aox | A0A0D1C7C6 | ND | 11 | 3 |
The role of the alternative NAD(P)H dehydrogenases in Ustilago maydis
To place these dehydrogenases in the metabolic context of the cells, information about the presence of some proteins belonging to central metabolic pathways under the three culture conditions (YPD, EtOH‐mm, and Lac‐mm) was obtained through proteomic analysis. In general, the expression of the enzymes that belong to carbon metabolism was not associated with the culture conditions of the cells. For example, with the gluconeogenic substrates ethanol and lactate, the three classic regulatory glycolytic enzymes, hexokinase, phosphofructokinase‐1, and pyruvate kinase were expressed (Fig. 6). During the exponential phase, there was no difference between the YPD and Glc‐mm in the activities of the three enzymes, but with ethanol as the carbon source, there was a large decrease in their activities. Similarly, in EtOH‐mm and Lac‐mm, there was a decrease in the activities of PFK‐1 and PK. When cells entered the stationary phase, the activities of the three enzymes in YPD increased twice, but this was not observed in Glc‐mm. Regarding the PFK‐1 and PK, their activities were lower in EtOH‐mm and Lac‐mm than in YPD or even Glc‐mm. Interestingly, the activity of the hexokinase is high in all conditions, with the exception of ethanol in the exponential phase. In short, it can be said that with the exception of the HK, the activities of the two glycolytic enzymes were smaller in cell growing with the two gluconeogenic substrates, ethanol and lactate. Given the relative high activity of regulatory glycolytic enzymes in cells growing in gluconeogenic media (Fig. 6), it is expected that some type of control mechanism occurs to avoid energetically expensive futile cycles. Table 2 shows that enzymes from glycolysis, Krebs cycle, pentose phosphate pathway, and gluconeogenesis were present in cells regardless of the carbon source (glucose, ethanol, or lactate). The mitochondrial flavoenzyme lactate dehydrogenase was expressed mainly in the presence of lactate, and to a lesser extent with ethanol, but not in YPD. In contrast, the mitochondrial glycerol 3‐phosphate dehydrogenase and the two alternative NADH dehydrogenases were expressed under all the conditions.
Figure 6.

Specific activities of hexokinase, phosphofructokinase‐1, and pyruvate kinase in U. maydis cell extracts. Enzyme activity was determined as described in Saavedra et al. 34. Data represent the average and standard deviation of five independent experiments. (A) For hexokinase, the activity was measured in a reaction mixture containing 5 mm MgCl2, 1 mm NADPH, 5 mm glucose, 2 U G6PDH, 13–68 mg of cytosolic extract. The reaction was started by the addition of 3 mm ATP. (B) For the phosphofructokinase‐1, the reaction mixture contained 5 mm MgCl2, 1 mm EDTA, 0.15 mm NADH, 3 mm ATP, 0.5–1 U aldolase, 3 U Gly3PDH – 4.5 U triose phosphate isomerase (Roche) and 30–400 mg of cytosolic extract. The reaction was started by the addition of 2.5 mm fructose 6 phosphate. (C) Pyruvate kinase was assayed in a reaction mixture containing 10 mm MgCl2, 0.15 mm NADH, 1 mm phosphoenopyruvate, 2.5 U lactate dehydrogenase, 13–90 mg of cytosolic extract. The reaction was started with 3 mm ADP. Blue asterisks on the bars indicate a significant difference with respect to the exponential‐YPD condition. Within the stationary phase, red asterisks indicate a significant difference taking as control the stationary‐YPD condition. A two‐way ANOVA was used for the analysis with a P < 0.05.
Activity of the mitochondrial external NADH dehydrogenase makes sense in the context of U. maydis metabolism. As this organism is fully respiratory, these enzymes are essential for the continuous operation of glycolysis and other metabolic routes that depend on the availability of NAD+. In contrast, the role of the NADPH dehydrogenase activity is more difficult to explain, because in many anabolic pathways, NADPH is used as substrate. In a previous work, we found that the activities of the enzymes in the oxidative phase of the phosphate pentose pathway 52 are more active than the glycolytic enzymes reported by Saavedra et al. 34. Thus, it is possible that the NADPH dehydrogenase activity in mitochondria allows the rapid and efficient oxidation of NADPH produced in the pentose pathway.
Ustilago maydis has been extensively used for years as a model to study the participation of several signal transduction pathways in the yeast‐mycelium transition and pathogenicity 53, 54, or more recently the introduction of this microorganism for biotechnological applications 55, 56. In sharp contrast with this vast information, the mechanisms underlying the metabolic changes described in this work are still unknown. Cloning and expression of the three NADH dehydrogenases will allow the determination of their specificities and kinetic parameters, and the evaluation of the effect of calcium on the activity of the um03669 enzyme.
Author contributions
AP conceptualized and coordinated the research project, provided funding to support the research, and reviewed and edited the manuscript. JPP conceptualized and coordinated the research project, analyzed the data, provided funding to support the research, and reviewed and edited the manuscript. GGS conceptualized the research project, provided funding to support the research, and reviewed the manuscript. GMO conceptualized, coordinated, and developed the research project; performed the bioinformatics analyses, PCR and protein data analyses, and oxygen consumption assays; and wrote the original draft. DMM isolated mitochondria, performed SDS/PAGE with mitochondrial samples, analyzed the data, and reviewed the manuscript. CCM performed PCR analyses and oxygen consumption assays analysis. JCV determined the glycolytic enzyme‐specific activities and analyzed the data. LRA performed yeast growth and glucose determination, and performed SDS/PAGE with mitochondrial samples. HVM isolated mitochondria, protein analysis, and oxygen consumption assays.
Supporting information
Fig. S1. Ustilago maydis growth curves in different culture media. Panel A shows the growth of U. maydis when the carbon source was glucose or ethanol. Panel B shows the growth in media with lactate as the carbon source. Tables show the growth rate constants (k) and duplication times (g).
Fig. S2. Ustilago maydis growth in YPD medium. Yeast growth was followed by absorbance at 600 nm. Simultaneously, the residual concentration of glucose in the culture medium was determined using a kit based on the glucose oxidase activity (Spinreact ®). Standard deviations for each point were obtained from three independent experiments.
Acknowledgements
We thank Minerva Araiza‐Villanueva and Melissa Vázquez‐Carrada for their technical assistance. This work is the product of a postdoctoral stay of GMO at the Instituto de Fisiología Celular, Universidad Nacional Autónoma de México (UNAM). Some of the experiments described in this work are part of the PhD degree of DMM in the Doctorado de Ciencias Biológicas, UNAM. Juan Pablo Pardo received a grant from Programa de Apoyo a Proyectos de Investigación e Innovación Tecnológica (PAPIIT IN222117), Universidad Nacional Autónoma de México (UNAM), and Consejo Nacional de Ciencia y Tecnología (CONACyT 254904). Antonio Peña received a grant from Programa de Apoyo a Proyectos de Investigación e Innovación Tecnológica (PAPIIT 238497) de la Universidad Nacional Autónoma de México (UNAM), and CONACyT (238497). Guadalupe Guerra received a grant from Secretaría de Investigación y Posgrado (SIP 20150761), Instituto Politécnico Nacional (IPN). Genaro Matus Ortega received a posdoctoral fellowship from Dirección General de Asuntos del Personal Académico (DGAPA UNAM).
Deyamira Matuz‐Mares, Genaro Matus‐Ortega and Christian Cárdenas‐Monroy contributed equally to this work.
References
- 1. Rustin P and Jacobs HT (2009) Respiratory chain alternative enzymes as tools to better understand and counteract respiratory chain deficiencies in human cells and animals. Physiol Plant 137, 362–370. [DOI] [PubMed] [Google Scholar]
- 2. De Vries S and Grivell LA (1988) Purification and characterization of a rotenone‐insensitive NADH:Q6 oxidoreductase from mitochondria of Saccharomyces cerevisiae . Eur J Biochem 176, 377–384. [DOI] [PubMed] [Google Scholar]
- 3. Rasmusson AG, Geisler DA and Moller IM (2008) The multiplicity of dehydrogenases in the electron transport chain of plant mitochondria. Mitochondrion 8, 47–60. [DOI] [PubMed] [Google Scholar]
- 4. De Vries S, Van Witzenburg R, Grivell LA and Marres CA (1992) Primary structure and import pathway of the rotenone‐insensitive NADH‐ubiquinone oxidoreductase of mitochondria from Saccharomyces cerevisiae . Eur J Biochem 203, 587–592. [DOI] [PubMed] [Google Scholar]
- 5. Melo AM, Bandeiras TM and Teixeira M (2004) New insights into type II NAD(P)H:quinone oxidoreductases. Microbiol Mol Biol Rev 68, 603–616. [DOI] [PMC free article] [PubMed] [Google Scholar]
- 6. Velazquez I and Pardo JP (2001) Kinetic characterization of the rotenone‐insensitive internal NADH: ubiquinone oxidoreductase of mitochondria from Saccharomyces cerevisiae . Arch Biochem Biophys 389, 7–14. [DOI] [PubMed] [Google Scholar]
- 7. Yamashita T, Nakamaru‐Ogiso E, Miyoshi H, Matsuno‐Yagi A and Yagi T (2007) Roles of bound quinone in the single subunit NADH‐quinone oxidoreductase (Ndi1) from Saccharomyces cerevisiae . J Biol Chem 282, 6012–6020. [DOI] [PubMed] [Google Scholar]
- 8. Kerscher SJ (2000) Diversity and origin of alternative NADH:ubiquinone oxidoreductases. Biochim Biophys Acta 1459, 274–283. [DOI] [PubMed] [Google Scholar]
- 9. Matus‐Ortega MG, Salmerón‐Santiago KG, Flores‐Herrera O, Guerra‐Sánchez G, Martínez F, Rendón JL and Pardo JP (2011) The alternative NADH dehydrogenase is present in mitochondria of some animal taxa. Comp Biochem Physiol Part D Genomics Proteomics 6, 256–263. [DOI] [PubMed] [Google Scholar]
- 10. Iwata M, Lee Y, Yamashita T, Yagi T, Iwata S, Cameron AD and Maher MJ (2012) The structure of the yeast NADH dehydrogenase (Ndi1) reveals overlapping binding sites for water‐ and lipid‐soluble substrates. Proc Natl Acad Sci USA 109 (38), 15247–15252. [DOI] [PMC free article] [PubMed] [Google Scholar]
- 11. Feng Y, Li W, Li J, Wang J, Ge J, Xu D, Liu Y, Wu K, Zeng Q, Wu JW et al (2012) Structural insight into the type‐II mitochondrial NADH dehydrogenases. Nature 491, 478–482. [DOI] [PubMed] [Google Scholar]
- 12. Heikal A, Nakatani Y, Dunn E, Weimar MR, Day CL, Baker EN, Lott JS, Sazanov LA and Cook GM (2014) Structure of the bacterial type II NADH dehydrogenase: a monotopic membrane protein with an essential role in energy generation. Mol Microbiol 91, 950–964. [DOI] [PubMed] [Google Scholar]
- 13. Small WC and McAlister‐Henn L (1998) Identification of a cytosolically directed NADH dehydrogenase in mitochondria of Saccharomyces cerevisiae . J Bacteriol 180, 4051–4055. [DOI] [PMC free article] [PubMed] [Google Scholar]
- 14. Luttik MA, Overkamp KM, Kötter P, de Vries S, van Dijken JP and Pronk JT (1998) The Saccharomyces cerevisiae NDE1 and NDE2 genes encode separate mitochondrial NADH dehydrogenases catalyzing the oxidation of cytosolic NADH. J Biol Chem 273, 24529–24534. [DOI] [PubMed] [Google Scholar]
- 15. Grandier‐Vazeille X, Bathany K, Chaignepain S, Camougrand N, Manon S and Schmitter JM (2001) Yeast mitochondrial dehydrogenases are associated in a supramolecular complex. Biochemistry 40, 9758–9769. [DOI] [PubMed] [Google Scholar]
- 16. Matus‐Ortega MG, Cárdenas‐Monroy CA, Flores‐Herrera O, Mendoza‐Hernández G, Miranda M, González‐Pedrajo B, Vázquez‐Meza H and Pardo JP (2015) New complexes containing the internal alternative NADH dehydrogenase (Ndi1) in mitochondria of Saccharomyces cerevisiae . Yeast 32, 629–641. [DOI] [PubMed] [Google Scholar]
- 17. Eubel H, Jansch L and Braun HP (2003) New insights into the respiratory chain of plant mitochondria: supercomplexes and a unique composition of complex II. Plant Physiol 133, 274–286. [DOI] [PMC free article] [PubMed] [Google Scholar]
- 18. Dudkina NV, Heinemeyer J, Sunderhaus S, Boekema EJ and Braun HP (2006) Respiratory chain supercomplexes in the plant mitochondrial membrane. Trends Plant Sci 11, 232–240. [DOI] [PubMed] [Google Scholar]
- 19. Ramirez‐Aguilar SJ, Keuthe M, Rocha M, Fedyaev VV, Kramp K, Gupta KJ, Rasmusson AG, Schulze WX and van Dongen JT (2011) The composition of plant mitochondrial supercomplexes changes with oxygen availability. J Biol Chem 286, 43045–43053. [DOI] [PMC free article] [PubMed] [Google Scholar]
- 20. Lin SS, Gross U and Bohne W (2009) Type II NADH dehydrogenase inhibitor 1‐hydroxy‐2‐dodecyl‐4(1H) quinolone leads to collapse of mitochondrial inner‐membrane potential and ATP depletion in Toxoplasma gondii . Eukaryot Cell 8, 877–887. [DOI] [PMC free article] [PubMed] [Google Scholar]
- 21. Horne JT, Hollomon DW and Wood PM (2001) Fungal respiration: a fusion of standard and alternative components. Biochim Biophys Acta 1504, 179–195. [DOI] [PubMed] [Google Scholar]
- 22. Bald D and Koul A (2010) Respiratory ATP synthesis: the new generation of mycobacterial drug targets. FEMS Microbiol Lett 308, 1–7. [DOI] [PubMed] [Google Scholar]
- 23. Bai Y, Hájek P, Chomyn A, Chan E, Seo BB, Matsuno‐Yagi A, Yagi T and Attardi G (2001) Lack of complex I activity in human cells carrying a mutation in MtDNA‐encoded ND4 subunit is corrected by the Saccharomyces cerevisiae NADH‐quinone oxidoreductase (NDI1) gene. J Biol Chem 276, 38808–38813. [DOI] [PubMed] [Google Scholar]
- 24. Seo BB, Marella M, Yagi T and Matsuno‐Yagi A (2006) The single subunit NADH dehydrogenase reduces generation of reactive oxygen species from complex I. FEBS Lett 580, 6105–6108. [DOI] [PubMed] [Google Scholar]
- 25. Hur JH, Bahadorani S, Graniel J, Koehler CL, Ulgherait M, Rera M, Jones DL and Walker DW (2013) Increased longevity mediated by yeast NDI1 expression in Drosophila intestinal stem and progenitor cells. Aging (Albany NY) 5, 662–681. [DOI] [PMC free article] [PubMed] [Google Scholar]
- 26. Cárdenas‐Monroy CA, Pohlmann T, Piñón‐Zárate G, Matus‐Ortega G, Guerra G, Feldbrügge M and Pardo JP (2017) The mitochondrial alternative oxidase Aox1 is needed to cope with respiratory stress but dispensable for pathogenic development in Ustilago maydis . PLoS ONE 12, e0173389 10.1371/journal.pone.0173389 [DOI] [PMC free article] [PubMed] [Google Scholar]
- 27. Vercesi AE, Bernardes CF, Hoffmann ME, Gadelha FR and Docampo R (1991) Digitonin permeabilization does not affect mitochondrial function and allows the determination of the mitochondrial membrane potential of Trypanosoma cruzi in situ. J Biol Chem 266, 14431–14434. [PubMed] [Google Scholar]
- 28. Altschul SF, Madden TL, Schäffer AA, Zhang J, Zhang Z, Miller W and Lipman DJ (1997) Gapped BLAST and PSI‐BLAST: a new generation of protein database search programs. Nucleic Acids Res 25, 3389–3402. [DOI] [PMC free article] [PubMed] [Google Scholar]
- 29. Thompson JD, Higgins DG and Gibson TJ (1994) CLUSTAL W: improving the sensitivity of progressive multiple sequence alignment through sequence weighting, position‐specific gap penalties and weight matrix choice. Nucleic Acids Res 22, 4673–4680. [DOI] [PMC free article] [PubMed] [Google Scholar]
- 30. Claros MG (1995) MitoProt, a Macintosh application for studying mitochondrial proteins. Comput Appl Biosci 11: 441–447. [DOI] [PubMed] [Google Scholar]
- 31. Holliday R (1974) Ustilago maydis Handbook of Genetics. Plenum, New York, NY, 1, 575–595. [Google Scholar]
- 32. Robles‐Martínez L, Guerra‐Sánchez MG, Flores‐Herrera O, Hernández‐Lauzardo AN, Velázquez‐Del Valle MG and Pardo JP (2013) The mitochondrial respiratory chain of Rhizopus stolonifer (Ehrenb.:Fr.) Vuill. Arch Microbiol 195, 51–61. [DOI] [PubMed] [Google Scholar]
- 33. Sierra‐Campos E, Velázquez I, Matuz‐Mares D, Villavicencio‐Queijeiro A and Pardo JP (2009) Functional properties of the Ustilago maydis alternative oxidase under oxidative stress conditions . Mitochondrion 2, 96–102. [DOI] [PubMed] [Google Scholar]
- 34. Saavedra E, Ramos‐Casillas LE, Marín‐Hernández A, Moreno‐Sánchez R and Guerra‐Sánchez G (2008) Glycolysis in Ustilago maydis . Federat Europ Microbiol Societ 8, 1313–1323. [DOI] [PubMed] [Google Scholar]
- 35. Laemmli UK (1970) Cleavage of structural proteins during the assembly of the head of bacteriophage T4. Nature 227, 5259. [DOI] [PubMed] [Google Scholar]
- 36. Juarez O, Guerra G, Martínez F and Pardo JP (2004) The mitochondrial respiratory chain of Ustilago maydis . Biochim Biophys Acta 1658, 244–251. [DOI] [PubMed] [Google Scholar]
- 37. Desplats C, Beyly A, Cuine S, Bernard L, Cournac L and Peltier G (2007) Modification of substrate specificity in single point mutants of Agrobacterium tumefaciens type II NADH dehydrogenase. FEBS Lett 581, 4017–4022. [DOI] [PubMed] [Google Scholar]
- 38. Blaza JN, Bridges HR, Dunn EA, Heikal A, Cook GM, Nakatani Y and Hirst J (2017) The mechanism of catalysis by type‐II NADH:quinone oxidoreductases. Sci Rep 7, 40615, 10.1038/srep40165 [DOI] [PMC free article] [PubMed] [Google Scholar]
- 39. Meng‐Shu H and Rasmusson AG (2016) The evolution of substrate specificity‐associated residues and Ca2+‐binding motifs in EF‐hand‐containing type II NAD(P)H dehydrogenases. Physiol Plant 157, 338–351. [DOI] [PubMed] [Google Scholar]
- 40. Matus‐Ortega MG, Cárdenas‐Monroy CA, Araiza‐Villanueva M, Vázquez‐Carrada M, Vázquez‐Meza H, Matuz‐Mares D and Guerra‐Sánchez G, Peña‐Díaz, Antonio y Pardo‐Vázquez Juan Pablo (2017) The alternative NADH dehydrogenases in fungi, new metabolic roles and its evolutionary history. Memoria del 44° Taller de Actualización Bioquímica, Facultad de Medicina; UNAM http://tab.facmed.unam.mx/mensaje-bioquimica-2017.html
- 41. Melo AM, Duarte M, Møller IM, Prokisch H, Dolan PL, Pinto L, Nelson MA and Videira A (2001) The external calcium‐dependent NADPH dehydrogenase from Neurospora crassa mitochondria. J Biol Chem 276, 3947–3951. [DOI] [PubMed] [Google Scholar]
- 42. Carneiro P, Duarte M and Videira A (2004) The main external alternative NAD(P)H dehydrogenase of Neurospora crassa mitochondria. Biochim Biophys Acta 1608, 45–52. [DOI] [PubMed] [Google Scholar]
- 43. Tarrio N, Becerra M, Cerdán ME and González Siso MI (2006) Reoxidation of cytosolic NADPH in Kluyveromyces lactis . FEMS Yeast Res 6, 371–380. [DOI] [PubMed] [Google Scholar]
- 44. Hao MS, Jensen AM, Boquist AS, Liu YJ and Rasmusson AG (2015) The Ca2+‐Regulation of the mitochondrial external NADPH dehydrogenase in plants is controlled by cytosolic pH. PLoS ONE 10, 0139224. [DOI] [PMC free article] [PubMed] [Google Scholar]
- 45. Tarrio N, Cerdán ME and González Siso MI (2006) Characterization of the second external alternative dehydrogenase from mitochondria of the respiratory yeast Kluyveromyces lactis . BBA 1757, 1476–1484. [DOI] [PubMed] [Google Scholar]
- 46. Yang Y, Yu Li X, Li J, Wu Y, Yu J, Ge J, Huang Z, Jiang J, Rao Y and Yang M (2017) Target elucidation by cocrystal structures of NADH‐ubiquinone oxidoreductase of Plasmodium falciparum (PfNDH2) with small molecule to eliminate drug‐resistant malaria. J Med Chem 60, 1994–2005. [DOI] [PubMed] [Google Scholar]
- 47. Grabarek Z (2006) Structural basis for diversity of the EF‐hand calcium‐binding proteins. J Mol Biol 359, 509–525. [DOI] [PubMed] [Google Scholar]
- 48. Matus Ortega MG (2007) Caracterización cinética de la H+‐ATPasa de la levadura de U. maydis cultivada en medio mínimo y de YPD. UNAM‐Tesis 1, 56. [Google Scholar]
- 49. Robles‐Martínez L, Pardo Juan Pablo, Tavis Manuel Miranda, Mendez L, Matus‐Ortega Macario Genaro, Mendoza‐Hernández Guillermo and Guerra‐Sánchez Guadalupe (2013) The basidiomycete Ustilago maydis has two plasma membrane H+‐ATPases related to fungi and plants. J Bioenerg Biomembr 45, 477–490. [DOI] [PubMed] [Google Scholar]
- 50. Reinders J, Wagner K, Zahedit R, Stojanovski D, Eyrich B, Laan M, Rehling P, Sickmann A, Pfanner N and Meisinger C (2007) Profiling phosphoproteins of yeast mitochondria reveals a role of phosphorylation in assembly of ATP synthase. MCP 6, 1896–1906. [DOI] [PubMed] [Google Scholar]
- 51. Renvoisé M, Bonhomme L, Davanture M, Valot B, Zivy M and Lemaire C (2014) Quantitative variations of the mitochondrial proteome and phosphoproteome during fermentative and respiratory growth in Saccharomyces cerevisiae . J Proteomics 106, 140–150. [DOI] [PubMed] [Google Scholar]
- 52. Romero‐Aguilar L, Montero‐Lomelí M, Luqueño‐Bocardo OI, Juárez‐Oropeza MA and Guerra‐Sánchez G (2017) Lipid droplets accumulation and other biochemical changes induced in the fungal pathogen Ustilago maydis under nitrogen‐starvation. Arch Microbiol 199, 1195–1209. [DOI] [PubMed] [Google Scholar]
- 53. Dean R, Van Kan JA, Pretorius ZA, Hammond‐Kosack KE, Di Pietro A, Spanu PD, Rudd JJ, Dickman M, Kahmann R, Ellis J et al (2012) The Top 10 fungal pathogens in molecular plant pathology. Mol Plant Pathol 13, 414–430. [DOI] [PMC free article] [PubMed] [Google Scholar]
- 54. Vollmeister E, Schipper K, Baumann S, Haag C, Pohlmann T, Stock J and Feldbrügge M (2012) Fungal development of the plant pathogen Ustilago maydis . FEMS Microbiol Rev 6, 59–77. [DOI] [PubMed] [Google Scholar]
- 55. Terfrüchte M, Reindl M, Jankowski S, Sarkari P, Feldbrügge M and Schipper K (2017) Applying unconventional secretion in Ustilago maydis for the export of functional nanobodies. Int J Mol Sci. 18, E937 10.3390/ijms18050937 [DOI] [PMC free article] [PubMed] [Google Scholar]
- 56. Feldbrügge M, Kellner R and Schipper K (2013) The biotechnological use and potential of plant pathogenic smut fungi. Appl Microbiol Biotechnol 97, 3253–3265. [DOI] [PubMed] [Google Scholar]
Associated Data
This section collects any data citations, data availability statements, or supplementary materials included in this article.
Supplementary Materials
Fig. S1. Ustilago maydis growth curves in different culture media. Panel A shows the growth of U. maydis when the carbon source was glucose or ethanol. Panel B shows the growth in media with lactate as the carbon source. Tables show the growth rate constants (k) and duplication times (g).
Fig. S2. Ustilago maydis growth in YPD medium. Yeast growth was followed by absorbance at 600 nm. Simultaneously, the residual concentration of glucose in the culture medium was determined using a kit based on the glucose oxidase activity (Spinreact ®). Standard deviations for each point were obtained from three independent experiments.