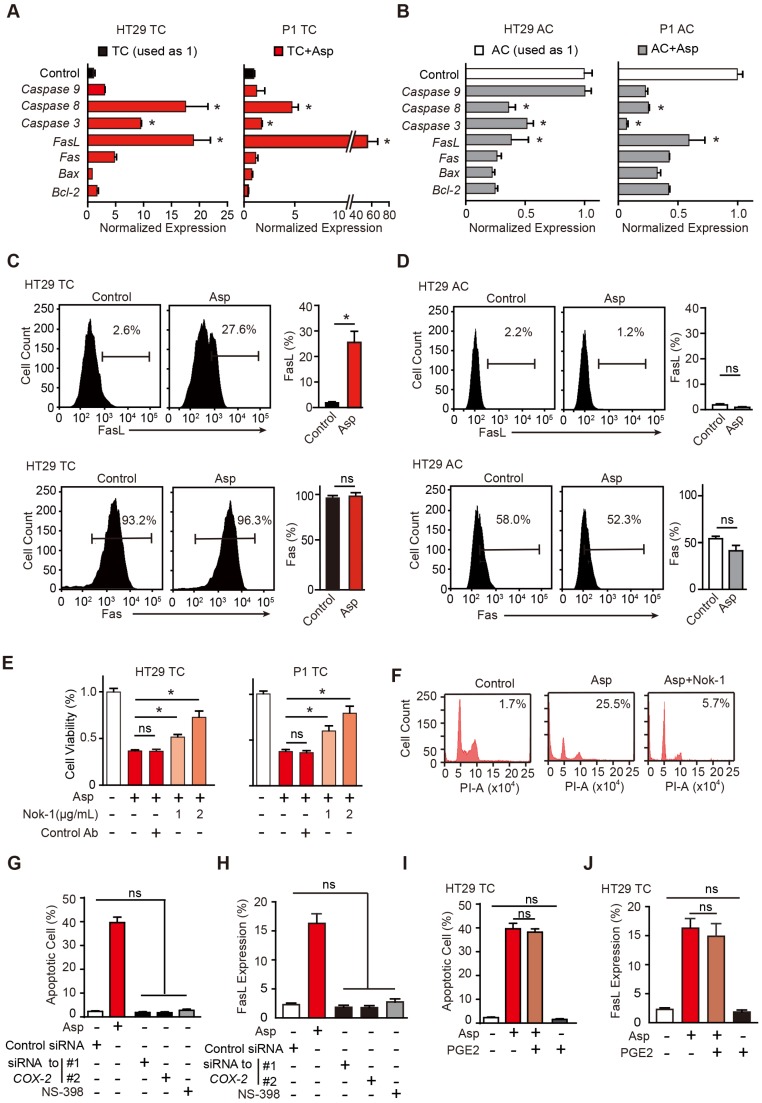
Figure 3.
Aspirin-induced apoptosis is mediated by FasL. (A-B) qPCR results of HT29 and P1 TCs (A) or ACs (B) following 2-day treatment with 5 mM Asp (mean ±SEM, n=3, normalized to Gapdh mRNA expression). *, p<0.01, one-way ANOVA. The control is set to 1 for every gene. (C-D) FasL and Fas expression in HT29 TCs (C) or ACs (D) analyzed via FCM assays. Immunoreactive cells and their average percentages of the total cell counts are indicated in the histogram and quantified (mean ± SEM, n=3). *, p<0.01, unpaired t-test. (E) Proliferation analysis of the survival of HT29 and P1 TCs following 48 h exposure to 5 mM Asp in the presence of an isotype-matched control antibody or FasL-blocking antibody (Nok-1) at the indicated concentrations (mean ±SEM, n=3). *, p<0.01, one-way ANOVA. (F) Representative results of HT29 TCs analyzed via FCM assays following 48 h exposure to 5 mM Asp with a control antibody or 2 μg/mL Nok-1. Sub-G1 was designated as the apoptotic proportion. Scale bar indicates 50 μm. (G-J) TUNEL assay (G, I) and FCM assay (H, J) for analyzing apoptotic cells and FasL expression, respectively, from HT29 TCs in the presence of Asp (5 mM), Asp (5 mM) and PGE2 (1 μM) co-treatment, and siRNA against COX-2 or NS-398 (75 μM). The results are presented as the mean ± SEM, n=3. *, p<0.01, one-way ANOVA. (See also Figure S3)

