

Abstract
Background
Marker detection is an important task in complex disease studies. Here we provide an association rule mining (ARM) based approach for identifying integrated markers through mutual information (MI) based statistically significant feature extraction, and apply it to acute myeloid leukemia (AML) and prostate carcinoma (PC) gene expression and methylation profiles.
Methods
We first collect the genes having both expression and methylation values in AML as well as PC. Next, we run Jarque-Bera normality test on the expression/methylation data to divide the whole dataset into two parts: one that ollows normal distribution and the other that does not follow normal distribution. Thus, we have now four parts of the dataset: normally distributed expression data, normally distributed methylation data, non-normally distributed expression data, and non-normally distributed methylated data. A feature-extraction technique, “mRMR” is then utilized on each part. This results in a list of top-ranked genes. Next, we apply Welch t-test (parametric test) and Shrink t-test (non-parametric test) on the expression/methylation data for the top selected normally distributed genes and non-normally distributed genes, respectively. We then use a recent weighted ARM method, “RANWAR” to combine all/specific resultant genes to generate top oncogenic rules along with respective integrated markers. Finally, we perform literature search as well as KEGG pathway and Gene-Ontology (GO) analyses using Enrichr database for in silico validation of the prioritized oncogenes as the markers and labeling the markers as existing or novel.
Results
The novel markers of AML are {ABCB11↑∪KRT17↓} (i.e., ABCB11 as up-regulated, & KRT17 as down-regulated), and {AP1S1-∪KRT17↓∪NEIL2-∪DYDC1↓}) (i.e., AP1S1 and NEIL2 both as hypo-methylated, & KRT17 and DYDC1 both as down-regulated). The novel marker of PC is {UBIAD1¶∪APBA2‡∪C4orf31‡} (i.e., UBIAD1 as up-regulated and hypo-methylated, & APBA2 and C4orf31 both as down-regulated and hyper-methylated).
Conclusion
The identified novel markers might have critical roles in AML as well as PC. The approach can be applied to other complex disease.
Keywords: integrated markers, feature extraction, statistical test, rule mining
INTRODUCTION
Identification of biomarkers from multiple omics datasets has been one of the main research topics in quantitative science and complex disease studies. A “biomarker” [1–4] refers to one gene or a locus whose change can reflect a specified subcategory of medical signs or clinical outcome (e.g., drug treatment); whereas medical symptoms represent the indications about either illness or health which can be understandable only by the patients by their own. From another source, a biomarker can be stated as a biological measure for a biological state. It also can be defined as a characteristic which would be measured in objective-oriented manner and estimated as an indicator of either pathogenic or biological processes, or pharmacological feedbacks to a therapeutic mediation. World Health Organization (WHO) defines a biomarker as a structure, substance, or process which can be measurable in the human body and which helps to make prediction on either the disease or resultant factor respective to the disease. To identify a reproducible biomarker, appropriate statistical methods and analysis of data from one or multiple large datasets are required.
Errors in statistical analysis [5–13] are the most critical issues which are often identified in literature. In statistical theory, there are mainly two categories of hypothesis tests: parametric test and non-parametric test. Parametric test follows the assumption of having normal distributed data whereas non-parametric test follows the assumption of having any non-normally distributed data. Therefore, in the case of the normally distributed data, parametric hypothesis based test typically works well. If the data does not hold normal distribution, the p-value of the parametric test becomes inappropriate in many cases. Notably, in the case of normally distributed data, nonparametric tests are found to be less powerful than parametric tests. Thus, p-value of the non-parametric test represents a higher score beyond its original score. However, when the distribution of the data is non-normal, p-value of the non-parametric test is proper. If the sample size in the corresponding data is not large enough (e.g., less than fifty in some studies), then the aforementioned statements are too much sensitive [14].
DNA methylation [15,16] is a heritable epigenetic factor that involves the covalent transfer of a methyl group (-CH3) to the 5th position of the cytosine pyrimidine ring by DNA methyltransferases or 6th nitrogen place of the adenine purine ring in the genomic DNA. Gene expression will maintain low when its methylation level in the promoter region is high. To activate gene expression, methylation level will be decreased accordingly.
Microarray technique [17–19] has been used to examine genome-wide gene expression and methylation profiles along with other genomic features (e.g., single nucleotide polymorphisms, copy number variation, microRNA) in the experimental/diseased case samples versus control samples (e.g., matched normal samples). Notably, the number of genes in the microarray data is large (about 22,000 protein coding genes, many more at the transcript level), but most of them are not informative for disease versus normal comparison. Therefore, it requires to identify those most informative genes for biomarker detection from the dataset along with better visualization of the respective data, reducing the elapsed time for better postprocessing works like classification, feature-subset selection employing the efficient model as well as robust model. Thus, feature-selection methodology can be useful for marker identification as an intermediary step [8,20,21]. In this manuscript, we provide an association rule mining (ARM) based study of identifying integrated oncogenic markers through mutual information (MI) oriented statistically significant feature extraction on an acute myeloid leukemia-based multi-view dataset consisting of gene expression and methylation values. In this regard, we preliminarily apply a well-known normality test namely Jarque-Bera normality test [22,23] on the expression and methylation data. This test help us to divide the expression and methylation data into two parts, normally distributed sub-data and non-normally distributed sub-data. After that, we find the genes which contain both expression and methylation data-values, and which hold normal distribution. Subsequently, we identify the genes that have both expression and methylation data-values, but do not hold normal distribution. Therefore, through the above steps, we acquire four categories of sub-datasets: normally distributed expression sub-data (NDE), non-normally distributed expression sub-data (NNDE), normally distributed methylation sub-data (NDM), and non-normally distributed methylation sub-data (NNDM). A well-known feature-selection method, mRMR [24] is then applied to each of the four sub-datasets in order to determine a specific number of top-ranking features (genes) that consist of highest relevance as well as lowest redundancy. As a parametric hypothesis test is more or less well performer on the normal distributed data, thus Welch t-test (a well-known parametric test) [25] is applied to NDE data as well as NDM data to identify the list of the genes that are both differentially expressed and differentially methylated. Subsequently, since a non-parametric hypothesis test typically performs well on the non-normally distributed data, we apply Shrink t-test (a nonparametric test) [5] to NNDE data as well as NNDM data to obtain the list of the genes that are both differentially expressed and differentially methylated.
Consequently, we have identified the genes that have inverse relationship between the expression and methylation data for normal distribution as well as non-normal distribution. In other words, we have performed the intersection between these resultant genes from NDE and NDM as well as from NNDE and NNDM. Next, we carry out the union of all the intersecting results. But, if the number of such intersected genes is less than two, no rule can be generated. In that case, union of all the statistically significant genes from the top 100 genes (features) for the four sub-datasets (NDE, NDM, NNDE and NNDM) are considered for next step (rule mining). A latest weighted association rule mining methodology namely “RANWAR” [26], is then utilized on the geneset in order to produce the top selected relationships (i.e., rules) among these oncogenes. Furthermore, the corresponding integrated oncogenic markers are highlighted. As a case study, we demonstrate our proposed framework using gene expression array-based data, and DNA methylation array-based (Methylation27k) data in acute myeloid leukemia (AML) as well as prostate carcinoma (PC).
Furthermore, we carry out literature search as well as KEGG pathway and Gene-Ontology (GO) analyses for biological validation of the top oncogenes satisfying the resultant top rules. We finally highlight a few top-ranked rules and corresponding integrated markers along with several supportive biological information. Since we have verified data-distribution prior to the application of the statistical test, we expect the statistical errors in our proposed framework of integrated marker identification would be reduced. Moreover, in this framework, we have integrated four major properties, i.e., data-distribution, statistical hypothesis testing methodology, feature selection and association rule mining. Therefore, the results from the analysis are likely more informative towards the indication of disease condition.
RELATED TERMS
In the information theory, entropy is a measure that estimates the uncertainty or randomness of the connecting event (information) [27]. We use Shannon entropy, a popular measure that measures the expected score of the information regarding a message. Here, the message is used in order to mention a specified realization of the respective variable. However, the entropy of a discrete variable C is described as follows.
Here p(c) denotes the probability mass function of the variable C and we take b as 2 in log function.
Mutual information (MI) [28] between two arbitrary variables (or vectors) signifies the amount of shared information between themselves. In other words, MI actually measures how much information (knowledge) regarding one variable or vector can be generated through the knowledge of the other variable/vector [27]. Thus, it estimates the mutual dependency between the two variables (or vectors). If MI is zero, it illustrates that the related variables (or vectors) are completely independent with each other. On the other hands, if the value of MI is higher (i.e., nearest to 1), it signifies that these two variables (or vectors) are highly dependent with each other. Let C1 and C2 be the two discrete variables, the MI between them is described as follows
| (1) |
Here, p(c1) and p(c2) denote the probability mass functions of the vectors C1 and C2, respectively, whereas p(c1, c2) signifies the joint-probability mass function between C1 and C2, successively. However, according to the work in [29], the normalized mutual information between C1 and C2 (let, MInm(C1; C2)) is calculated as follows
| (2) |
In addition, class relevance of a gene (feature) refers to the mutual dependency between the class-variable and the gene (feature). Here, the mutual dependency can be evaluated by the normalized mutual information (i.e., MInm). On the other hand, the redundancy between the two genes (features) can be computed by the mutual dependency (i.e., the normalized mutual information) between these two genes (features). Of note, the combination of higher relevance score and the smaller redundancy score signifies a robust and efficient gene-selection criteria. There are many gene-extraction (feature-extraction) algorithms available. Among them, mRMR-based technique (minimal Redundancy Maximal Relevance criterion based feature selection) [24] is one of the best methodologies.
Association rule mining (ARM) [30–32] is a well-known technique for identifying interesting relationships (associations) among different items (genes). Let, GS = {g1, g2, …, gn} is a geneset (itemset) and SS = {s1, s2, …, sm} is sample-set (transaction-set). Therefore, an association rule can be depicted as AN ⇒ CN, where AN, CN ⊆ GS and AN ∩ CN = ϕ. Here, AN and CN are stated as antecedent (left hand side or LHS) and consequent (right hand side or RHS), respectively. For example, in a transactional database (like shopping mall), a transaction might contain a set of purchased items within it. Similarly, in any tissue-sample (i.e., transaction) of an expression or methylation dataset, many genes occur in combination. Some of these genes might be hypo-methylated/upregulated and some of these genes are hyper-methylated/down-regulated, whereas the rest of the genes are non-differentially methylated or expressed (that means neither hypo-methylated/upregulated nor hyper-methylated/down-regulated). Now, in the case of the biological transaction, let {gene1 ↓, gene2 - ⇒ gene6 ↑} be an association rule: if gene1 is down-regulated (depicted as ↓) and gene2 is simultaneously hypo-methylated (depicted as “−”), then gene6 is likely to be up-regulated (denoted by ↑). We expect these three genes together and their relationship will likely occur in many samples (transactions) of the dataset. However, the support (frequency) of a geneset (item-set) is described as the number of samples (transactions) in which all participating genes (items) belonging to the geneset occur simultaneously. A geneset will be frequent if the support (frequency) is greater than any user-defined cutoff value (i.e., minimum support cutoff). The confidence (strength) of the rule can be defined as the ratio of the support of the complete geneset to the support of its antecedent part (LHS) only.
Apriori [30] is a fundamental technique to build genesets of interest and then generate the respective association rules of the genesets in order to control the transactional database. Apriori basically follows a “bottom-up” procedure in which frequent subsets are extended by one gene (item) at a time for extracting each candidate, and the groups of the candidates are thereafter verified against the data. This process terminates when there is no any further successful extension. The outcome of Apriori method is in the form of the sets of rules which signify the appearance of genes in the dataset. Notably, Apriori follows the breadth-first search for counting the candidate genesets. Apriori generates candidate genesets of the length r from genesets of the length r − 1. After that, it removes the candidate genesets which are infrequent sub-patterns. Each resultant candidate set must have all frequent genesets. However, from each of the candidate genesets, we obtain many association rules. Thereafter, the confidence (strength) of each extracted rules for each candidate geneset is computed and then verified whether the confidence of the extracted rules are greater than equal to the user-defined minimum confidence value. Finally, the satisfied rules are considered as final outcomes.
The number of generated rules from any transactional dataset is huge, and most of them are redundant. In addition, the quality (priority/weight) of each gene assumes the same. In order to ease these two limitations, many new rule mining techniques such as RANWAR [26] have been proposed.
LITERATURE REVIEW
Currently, numerous single genetic markers have been reported in literature [33–42]. For examples, Huang et al. (2010) [40] provided a significant framework for recognizing disease-specific biomarkers for gene expression profiles specially for cancer. Wang et al. (2015) [16] provided the role of the respective heterogeneous DNA methylation during the tumorigenesis through the analysis on the gene expression data. In other work, a combined analysis of epigenomic and transcriptomic modifications is conducted to identify changes disturbed by the BRAFV 600E through the comparative study between the methylation and gene expression profiles of the melanoma tumor growth [43]. Zheng et al. [42] proposed a methodology by integrating gene expression profiles and high-throughput protein-protein interaction data in order to find the dysregulated biological networks in the progression of hepatitis C virus induced hepatocellular carcinoma (denoted as HCV-induced HCC) disease. Furthermore, Mallik et al. [44] developed an approach of biomarker discovery depending upon the eigenvector centrality-based ranking of genes in the transaction factor (TF), microRNA (miRNA) and gene network in a multiview uterine leiomyoma dataset consisting of both the gene expression and methylation profiles. An integrated study of potential intrinsically disordered proteins (IDPs) and transcriptomic analysis of the genes for the transcripts encoding IDPs are also performed by Mallik et al. [38] on the prostate carcinoma epigenetic data covering gene expression and methylation. Furthermore, many new strategies have been proposed to either identify differentially expressed genetic markers, perform their respective enrichment study, or both for many rare diseases. For example, Coburn et al. [41] proposed a new strategy to deal with inflammatory bowel disease (i.e., IBD). New approach of gene set enrichment analysis on dental caries genome-wide association study dataset is also described in reference [39]. Besides that, Mallik et al. [9,10] developed a new technique regarding the analogous topological features for the co-evolutionary network pattern of the ribosome that helps to make differentiation between the various rRNA regions having the rapid reconstitutions from obstructions through the kinetic traps. Mukhopadhay et al. [18] proposed a particles-warm optimization based gene-marker discovery technique. Building on the productive research for single marker discovery, now investigators aim to find combinatorial gene-based markers for disease [45–50].
It is noted that in recent times, different research fields are integrated for solving a specified problem involving complex or heterogeneous data in disease. In this case, our main goal is to identify integrated markers that are effective on predicting disease condition or outcome. As mentioned in Introduction, normalized mutual information based feature selection is effective for eliminating redundant genes from the underlying data and picking up oncogenes. Furthermore, proper selection of statistical testing technique is very important task depending upon data-distribution property for oncogene selection. The simultaneous utilization of these two techniques makes the oncogene identification process better in all perspectives. It requires to generate relationships between the resultant oncogenes. Hence, association rule mining technique helps to produce such oncogenic relationships in the structure of rules depending upon the support (frequency) and confidence (strength) measures of the corresponding genesets. According to the literature, there is no such method where data-distribution, feature selection, statistical test and association rule mining are utilized together to produce integrated markers. Hence, we develop an ARM-based approach of finding integrated oncogenic markers using MI-based statistically significant feature selection for the multi-domain dataset containing the gene expression and methylation information. We apply it to acute myeloid leukemia that has both expression and methylation data. For the purpose of validation of the extracted markers, we perform literature search as well as KEGG pathway and GO analyses through a latest enrichment tool Enrichr. It is highly expected that our framework provides a new sophisticated way of identifying integrated markers.
PROPOSED INTEGRATED MARKER INDENTIFICATION METHOD
In this article, we develop an ARM-based framework for generating statistically significant most relevant and minimally redundant markers through a popular feature selection method “mRMR” (minimal Redundancy Maximal Relevance criterion based feature selection) [24], using the genomic data of both expression and methylation. The steps of the proposed framework are demonstrated as follows.
Data normalization and normality test
Initially, we choose the (matched) genes of the multidimensional dataset that contains both the expression and methylation information. After that, the gene expression and methylation data corresponding to each matched gene is normalized through the utilization of zero-mean normalization. It is noted that the zero-mean normalization is described as follows.
| (3) |
where the values of j lies in between 1 and the size of the sample. Besides, μ and σ refer to average (mean) and standard deviation, respectively, for each gene in the expression or methylation data before normalization. Additionally, x(j) and xnm(j) denote the value of j-th sample of the gene-wise data before and after normalization, respectively.
Normality test
After normalization, we apply a well-known normality test namely Jarque-Bera test [22] to the normalized data to divide the whole dataset into two parts, one part that holds the normal distribution, whereas remaining part that does not follow normal distribution. The Jarque-Bera test is formulated as follows
| (4) |
where Ks is the kurtosis of the sample, Sk refers to the skewness of the sample, and dg stands for the degree of freedom.
After utilizing the normality test on the expression data, two different categories of sub-datasets have been generated, i.e., NDE, and NNDE. Similarly, for the methylation data, the normality test produces another two categories of sub-datasets, i.e., NDM, and NNDM.
Identifying the highest relevant and lowest redundant genes
After accumulating the four categories of sub-datasets, we apply a popular feature-selection method, “mRMR” (minimal Redundancy Maximal Relevance criterion based feature selection) [24] for identifying the top-ranked genes that has maximal relevance as well as minimal redundancy. To compute the normalized mutual information, we discretize the sample values of each gene for every sub-dataset into three major states (i.e., “0”, “1” and “2”) before using the aforementioned feature-selection method. Let Dcxnm(j) denotes the discretized value of j-th sample for every gene-data. The discretization step is here described in the following
| (5) |
After the discretization, the feature-selection technique (i.e., “mRMR”) is discussed as follows. Suppose, PFS be the preliminary feature-set (geneset) having “N” number of features (genes) and FFS be final (resultant) feature-set. Our goal is to select top “t” number of features through the feature selection technique. Initially, PFS consists of “N” number of features, while FFS is empty. Firstly, we calculate normalized mutual information for every feature with respect to class-variable (let, V ) through the way given below
| (6) |
where 1≤j≤N. Here, MI(fj; V) stands for mutual information between the feature fj and the class-variable V as described in the following:
| (7) |
where b is set as 2. However, in Equation (6), ET(fj) denotes the entropy of the feature fj (discrete variable) which is defined as: ET(f j)=−Σa∈fjp(a)logbp(a), where p(a) is the probability mass function of fj, and the value of b is taken as 2. In Equation (6), ET(V) stands for the entropy of the class-variable V (discrete variable) that is defined as: ET(V)= −Σa∈V p(a)logbp(a), where p(a) is the probability mass function of V, and the value of b is set as 2.
After that, we get the feature (let, fbest) for which the respective normalized mutual information with respect to the class-variable becomes highest among all the features. That feature is then kept into FFS. This feature is the topmost chosen gene. Therefore, the value of t is now 1. This gene is then discarded from PFS. The fbest is obtained through the following manner: MInm(fbest; V)= maxj = 1, …,N {MInm (fj; V )}. FFS and PFS are then updated as FFS ← { fbest }, and PFS ←{PFS\fbest}. It is noted that in all the cases except the selection of the topmost gene, we have to compute the normalized mutual information for each feature-pair (say, (fj, fk)) where fj∈PFS and fk∈FFS. This signifies as follows
| (8) |
where
To determine the second top feature, we need to identify the current highest relevant and lowest redundant gene from PFS. Thus, we select feature fj∈PFS for which the value given below becomes maximum.
| (9) |
Thereafter, we include the second top feature to FFS, and subsequently discard the feature from PFS; i.e., FFS ← FFS∪{g = fj }, and PFS ← PFS\{ fj }. After identifying the second top feature, we again perform the same step from Equation (8) for determining the third top feature, and so on until |FFS| = t has been made. We finally acquire all the chosen (selected) top features (genes) from FFS after the completion of the aforementioned iterations. It is noted that the examples of computing the normalized mutual information between a feature and the class-variable (MInm (f; V )) in Table 1.
Table 1.
Example of computing the normalized mutual information between a gene (MInm(f; V )) and the class-variable.
| V | f |
|---|---|
| 1 | 2 |
| 1 | 2 |
| 1 | 2 |
| 1 | 2 |
| 0 | 1 |
| 0 | 1 |
| 0 | 0 |
| 0 | 1 |
There are three states (i.e., “0”, “1” and “2”) of feature “f” in the discretized format, whereas class-variable “V” consists of two states (viz., “1” and “0”) of which “1” denotes experimental sample and “0” refers to normal sample.
However, this feature-selection technique is applied to NDE, NDM, NNDE and NNDM, subsets, respectively, and then determine some specific number of top highest relevant and lowest redundant features from each subdataset.
Statistical hypothesis tests and oncogene identification
After identifying the specific number of top features by mRMR feature selection method, we carry out proper statistical hypothesis test on these top features of each of the four sub-datasets (NDE, NDM, NNDE, and NNDM). Since parametric hypothesis test is a well-performer in the normally distributed data-domain, Welch t-test (a parametric hypothesis test) [25] is utilized on the NDE subdata of these top selected features as well as the NDM subdata of these top selected features in order to determine a list of differentially expressed or differentially methylated features (oncogenes) through the joint thresholds, p-value threshold and fold change cutoff. In a similar fashion, we find the specified number of top selected features by mRMR feature selection method from NNDE sub-data as well as NNDM sub-data. Since non-parametric hypothesis testing methods generally work good in non-normally distributed data-domain, therefore a non-parametric test, Shrink t-test [5] is applied on the NNDE sub-data of these top selected features as well as the NNDM sub-data of those intersected features to identify list of differentially expressed or methylated features (oncogenes) through the joint thresholds, p-value threshold and fold change cutoff.
| Marginal and joint probability calculation: |
| Mutual information calculation: |
| Entrophy computation: |
| Normalized mutual information calculation: |
A gene is considered as up-regulated (UPR) if its FC is greater than or equal to a user-specified (higher) cutoff, as down-regulated (DNR) if FC is less than or equal to the another user-defined (lower) cutoff. Similarly, a gene is hyper-methylated (HERM) if FC is greater than or equal to the user-specified (higher) cutoff, while it will be hypomethylated (HOM) if FC is less than or equal to the user-defined (lower) cutoff.
Next, we have identified the genes that have inverse relationship between the expression and methylation data for normal distribution as well as non-normal distribution. In other words, we have performed the intersection between these statistically significant (resultant) genes from the top 100 genes (features) for NDE and NDM as well as from the top 100 genes (features) for NNDE and NNDM. Next, we carry out the union of all the intersecting results. But, if the number of such intersected genes is less than two, no rule can be generated. In that case, union of all the statistically significant genes from the top 100 genes (features) for the four sub-datasets (NDE, NDM, NNDE and NNDM) are considered for next step (rule mining). Let us assume that the resultant geneset after union is denoted as ONCG (oncogenic geneset).
Discretization
After that, we focus on finding the relationships between the resultant oncogenes belonging to the set ONCG. Since the whole data is already normalized gene-wise using zero-mean normalization (as mentioned in the Section of Data Normalization and Normality Test), thus we carry out the discretization of gene-wise data of the set ONCG by the following manner.
| (10) |
where D is the normalized data-matrix of set ONCG, and DisD is the discretized matrix. Here i and j signify gene-id (row) and sample-id (column), respectively. Here, upregulated and downregulated oncogenes are signified by UPR and DNR, respectively, whereas hyper-methylated and hypo-methylated oncogenes are represented by HERM and HOM, respectively. Thus, Equation (10) states that the value of the cell for D which is greater than 0 (i.e., the mean), is exchanged by 1 (referred to either UPR or HERM oncogene), and the value of the cell which is less than 0 (i.e., the mean), is substituted by 0 (denoted as either DNR or HOM oncogene).
Post-discretization
After the discretization step, there are four types of genes for the expression data, (i) UPR (represented by 1 in DisD), (ii) DNR (represented by 0 in DisD), (iii) ~UPR, and (iv) ~DNR. Similarly, for methylation data, we have also found four types of genes, (i) HERM (represented by 1 in DisD), (ii) HOM (represented by 0 in DisD), (iii) ~HERM, and (iv) ~HOM. Since association rule mining methodology only recognizes binary-numbers (i.e., 0 and 1), post-discretization is required in order to present the aforementioned four categories of genes through these two binary-numbers. In order to perform post-discretization, we transpose the discretized matrix (i.e., DisD’ ), and then double the size of columns denoting the number of genes of transposed matrix DisD′. After doubling the size of columns, 1st half refers to the domain of UPR/HERM and 2nd half signifies the domain of DNR/HOM. In the 1st half, 1 represents UPR/HERM category, and 0 denotes ~UPR/~HERM category. In case of the 2nd half, 1 depicts DNR/HOM type, whereas 0 refers to ~DNR/~HOM property.
| (11) |
| (12) |
Here, PDisD denotes the post-discretized matrix of size m × (2 × q), where q refers to the number of oncogenes belonging to the set ONCG, and m is the number of samples for each oncogene. We provide an example of discretization and post-discretization in Figure 1.
Figure 1. Example of the step post-discretization in our proposed framework.

“↑” and “↓” denote up-regulation and down-regulation successively, whereas “+” and “−” refer to hyper-methylation and hypo-methylation respectively. Here, sds and snor signify diseased and normal samples, successively. “nE” and “nM” denotes normalized expression and methylation profiles, respectively.
Determining gene-relationships through weighted association rule mining
After post-discretization, we utilize a latest weighted rule mining methodology, RANWAR [26] to the transposed matrix of PDisD, and extract some specified number of top association rules that depict the top relationships among different oncogenes. A concise description of RANWAR is provided as follows.
RANWAR is basically a modified (weighted) version of the traditional association rule mining algorithm, Apriori [30]. RANWAR is developed based upon two rule-interestingness measures (i.e., rank-based weighted condensed support (wcs) [26], and rank-based weighted condensed confidence (wcc) [26]). In statistical scenario, these measures are made of the concept of the independence among the involved oncogenes. Suppose, vwrk is the weight of the gene k in r-th transaction. If a gene symbolized as gnek is present in r-th transaction/sample (viz., tr), the weight of that gene (i.e., wk) becomes the value of vwrk. On the other hand, if gnek is absent in tr, then vwrk will be zero. This formulation is depicted as follows
However, geneset-sample weight of any geneset GS (i.e., WTr(GS)) is defined as multiplication of the weights of all the genes belonging to the geneset in a particular sample of the underlying dataset. This is computed as: . The geneset-sample weight is then applied to the wcs and wcc rule-interestingness measures. wcs is defined in RANWAR as follows
| (13) |
where m is the number of samples in the underlying dataset. However, m’ (GS) is here obtained as , where BTrk denotes the binary number (digit) of the oncogene gnek in the r-th sample (where, k = 1, 2, …, R). Furthermore, let At and Ct are antecedent and consequent respectively of the geneset GS. wcc is formulated in RANWAR as follows
| (14) |
In RANWAR [26], firstly wcs of the 1-genesets are calculated. The frequent singleton genesets whose wcs values are larger than or equal to the user-defined minimum support threshold (i.e., min-wsupp), are then recognized. Similarly, their supersets 2-genesets are generated and thereafter frequent 2-genesets are found. The respective rules are produced from these frequent 2-genesets; and wcc of each rule is then computed. The rules whose wcc are larger than or equal to the user-defined minimum confidence cutoff (i.e., min_ wconf ), are picked up as resultant rules. After that, their supersets 3-genesets are generated and frequent 3-genesets are then identified. The respective significant rules are extracted from those genesets, and so on. The run breaks when no any successful extension of the frequent genesets can be found. The resultant rules are rearranged with respect to wcc.
However, in our current pipeline, after the postdiscretization, we apply RANWAR algorithm through the user-defined thresholds (i.e., min_wsupp and min_wconf values), and extract the oncogenic-relationships (i. e., oncogenic-rules). Further, the respective integrated markers of these rules are highlighted. For example, {gene1, gene2-⇒ gene6↑}; which states that if gene1 is downregulated (denoted as “↓”) and gene2 is hypomethylated (denoted as “−”) simultaneously in the multidomain dataset having both expression and methylation values, gene6 is likely to become up-regulated (referred to as “↑”) in that multi-view dataset. Thus, the integrated marker for this rule is {gene1↓∪gene2-∪gene6↑} that signifies that it is likely that the joint event of the three participating genes with their specific status (i.e., gene1 in down-regulation, gene2 in hypo-methylation and gene6 in up-regulation) causes the respective disease. Moreover, it is noted that in our resultant rules/markers, “↑”, “↓”, “+” and “−” stand for up-regulation, down-regulation, hypermethylation and hypo-methylation, respectively throughout the manuscript.
We carry out literature search and pathway enrichment analyses through an online tool Enrichr [51]. This helps us to identify the status of the integrated markers depending upon the available information of the direct or indirect associations between the participating oncogenes of the markers and the respective disease. We use three categories of status of the integrated markers: “Completely Existing” marker, “Partial” marker and “(Completely) Novel” marker that are denoted by “CE”, “P” and “NV”, respectively. An integrated marker can be stated as “CE” if the information regarding the association of all the participating oncogenes in the integrated marker for the leukemia is available either through the literature evidence or pathway enrichment or GO enrichment analysis. Similarly, an integrated marker becomes “P” if the information regarding the association of only some of the participating oncogenes in the integrated marker for the leukemia is available either through the literature evidence or KEGG pathway or Gene-Ontology analysis. Finally, an integrated marker is “NV” if no information about the association of any of the participating oncogenes in the integrated marker for the leukemia is found through the literature evidence or pathway enrichment or GO enrichment analysis. The novel markers identified from our framework recognized might be especially useful for hypothesis generation and future investigation.
Figure 2 summarizes the flowchart of our proposed framework of identifying oncogenic rules through integrated study for multi-domain dataset consisting of expression and methylation datasets.
Figure 2.

Flowchart of our proposed framework of identifying oncogenic rules through integrated study for multi-view dataset consisting of expression and methylation datasets.
APPLICATION
Experimental dataset
AML genomic dataset [52] including both microarray based gene expression and DNA methylation (Methylation27k) is used to test our approach. The expression dataset consists of 20,113 genes in 179 samples, whereas the methylation dataset contains 27,578 methylation probes in a total of 194 samples. Overall, the two datasets contain 34 matched diseased samples and 140 matched control samples.
In addition, a prostate carcinoma (PC) genomic dataset having microarray based gene expression and DNA methylation (NCBI reference identifier: GSE55599) [53] is utilized for testing the proposed framework. The expression dataset consists of 47,231 probes in 48 samples, whereas the methylation dataset contains 456,271 methylation probes in 48 samples. In total, the two datasets consist of 32 matched diseased (PC) samples and 16 matched control (benign prostatic hyperplasia) samples.
Experimental results
We first select the genes having both the expression and methylation values for AML dataset as well as PC dataset. Since many genes have more than one methylation probes, we eliminate the methylation probes that contain missing values, and then individually process every probe of each gene. The median absolute deviation (denoted as “MAD”) score is then computed for each probe in case of expression dataset as well as methylation dataset for AML dataset as well as PC dataset. The probe that consists of maximum MAD score among all the probes related to a single gene, is selected, and other probes for that gene are discarded from the expression data as well as the methylation data for the AML dataset as well as the PC dataset. This step is applied for the other genes for the expression data as well as the methylation data for the AML or PC dataset.
For AML dataset, after the elimination of the redundant probes for each gene, we obtain a total of 13,703 matched genes between the methylation dataset and the expression dataset. Similarly, we identify a total of 18,309 common genes between the methylation dataset and the expression dataset for PC dataset. Zero-mean normalization and normality test are then carried out respectively on the resultant expression data as well as the resultant methylation data.
For AML dataset, we perform intersection between the two genesets found in NDE and NDM, and identify a total of 166 (= 3, 955 ∩ 576) genes which signify the normally distributed genes having both the expression and methylation data-values. Similarly, the intersection operation is carried out between the two genesets got in NNDE and NNDM, and we obtain a total of 9,338 (= 9, 748 ∩ 13, 127) genes that signify non-normally distributed genes consisting of both the expression and methylation data-values. Now, we only consider these two types of resultant intersected genes. Both of the NDE and NDM sub-datasets now contain 166 common genes, whereas both of the NNDE and NNDM sub-datasets have 9,338 common genes. Thereafter, the mRMR feature selection methodology is utilized on the aforementioned four subdatasets individually in order to obtain top 100 genes. The reason for choosing top 100 because this would give us enough candidates for further exploration of evidence, but it will not include candidates with weak signals. The maximum score of the feature selection through mRMR method at each iteration for NNE sub-dataset is depicted in Figure 3. Here, we pick up a single gene that has the maximum feature selection score (i.e., Fs_maxscore as mentioned in the next paragraph of Equation (9)) for each iteration. Similarly, the maximum score of the feature selection by the mRMR method at each iteration for NNM sub-dataset is shown in Figure 4, whereas such scores for NNNE and NNNM sub-datasets are represented in Figure 5 and Figure 6, respectively. We also make intersection on the resultant top 100 genes from NDE and NDM subdatasets, and identify 67 common genes between these two; whereas we obtain only 5 common genes between the resultant top 100 genes from NNDE and NNDM subdatasets.
Figure 3. Maximum score of feature selection (i.e., Fs_maxscore) at each iteration (up to 100 iterations) for NNE sub-dataset of AML dataset.
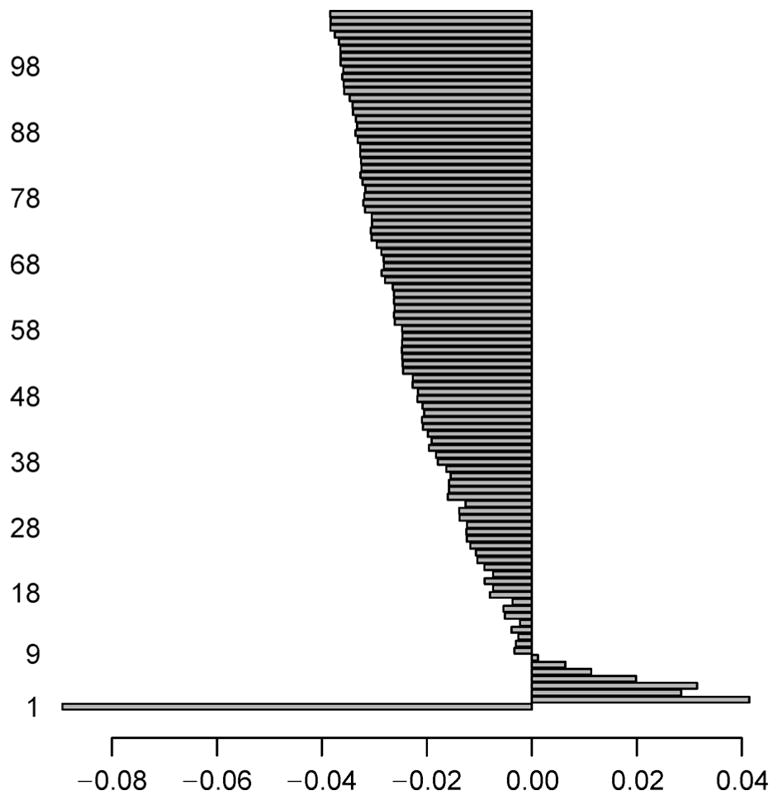
Notably, horizontal axis denotes Fs_maxscore, whereas vertical axis represents interation ID of feature selection.
Figure 4. Maximum score of feature selection (i.e., Fs_maxscore) at each iteration (up to 100 iterations) for NNM sub-dataset of AML dataset.
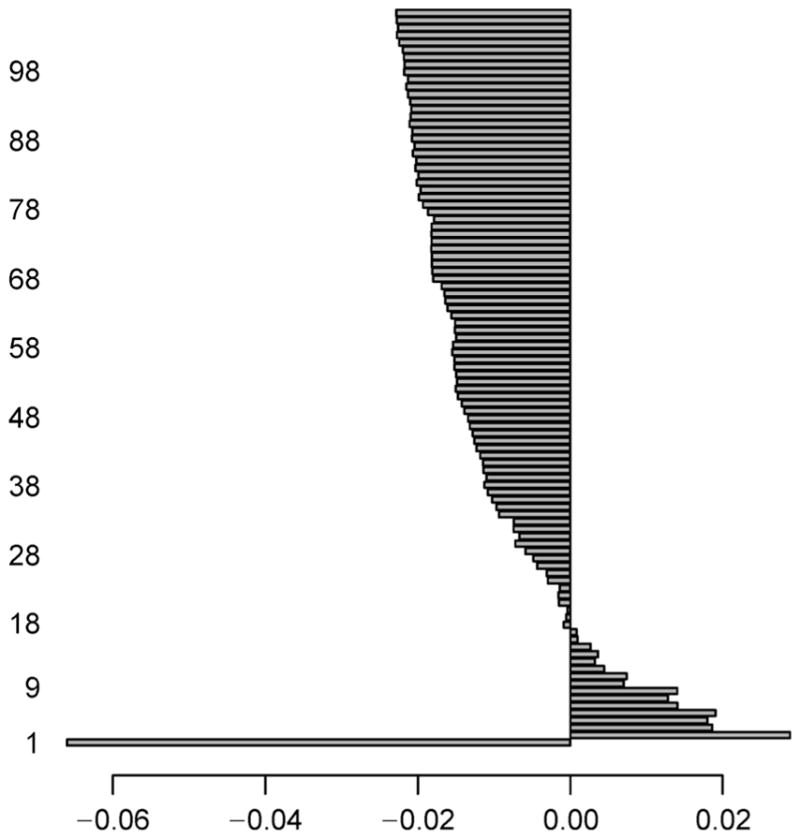
Notably, horizontal axis denotes Fs_maxscore, whereas vertical axis represents iteration ID of feature selection.
Figure 5. Maximum score of feature selection (i.e., Fs_maxscore) at each iteration (up to 100 iterations) for NNNE sub-dataset of AML dataset.
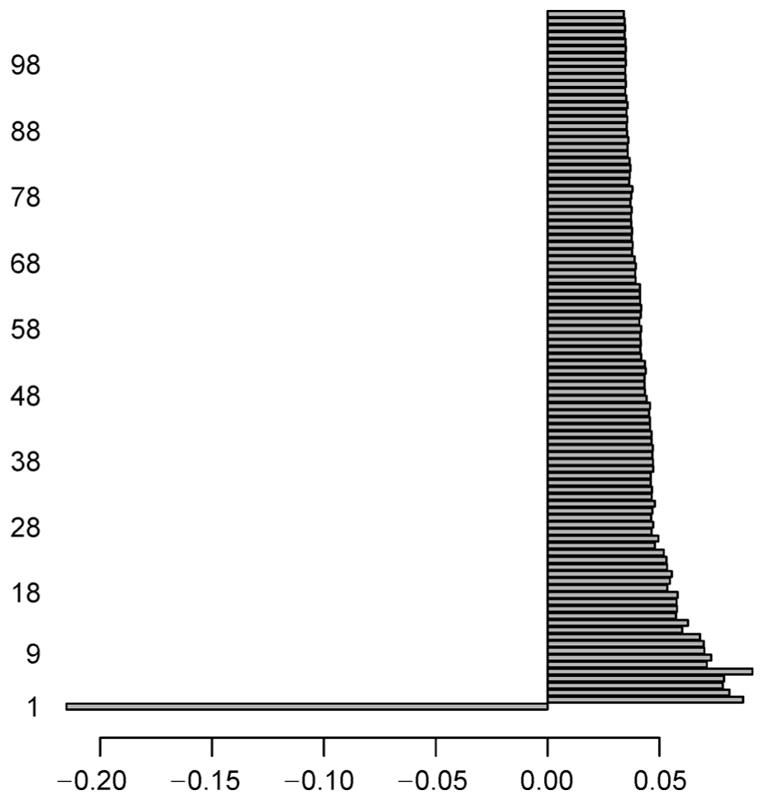
Notably, horizontal axis denotes Fs_maxscore, whereas vertical axis represents iteration ID of feature selection.
Figure 6. Maximum score of feature selection (i.e., Fs_maxscore) at each iteration (up to 100 iterations) for NNNM sub-dataset of AML dataset.
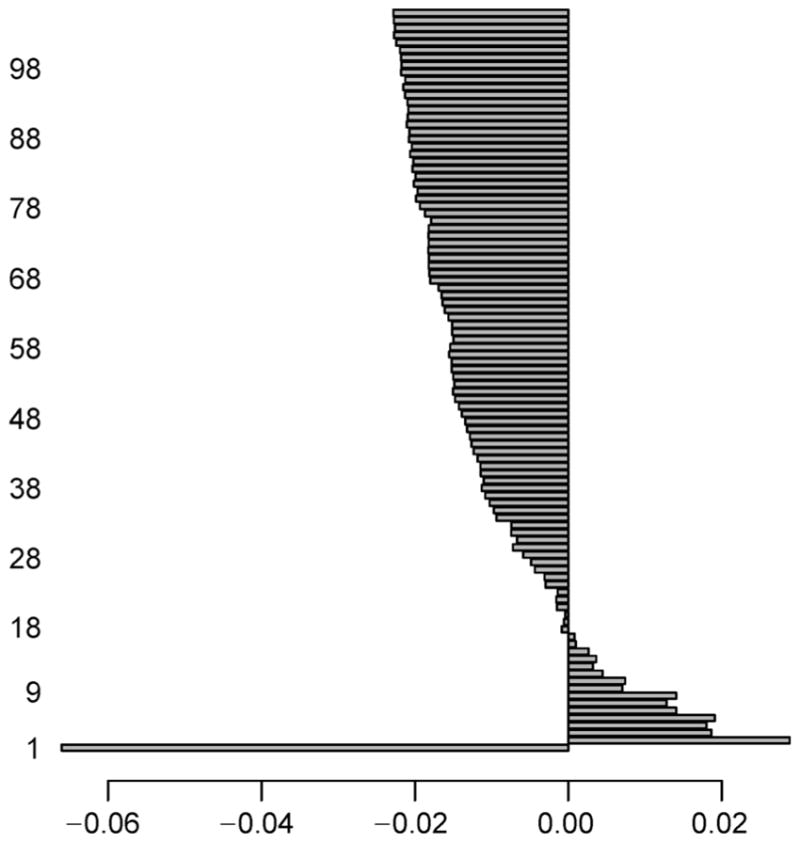
Notably, horizontal axis denotes Fs_maxscore, whereas vertical axis represents iteration ID of feature selection.
Combination of the well-known parametric test, Welch t-test, and FC to assess the top 100 genes may provide a proper way to measure statistically significance in terms of means and standard deviation and to pick up strong signals. We apply to the top genes from NDE sub-dataset as well as NDM sub-dataset, individually. We set traditional p-value cutoff 0.05, upper fold change cutoff 1.50 and lower fold change cutoff 0.67 in global. For NDE/NDM sub-dataset, we have not obtained any statistically significant genes. A non-parametric test, Shrink t-test, and fold change (FC) technique are both utilized on the top 100 resultant genes obtained from NNDE sub-dataset as well as NNDM sub-dataset, individually. Using the aforementioned p-value cutoff and the fold change cutoff, for NNDE sub-dataset, we obtain 42 statistically significant genes (Table 2) of which 38 (e.g., IL7 having p-value = 4.38E-10 and FC = 3.33, PRSS2 having p-value = 6.45E-06 and FC = 4.81) are upregulated and four genes (e.g., KRT17 having p-value = 2.7E-04 and FC = 0.25, TRIM36 having p-value = 6.06E-04 and FC = 0.38) are down-regulated. Similarly, setting the same p-value cutoff and the fold change cutoff in NNDM sub-dataset, we accumulate 19 statistically significant genes (highlighted in Table 2) of which 8 (e.g., TSPAN6 having p-value = 3.82E-06 and FC = 2.23, RFX4 having p-value = 1.98E-09 and FC = 2.2) are hyper-methylated and 11 genes (e.g., BST2 having p-value = 1.23E-11 and FC = 0.29, PTK2 having p-value = 1.38E-07 and FC = 0.40) are hypomethylated.
Table 2.
The number of identified oncogenes for the four sub-datasets in the AML dataset.
| Sub-dataset | Number of oncogenes |
|---|---|
| NDE | – |
| NNDE | 42 |
| NDM | – |
| NNDM | 19 |
These 61 (= 0 + 0 + 42 + 19) statistically significant genes would be playing the role of either oncogenes or tumor suppressor genes for the AML. These genes are either differentially expressed or differentially methylated or both in nature. In addition, we carry out intersection between the 42 statistically significant oncogenes of NNDE sub-dataset (denoted as SSNNDE) and the 19 statistically significant oncogenes of NNDM sub-dataset (referred to as SSNNDM), and identify only a resultant intersected oncogene (PROS1) that is both up-regulated as well as hypo-methylated. The p-value and FC value of the oncogene PROS1 in the NNDE sub-dataset are 0.0031 and 1.89, whereas the p-value and FC value of this gene in the NNDM sub-dataset are 3.39E-06 and 0.56. The heatmap for the resultant 61 oncogenes for the expression dataset is depicted in Figure 7, whereas heatmap for the resultant 61 oncogenes for the methylation dataset is shown in Figure 8.
Figure 7. Heatmap for the resultant oncogenes for the AML expression dataset.

Notably, horizontal axis denotes oncogenes, whereas vertical axis depicts samples.
Figure 8. Heatmap for the resultant oncogenes for the AML methylation dataset.

Notably, horizontal axis denotes oncogenes, whereas vertical axis depicts samples.
After the identification of the 61 oncogenes, we utilize RANWAR method to generate the relationships among the oncogenes through providing user-defined minimum weighted support threshold 0.10 and user-defined minimum weighted confidence threshold 0.50. It is noted that here the cutoffs are fixed in such a way that we obtain those rules that have higher confidence. Thus, weighted confidence threshold is kept as high as possible (= 0.50 or 50%). Sometime it happens that a highly confident rule might have low support. Thus, we keep weighted support cutoff as low as possible (= 0.10 or 10%) by which lowest (weighted) frequent rules can also extracted along with highest (weighted) frequent rules. However, the respective integrated markers (i.e., genesets) from which the rules are generated, are also highlighted. The resultant rules along with their corresponding markers (gene-sets) are then ranked by their weighted confidence values in descending order (i.e., best to worst cases). Thereafter, the redundant markers are eliminated from the list. For example, {BST2-, KRT17↓, LIMCH1-→PTK2-} rule comes from the geneset (integrated marker) namely {BST2-∪KRT17↓∪LIMCH1-∪PTK2-} of which wcc value is 91.36%; whereas {BST2-, KRT17↓, PTK2-→ LIMCH1-} rule generates from the geneset (integrated marker) namely {BST2- ∪KRT17↓ ∪PTK2- ∪ LIMCH1-} whose wcc value is 91.23%. That means both the rules are prepared from same geneset (integrated marker). Since the first mentioned geneset (marker) contains higher wcc value than the second geneset (marker), the first mentioned marker is selected and the second marker is discarded from our list. However, we choose top twenty rules from the ranked rule-list depending upon their wcc values, and highlight their respective integrated markers (i.e., genesets) in Table 3.
Table 3.
The top twenty oncogenic rules along with corresponding integrated markers for AML gene expression and methylation datasets.
| ID | Oncogenic rule | Respective integrated markers (Genesets) | Wcc (%) | Wcs (%) | Status of integrated markers |
|---|---|---|---|---|---|
| 1 | {KRT17↓, PHAK1↑⇒TRIM36↓} | {KRT17↓∪PHAK1↑∪TRIM36↓} | 96.97 | 10.21 | P |
| 2 | {ABCB11↑⇒KRT17↓} | {ABCB11↑∪KRT17↓} | 95 | 12.47 | NV |
| 3 | {ARHGAP8↑⇒ KRT17↓} | {ARHGAP8↑∪KRT17↓} | 93.94 | 16.78 | P |
| 4 | {KRT17↓, LOC100133669↑⇒TRIM36↓} | {KRT17↓∪LOC100133669↑∪TRIM36↓} | 93.75 | 11.29 | P |
| 5 | {PHAK1↑⇒ TRIM36↓} | {PHAK1↑∪TRIM36↓} | 93.33 | 15.13 | CE |
| 6 | {MYT1↑, TRIM36↓⇒ KRT17↓} | {MYT1↑∪TRIM36↓∪KRT17↓} | 92.86 | 10.63 | P |
| 7 | {PRSS2↑⇒PTK2-} | {PRSS2↑∪PTK2-} | 92.59 | 10.99 | CE |
| 8 | {BST2-, IL7↑⇒ PTK2-} | {BST2-∪IL7↑∪PTK2-} | 91.43 | 10.92 | CE |
| 9 | {BST2-, KRT17↓, LIMCH1-⇒ PTK2-} | {BST2-∪KRT17↓∪LIMCH1-∪PTK2-} | 91.36 | 13.58 | P |
| 10 | {IL7↑, PTK2-⇒DYDC1↓} | {IL7↑∪PTK2-∪DYDC1↓} | 91.12 | 11.41 | P |
| 11 | {BST2-, PHAK1↑⇒TRIM36↓} | {BST2-∪PHAK1↑∪TRIM36↓} | 91.04 | 10.35 | CE |
| 12 | {CHRDL1-, ⇒NRIL2-⇒ DYDC1↓} | {CHRDL1-,∪NRIL2-} | 90.99 | 13.35 | P |
| 13 | {AP1S1-, KRT17↓, NEIL2-⇒ DYDC1↓} | {AP1S1-∪KRT17↓∪NEIL2-∪DYDC1↓} | 90.91 | 15.33 | NV |
| 14 | {ARHGAP8↑⇒DYDC1↓} | {ARHGAP8↑∪DYDC1↓} | 90.91 | 14.14 | P |
| 15 | {IL7↑, KRT17↓, ⇒TRIM36↓} | {IL7↑∪KRT17↓∪TRIM36↓} | 90.91 | 12.51 | P |
| 16 | {BST2-, IL7↑, ⇒TRIM36↓} | {BST2-∪IL7↑∪TRIM36↓} | 90.74 | 12.76 | CE |
| 17 | {BST2-, CHRDL1-, DYDC1↓⇒ AP1S1-} | {BST2-∪CHRDL1-∪DYDC1↓∪AP1S1-} | 90.72 | 12.15 | P |
| 18 | {BST2-, DYDC1↓, NEIL2-⇒ AP1S1-} | {BST2-∪DYDC1↓∪NEIL2-∪AP1S1-} | 90 | 14.95 | P |
| 19 | {LOC100133669↑⇒ PTK2-} | { LOC100133669↑∪PTK2-} | 90 | 12.99 | P |
| 20 | {SRPX2↑⇒TRIM36↓} | { SRPX2↑∪TRIM36↓} | 89.74 | 13.26 | CE |
While “↑”, “↓”, “+”, and “−” stand for up-regulation, down-regulation, hyper-methylation, and hypomethylation, respectively.
Table 4 represents the profile status (i.e., either NDE, NDM, NNDE or NNDM), p-values, and fold-changes of the participating oncogenes of the top 20 integrated markers. For example, the top seventh integrated marker from our result is {PRSS2↑∪PTK2-}. It contains two oncogenes: PRSS2↑ and PTK2-, of which PRSS2↑ belongs to NNE profile (i.e., non-normally distributed expression subdataset), and PTK2-falls in NNM profile (i.e., non-normally distributed methylation sub-dataset). Furthermore, the p-value of PRSS2↑ gene in the Shrink t-test (non-parametric test) for its NNE profile is 6.45E-06, whereas the fold change value in its NNE profile is 4.81. The p-value of PTK2-gene in the Shrink t-test for its NNM profile is 1.38E-07, and its fold change value in its NNM profile is 0.40.
Table 4.
The participating genes of the top twenty rules.
| ID | Integrated markers | Participating genes | Profile status | p-values of genes | Fold change of genes |
|---|---|---|---|---|---|
| 1 | { KRT17↓∪PHKA1↑∪TRIM36↓} | KRT17↓ | NNE | 2.71E-04 | 0.2487 |
| PHKA1↑ | NNE | 7.89E-06 | 2.3986 | ||
| TRIM36↓ | NNE | 6.06E-04 | 0.3840 | ||
| 2 | { ABCB11↑∪KRT17↓} | ABCB11↑ | NNE | 7.78E-05 | 4.9724 |
| KRT17↓ | NNE | 2.71E-04 | 0.2487 | ||
| 3 | { ARHGAP8↑∪KRT17↓} | ARHGAP8↑ | NNE | 5.29E-07 | 2.7310 |
| KRT17↓ | NNE | 2.71E-04 | 0.2487 | ||
| 4 | { KRT17↓∪LOC100133669↑∪TRIM36↓} | KRT17↓ | NNE | 2.71E-04 | 0.2487 |
| LOC100133669↑ | NNE | 5.71E-07 | 2.6236 | ||
| TRIM36↓ | NNE | 6.06E-04 | 0.3840 | ||
| 5 | { PHKA1↑∪TRIM36↓} | PHKA1↑ | NNE | 7.89E-06 | 2.3986 |
| TRIM36↓ | NNE | 6.06E-04 | 0.3840 | ||
| 6 | { MYT1↑∪TRIM36↓∪KRT17↓} | MYT1↑ | NNE | 5.84E-06 | 3.1812 |
| TRIM36↓ | NNE | 6.06E-04 | 0.3840 | ||
| KRT17↓ | NNE | 2.71E-04 | 0.2487 | ||
| 7 | { PRSS2↑∪PTK2-} | PRSS2↑ | NNE | 6.45E-06 | 4.8053 |
| PTK2- | NNM | 1.38E-07 | 0.3955 | ||
| 8 | { BST2-∪IL7↑∪PTK2-} | BST2- | NNM | 1.23E-11 | 0.2876 |
| IL7↑ | NNE | 4.38E-10 | 3.3333 | ||
| PTK2- | NNM | 1.38E-07 | 0.3955 | ||
| 9 | { BST2-∪KRT17↓∪LIMCH1-∪PTK2-} | BST2- | NNM | 1.23E-11 | 0.2876 |
| KRT17↓ | NNE | 2.71E-04 | 0.2487 | ||
| LIMCH1- | NNM | 2.47E-07 | 0.4661 | ||
| PTK2- | NNM | 1.38E-07 | 0.3955 | ||
| 10 | { IL7↑∪PTK2-∪DYDC1↓} | IL7↑ | NNE | 4.38E-10 | 3.3333 |
| PTK2- | NNM | 1.38E-07 | 0.3955 | ||
| DYDC1↓ | NNE | 3.52E-02 | 0.2693 | ||
| 11 | { BST2-∪PHKA1↑∪TRIM36↓} | BST2- | NNM | 1.23E-11 | 0.2876 |
| PHKA1↑ | NNE | 7.89E-06 | 2.3986 | ||
| TRIM36↓ | NNE | 6.06E-04 | 0.3840 | ||
| 12 | { CHRDL1-∪NEIL2-} | CHRDL1- | NNM | 8.34E-06 | 0.4888 |
| NEIL2- | NNM | 5.57E-05 | 0.4749 | ||
| 13 | { AP1S1-∪KRT17↓∪NEIL2-∪DYDC1↓} | AP1S1- | NNM | 6.96E-03 | 0.3454 |
| KRT17↓ | NNE | 2.71E-04 | 0.2487 | ||
| NEIL2- | NNM | 5.57E-05 | 0.4749 | ||
| DYDC1↓ | NNE | 3.52E-02 | 0.2693 | ||
| 14 | { ARHGAP8↑∪DYDC1↓} | ARHGAP8↑ | NNE | 5.29E-07 | 2.7310 |
| DYDC1↓ | NNE | 3.52E-02 | 0.2693 | ||
| 15 | { IL7↑∪KRT17↓∪TRIM36↓} | IL7↑ | NNE | 4.38E-10 | 3.3333 |
| KRT17↓ | NNE | 2.71E-04 | 0.2487 | ||
| TRIM36↓ | NNE | 6.06E-04 | 0.3840 | ||
| 16 | { BST2-∪IL7↓∪TRIM36↓} | BST2- | NNM | 1.23E-11 | 0.2876 |
| IL7↑ | NNE | 4.38E-10 | 3.3333 | ||
| TRIM36↓ | NNE | 6.06E-04 | 0.3840 | ||
| 17 | { BST2-∪CHRDL1-∪DYDC1↓∪AP1S1-} | BST2- | NNM | 1.23E-11 | 0.2876 |
| CHRDL1- | NNM | 8.34E-06 | 0.4888 | ||
| DYDC1↓ | NNE | 3.52E-02 | 0.2693 | ||
| AP1S1- | NNM | 6.96E-03 | 0.3454 | ||
| 18 | { BST2-∪DYDC1↓∪NEIL2-∪AP1S1-} | BST2- | NNM | 1.23E-11 | 0.2876 |
| DYDC1↓ | NNE | 3.52E-02 | 0.2693 | ||
| NEIL2- | NNM | 5.57E-05 | 0.4749 | ||
| AP1S1- | NNM | 6.96E-03 | 0.3454 | ||
| 19 | { LOC100133669↑∪PTK2-} | LOC100133669↑ | NNE | 5.71E-07 | 2.6236 |
| PTK2- | NNM | 1.38E-07 | 0.3955 | ||
| 20 | {SRPX2↑∪TRIM36↓} | SRPX2↑ | NNE | 2.97E-05 | 2.5587 |
| TRIM36↓ | NNE | 6.06E-04 | 0.3840 |
Their data distribution and profile status, p-values and fold change values in expression/methylation dataset according to their status for AML gene expression and methylation datasets.
After the identification of the non-redundant integrated marker, we perform the literature search as well as KEGG pathway and GO analyses (GO-terms such as biological process, cellular component and molecular function) through the online tool Enrichr to assess the functional information of these genes. Table 5 depicts the disease-related direct literature evidences. For example, the association of IL7 gene and the Leukemia disease is found in [61,62]. According to [55–59], the BST2 is involved in the leukemia. As mentioned in [3,68,69], PTK2 gene is associated with leukemia since PTK2 expression has a direct correlation with the count of white blood during diagnosis.
Table 5.
The direct literature evidences of the association between the disease and the participating oncogenes of the top 20 integrated markers for AML gene expression and methylation datasets.
Furthermore, Table 6 shows the leukemia-associated KEGG pathways for the participating oncogenes of the markers along with the corresponding p-value of pathway enrichment as well as the supportive information regarding the relation between the highlighted KEGG pathway and leukemia disease. For example, IL7 gene is connected with some popular leukemia related significant KEGG pathways such as Jak-STAT signaling pathway (hsa04630) (p-value = 4.50E-05), cytokine-cytokine receptor interaction pathway (hsa04060) (p-value = 1.76E-14), and PI3K-Akt signaling pathway (hsa04151) (p-value = 1.29E-13). The association between the Jak-STAT signaling pathway and leukemia is reported in [71,72]. The connection between Jak-STAT pathway and AML is made though CEP-701, a staurosporine (indolocarbazole). Similarly, the involvement between the cytokine-cytokine receptor interaction pathway and leukemia is found in [73], whereas references [74–76] provide the required information of the relationship between the PI3K-Akt signaling pathway and leukemia. In addition, PTK2 is linked with some leukemia related pathways such as PI3K-Akt signaling pathway (hsa04151) [74–76] (p-value = 1.29E-13), calcium signaling pathway (hsa04020) [77] (p-value = 1.38E-13), focal adhesion (hsa04510) (p-value = 3.81E-11) [71], and regulation of actin cytoskeleton (hsa04810) [71] (p-value = 5.79E-12). PRSS2 is connected with a leukemia related pathway, transcriptional misregulation in cancer (hsa05202) [78] (p-value = 1.52E-07).
Table 6.
The disease-associative KEGG pathways of the participating genes of the top twenty integrated markers, the p-values of the KEGG pathways, and the supportive literatures regarding the association between the pathways and the disease for the AML gene expression and methylation datasets.
| Oncogene | Disease-associative KEGG pathways | p-value of pathways | Supportive literatures |
|---|---|---|---|
| IL7 | hsa04630: Jak-STAT signaling pathway | 4.50E-05 | [71,72] |
| hsa04060: cytokine-cytokine receptor interaction path-way | 1.76E-14 | [73] | |
| hsa04151: PI3K-Akt signaling pathway | 1.29E-13 | [74–76] | |
| PHKA1 | hsa04020: calcium signaling pathway | 1.38E-13 | [77] |
| PRSS2 | hsa05202: transcriptional misregulation in cancer | 1.52E-07 | [78] |
| PTK2 | hsa04151: PI3K-Akt signaling pathway | 1.29E-13 | [74–76] |
| hsa04020: calcium signaling pathway | 1.38E-13 | [77] | |
| hsa04810: regulation of actin cytoskeleton | 5.79E-12 | [71] | |
| hsa04510: focal adhesion | 3.81E-11 | [71] |
Table 7 summarizes the leukemia-related GO-terms for the participating oncogenes of the markers with pathway enrichment p-values and the supportive information about the association between the highlighted GO-term and leukemia. For example, PTK2 is linked with some disease-associated GO-terms like GO:BP of positive regulation of MAPK cascade (GO:0043410) (p-value = 6.39E-09), GO:MF of protein tyrosine kinase activity (GO:0004713) (p-value = 4.91E-05), GO:CC of focal adhesion (GO:0005925) (p-value = 7.31E-06), and GO: CC of adherens junction (GO:0005912) (p-value = 8.31E-09). The link between the GO:BP of positive regulation of MAPK cascade and leukemia is reported in Ref. [85], whereas the relation between GO:MF of protein tyrosine kinase activity and leukemia is identified in Ref. [86]. In addition, IL7 gene is involved with three disease-related GO-terms such as GO:MF of cytokine activity (GO:0005125) (p-value = 1.51E-10), GO:CC of extracellular region (GO:0005576) (p-value = 3.91E-07), and GO:CC of extracellular space (GO:0005615) (p-value = 1.49E-33). In Ref. [84], authors reported involvement of GO:MF of cytokine activity in leukemia. The association between the GO:CC of extracellular region and leukemia is found in [82]. Furthermore, PHKA1 is connected with the Leukemia-related Gene-Ontology term viz., GO:MF of calmodulin-dependent protein kinase activity (GO:0004683) [71] p-value = 2.11E-02).
Table 7.
The disease-associative GO terms of the participating oncogenes of the top twenty integrated markers, the p-values of the GO terms, and the supportive literatures regarding the association between the GO terms and the disease for the AML gene expression and methylation datasets.
| Oncogene | GO-terms | p-value | Supportive literature |
|---|---|---|---|
| BST2 | GO:BP of regulation of cytokine production (GO:0001817) | 1.96E-08 | [79] |
| GO:BP of regulation of intracellular transport (GO:0032386) | 1.30E-05 | [80] | |
| GO:CC of Golgi apparatus (GO:0005794) | 4.30E-05 | [71] | |
| CHRDL1 | GO:BP of BMP signaling pathway (GO:0030509) | 4.59E-06 | [81] |
| GO:CC of extracellular region (GO:0005576) | 3.91E-07 | [82] | |
| IL7 | GO:CC of extracellular space (GO:0005615) | 1.49E-33 | [83] |
| GO:CC of extracellular region (GO:0005576) | 3.91E-07 | [82] | |
| GO:MF of cytokine activity (GO:0005125) | 1.51E-10 | [84] | |
| PHKA1 | GO:MF of calmodulin-dependent protein kinase activity (GO:0004683) | 0.021081 | [71] |
| PRSS2 | GO:CC of extracellular region (GO:0005576) | 3.91E-07 | [82] |
| GO:CC of extracellular space (GO:0005615 | 1.49E-33 | [83] | |
| GO:CC of extracellular matrix (GO:0031012) | 6.24E-23 | [82] | |
| PTK2 | GO:BP of positive regulation of MAPK cascade (GO:0043410) | 6.39E-09 | [85] |
| GO:CC of adherens junction (GO:0005912) | 8.31E-09 | [71] | |
| GO:CC of focal adhesion (GO:0005925) | 7.31E-06 | [71] | |
| GO:MF of protein tyrosine kinase activity (GO:0004713) | 4.91E-05 | [86] | |
| SRPX2 | GO:CC of extracellular space (GO:0005615) | 1.49E-33 | [83] |
Among the top twenty integrated markers, we recognize six of them as “CE” markers, and twelve of them as “P” markers, whereas remaining two of them are novel (i.e., “NV”) markers. These six “CE” markers are {PHKA1↑∪TRIM36↓}, {PRSS2↑∪PTK2-}, {BST2-∪IL7↑ ∪PTK2-}, {BST2-∪PHKA1↑ ∪TRIM36↓}, {BST2-, IL7↑, TRIM36↓}, and {SRPX2↑, TRIM36↓}. Here, the related (most strongest or highest confident) rule of the {BST2-∪IL7↑∪PTK2-} marker is {BST2-, IL7↑⇒ PTK2-} which states that if the gene BST 2 is hypo-methylated and IL7 is up-regulated simultaneously in the underlaying dataset, then there it is likely that the gene PTK2 becomes hypo-methylated. Thus, the related marker signifies that these three genes with their specified status (i.e., BST2 in hypo-methylated status, IL7 in upregulated status, and PTK2 in hypo-methylated status) are jointly responsible for the occurrence of leukemia.
The marker {BST2- ∪IL7↑ ∪PTK2-} is a “CE” marker since the involvement of both the participating genes BST2, IL7 and PTK2 in leukemia is found through either literature search or pathway enrichment analysis or both. The direct involvement of BST2 in the Leukemia is highlighted in [55–59]. In addition, BST2 is also linked with some leukemia-related GO terms such as GO:BP of regulation of cytokine production (GO:0001817) (p-value = 1.96E-08) [79], GO:BP of regulation of intracellular transport (GO:0032386) (p-value = 1.30E-05) [80], and GO:CC of Golgi apparatus (GO:0005794) (p-value = 4.30E-05) [71]. The association of IL7 gene and leukemia is mentioned in [61] and [62]. Furthermore, IL7 gene is associated with leukemia related KEGG pathways such as (hsa04630) Jak-STAT signaling pathway (p-value = 4.50E-05) [71,72], (hsa04060) cytokine-cytokine receptor interaction pathway (p-value = 1.76E-14) [73], (hsa04151) PI3KAkt signaling pathway (p-value = 1.29E-13) [74–76], and the leukemia disease related GO terms like GO:CCs of extracellular space (GO:0005615) (p-value = 1.49E-33) [83], extracellular region (GO:0005576) (p-value = 3.91E-07) [82], and GO:MF of cytokine activity (GO:0005125) (p-value = 1.51E-10) [84]. Besides that, the PTK2 gene is connected with leukemia as mentioned in [3,68,69]. PTK2 is also associated with some disease-related KEGG pathways viz., (hsa04151) PI3K-Akt signaling pathway (p-value = 1.29E-13) [74–76], (hsa04020) calcium signaling pathway (p-value = 1.38E-13) [77], (hsa04810) regulation of actin cytoskeleton (p-value = 5.79E-12) [71], (hsa04510) focal adhesion (p-value = 3.81E11) [71] and some disease-related Gene-Ontology terms like GO:BP of positive regulation of MAPK cascade (GO:0043410) (p-value = 6.39E-09) [85], GO:CC of adherens junction (GO:0005912) (p-value = 8.31E-09) [71], GO:CC of focal adhesion (GO:0005925) (p-value = 7.31E-06) [71], and GO:MF of protein tyrosine kinase activity (GO: 0004713) (p-value = 4.91E-05) [86].
The twelve “P” markers are {KRT17↓∪PHKA1↑∪ TRIM36↓}, {ARHGAP8↑ ∪KRT17↓}, {KRT17↓ ∪ LOC100133669↑∪TRIM36↓}, {MYT1↑∪TRIM36↓∪ KRT17↓}, {BST2- ∪KRT17↓ ∪LIMCH1- ∪PTK2-}, {IL7↑ ∪PTK2- ∪DYDC1↓}, {CHRDL1- ∪NEIL2-}, {ARHGAP8↑ ∪DYDC1↓}, {IL7↑ ∪KRT17↓ ∪ TRIM36↓}, {BST2-∪CHRDL1-∪DYDC1↓∪AP1S1-}, {BST2- ∪DYDC1↓ ∪NEIL2- ∪AP1S1-}, and {LOC100133669↑∪PTK2-}. For example, {KRT17↓∪ PHKA1↑∪TRIM36↓} is a “P” marker since the association between the two participating genes such as PHKA1 and TRIM36 and the leukemia are known through either literature search or pathway and GO analyses or both, but the connection between KRT17 gene and the leukemia disease is unknown. In details, PHKA1 gene follows a leukemia related KEGG pathway (hsa04020) calcium signaling pathway (p-value = 1.38E-13) [77] and a leukemia related GO-term GO:MF of calmodulin-dependent protein kinase activity (GO:0004683) (p-value = 0.021081) [71]. According to Ref. [70], TRIM36 gene has a direct involvement with the leukemia.
On the other hand, the remaining two novel (“NV”) markers are {ABCB11↑∪KRT17↓}, and {AP1S1-∪ KRT17↓ ∪NEIL2- ∪DYDC1↓}. In this case, {ABCB11↑∪KRT17↓} defines that it is likely that the joint event of the two genes with their specified status (i.e., ABCB11 in up-regulation and KRT17 in down-regulation) promotes leukemia. {AP1S1-∪KRT17↓∪ NEIL2-∪DYDC1↓} reflects a combined situation of the four genes with their specific status (i.e., AP1S1 in hypomethylation, KRT17 in down-regulation, NEIL2 in hypo-methylation and DYDC1 in down-regulation) promotes Leukemia. It is noted that, {ABCB11↑∪ KRT17↓}is a “NV” marker due to the unavailability of the associative information between each of the participating genes (i.e., ABCB11 and KRT17) and the Leukemia. Due to the similar reason, we mark {AP1S1- ↓KRT17↓∪NEIL2-∪DYDC1↓} marker as “NV” marker. Moreover, these two “NV” integrated markers might be highly valuable resources for the diagnosis of AML.
In our proposed method, we divide expression/methylation dataset into normally distributed and non-distributed datasets. Then we run parametric test (Welch t-test) on normally distributed data, and non-parametric test (Shrink t-test) on non-normally distributed data. For AML dataset, we obtain only one oncogene (i.e., PROS1) that has inverse relationship between the differential expression pattern and differential methylation pattern as final result. We have obtained several literature evidences [87,88] suggesting that there is association between PROS1 and the leukemia. In addition, we obtain several leukemia-related KEGG pathways (such as hsa04610: complement and coagulation cascades [89] having p-value = 5.68E-05) as well as Gene-Ontology-terms (viz., GO:BPs of negative regulation of wound healing (GO:0061045) [90,91] having p-value = 2.19E-09, regulation of response to wounding (GO:1903034) [90] having p-value = 2.78E-09, negative regulation of blood coagulation (GO:0030195) [92] (p-value = 2.21E-08); GO:CCs of extracellular space (GO:0005615) [83] having p-value = 1.49E-33, extracellular region (GO:0005576) [93] having p-value = 3.91E-07, etc.) that are attached with PROS1. For comparative study, we also apply Shrink t-test (non-parametric test) without diving the leukemia dataset through data-distribution, and finally obtain only one gene (NPDC1) that has inverse relationship between the differential expression pattern and differential methylation pattern. In that case, we have found no disease-related significant KEGG pathway or Gene-Ontology associated with NPDC1 gene. In addition, we have not recognized any direct significant relationship between the gene and the disease in literatures. Therefore, the performance of our proposed method through dividing expression/methylation dataset into normally distributed and non-distributed datasets is better than the similar result without dividing the data.
For PC dataset, we carry out intersection between the two genesets produced in NDE and NDM, and find a total of 3,912 (= 9, 016 ∩ 7, 907) genes that refer to the normally distributed genes having both the expression and methylation values. Similarly, the intersection operation is performed between the two genesets obtained in NNDE and NNDM, and we obtain a total of 5,298 (= 9, 293∩ 10, 402) genes which are non-normally distributed genes consisting of both the values. After that, we only consider these two categories of resultant intersected genes. Both of the NDE and NDM sub-datasets now consist of 3,912 matched genes, whereas both of the NNDE and NNDM sub-datasets have 5,298 matched genes. The mRMR feature selection technique is then applied on these four sub-datasets separately for identifying top 100 genes. We also perform intersection on the resultant top 100 genes from NDE and NDM sub-datasets, and obtain five common genes between these two. Similarly, we identify only five matched genes between the resultant top 100 genes from NNDE and NNDM sub-datasets.
As mentioned earlier, Welch t-test (parametric test), and FC are combinely applied to the top 100 genes from NDE and NDM sub-datasets at p-value cutoff 0.05, upper fold change cutoff 1.50 and lower fold change cutoff 0.67 in global. As a result, a total 83 of differentially expressed genes are detected of which 24 are up-regulated and 59 are down-regulated in case of NDE sub-dataset, whereas a total of 88 of differentially methylated genes are detected of which 47 are hyper-methylated and 41 are hypomethylated in case of NDM sub-dataset. Thereafter, we get four common genes (i.e., EFCAB4A, PIAS3, SOD3 and NPR2) among the statistically significant genes from 100 top genes (features) of NDE and NDM. Similarly, Shrink t-test (non-parametric test), and FC are jointly utilized to the top 100 genes from NNDE and NNDM subdatasets at the same thresholds. For NNDE sub-dataset, we obtain 85 differentially expressed genes. Among these, 21 are up-regulated, and remaining 64 are downregulated. For NNDM sub-dataset, we identify 59 differentially methylated genes of which 45 are hypermethylated, and remaining 14 are hypo-methylated. Here, we identify three matched genes (i.e., UBIAD1, C4orf31 and APBA2) among the statistically significant genes from 100 top genes (features) of NNDE and NNDM. Overall, we obtain seven (= 4 + 3) intersected genes of which the distribution patterns of their expression and methylation data are same. Among these seven, we recognize five genes (i.e., PIAS3, NPR2, UBIAD1, C4orf31 and APBA2) that have inverse relationship between their expression and methylation patterns. For example, PIAS3 is down-regulated (having p-value = 1.53E-03 and FC = 0.62) and hyper-methylated (having p-value = 2.07E-04 and FC = 1.68). NPR2 is also downregulated (having p-value = 7.53E-06 and FC = 0.50) and hyper-methylated (having p-value = 2.38E-04 and FC = 1.59). PIAS3 and NPR2 are both normally distributed. But, remaining three (i.e., UBIAD1, C4orf31 and APBA2) among the five such genes are non-normally distributed. UBIAD1 is here up-regulated (having p-value = 8.88E-05 and FC = 2.80) and hypo-methylated (having p-value = 6.14E-05 and FC = 0.31). C4orf31 is downregulated (having p-value = 1.50E06 and FC = 0.20) and hyper-methylated (having p-value = 1.47E-07 and FC = 1.74). APBA2 is also down-regulated (having p-value = 1.89E-05 and FC = 0.38) and hyper-methylated (having p-value = 6.93E-07 and FC = 1.54).
After identifying the aforementioned five intersected genes that have inverse relationship between their expression and methylation patterns, we run RANWAR method to extract the relationships among these genes through providing user-defined wcs threshold 0.10 and user-defined wcc threshold 0.50. As there are very few number of genes for rule mining, very less number of rules are generated in this case. The corresponding redundant markers are then discarded from the list. Here we obtain only four non-redundant (condensed) integrated markers. Among these four markers, three are “P” markers, whereas remaining one is “NV” marker.
The respective integrated markers (i.e., genesets) from which the rules are identified, are also highlighted. The resultant rules along with their corresponding markers (genesets) are also ranked on the basis of their weighted confidence values in descending order. The rule related to topmost marker, {NPR2‡, UBIAD1¶⇒C4orf31‡} has wcc 87.5% and wcs 16%, where ¶ signifies upregulated as well as hypo-methylated, and ‡ stands for downregulated as well as hyper-methylated. The first participating gene NPR2 of the marker has an association with the disease-associated KEGG pathway (i.e., hsa04270: vascular smooth muscle contraction having p-value 3.03E-02) as mentioned in [94]. The second participating gene UBIAD1 of the marker is also attached with the same disease-associated KEGG pathway. In addition, the relationship between the UBIAD1 and prostate carcinoma is directly found in [95]. But, the third gene of the marker, C4orf31 has no relation with the disease. Thus, the marker is of “P” category. Similarly, {PIAS3‡∪C4orf31‡} and {NPR2‡∪APBA2‡} are of “P” category. Interestingly, {UBIAD1¶∪APBA2‡∪C4orf31‡} can be treated as a “NV” marker. It is noted that although it basically fallen into the category of “P” marker, it can be treated as “NV” marker since the two (i.e., APBA2 and C4orf31) among the three participating genes of this marker are novel here. The wcc and wcs values are 63.19% and 17.14%, respectively. The details of these markers are depicted in Table 8 and Table 9. The disease-associative KEGG pathways and GO terms, and direct literature evidences are represented in Table 10 and Table 11, respectively.
Table 8.
The rank-wise integrated markers with respective rules for PC gene expression and methylation datasets.
| ID | Oncogenic rule | Respective integrated markers (genesets) | Wcc (%) | Wcs (%) | Status of integrated markers |
|---|---|---|---|---|---|
| 1 | {NPR2‡, UBIAD1¶⇒C4orf31‡} | { NPR2‡∪UBIAD1¶∪C4orf31‡} | 87.5 | 16 | P |
| 2 | {UBIAD1¶, APBA2‡ ⇒ C4orf31‡} | {UBIAD1¶∪APBA2‡∪C4orf31‡} | 63.19 | 17.14 | NV * |
| 3 | {PIAS3‡ ⇒ C4orf31‡} | { PIAS3‡∪C4orf31‡} | 60 | 10.71 | P |
| 4 | {NPR2‡ ⇒ APBA2‡} | { NPR2‡∪APBA2‡} | 59.09 | 13.57 | P |
While “¶” stands for up-regulation as well as hypo-methylation, and “‡” refers to down-regulation as well as hyper-methylation.
Although it is a “P” marker, it can be treated as novel marker (NV) since maximum participating genes (such as APBA2 and C4orf31) belonging to this marker are still unknown/novel.
Table 9.
The participating genes of the top five rules, their data distribution and profile status, p-values and fold change values in expression/methylation dataset according to their status for PC gene expression and methylation datasets.
| ID | Integrated markers | Participating genes | Profile status in Exp & Meth | p-values of genes in Exp | FC of genes in Exp | p-values of genes in Meth | FC of genes in Meth |
|---|---|---|---|---|---|---|---|
| 1 | {NPR2‡, UBIAD1¶⇒ C4orf31‡} | NPR2‡ | NE & NM | 7.53E-06 | 0.50 | 2.38E-04 | 1.59 |
| UBIAD1¶ | NNE &NNM | 8.88E-05 | 2.80 | 6.14E-05 | 0.31 | ||
| C4orf31‡ | NNE &NNM | 1.50E-06 | 0.20 | 1.47E-07 | 1.74 | ||
| 2 | {UBIAD1¶, APBA2‡⇒ C4orf31‡} | UBIAD1¶ | NNE &NNM | 8.88E-05 | 2.80 | 6.14E-05 | 0.31 |
| APBA2‡ | NNE &NNM | 1.89E-05 | 0.38 | 6.93E-07 | 1.54 | ||
| C4orf31‡ | NNE &NNM | 1.50E-06 | 0.20 | 1.47E-07 | 1.74 | ||
| 3 | { PIAS3‡⇒ C4orf31‡} | PIAS3‡ | NE & NM | 1.53E-03 | 0.62 | 2.07E-04 | 1.68 |
| C4orf31‡ | NNE &NNM | 1.50E-06 | 0.20 | 1.47E-07 | 1.74 | ||
| 4 | { NPR2‡⇒ APBA2‡} | NPR2‡ | NE & NM | 7.53E-06 | 0.50 | 2.38E-04 | 1.59 |
| APBA2‡ | NNE &NNM | 1.89E-05 | 0.38 | 6.93E-07 | 1.54 |
Table 10.
The disease-associative KEGG pathways and GO terms of the participating genes of the top five integrated markers, the p-values of the KEGG pathways or GO-terms, and the supportive literatures regarding the association between the pathways or GO-terms and the disease for the PC gene expression and methylation datasets.
| Oncogene | Disease-associative KEGG pathways | p-value of pathways | Supportive literatures |
|---|---|---|---|
| UBIAD1 | KEGG pathway of (hsa04270) vascular smooth muscle contraction | 3.03E-02 | [94] |
| NPR2 | KEGG pathway of (hsa04270) vascular smooth muscle contraction | 3.03E-02 | [94] |
| PIAS3 KEGG pathway of (hsa04120) ubiquitin mediated proteolysis | 1.80E-02 | [96–98] | |
| GO-BP of protein sumoylation (GO:0016925) | 1.52E-02 | [99–101] | |
| GO-MF of small conjugating protein ligase activity (GO:0019787) | 1.75E-03 | [102] | |
| GO-MF of SUMO ligase activity (GO:0019789) | 1.54E-02 | [100] |
Table 11.
The direct literature evidences of the association between the disease and the participating oncogenes of the top five integrated markers for PC gene expression and methylation datasets.
CONCLUSION
In this manuscript, we have provided an association rule mining based study of extracting the integrated oncogenic markers through the mutual information-based statistically significant feature selection for AML as well as PC dataset both consisting of gene expression and methylation values. We have applied a normality test on the expression and the methylation dataset before utilizing any statistical hypothesis test in order to understand the distribution of the underlying data of the genes. It helps to improve the correctness of our framework and reduce the errors due to inappropriate use of statistical tests.
We highlight top twenty significant integrated markers for AML multi-domain dataset. Two of them are novel ({ABCB11↑ ∪KRT17↓}, and {AP1S1- ∪KRT17↓ ∪ NEIL2-∪DYDC1↓}). For PC dataset, the only novel marker is {UBIAD1¶APBA2‡∪C4orf31‡}. The major specialties of our framework are (i) analyzing every participating gene of each integrated marker through the proper data-distribution platform (i.e., either Gaussian/Normal distribution or Non-normal distribution) and appropriate statistical hypothesis test depending on the resultant data-distribution on the corresponding expression and methylation profiles, (ii) identifying cancer-related genes (of the markers) which have highest relevance and lowest redundancy simultaneously, (iii) evaluating the statistical significance of each gene through either concerning differential expression or differential methylation or both, (iv) recognizing the integrated markers on the basis of their rule-interestingness measures such as weighted condensed confidence (wcc) and weighted condensed support (wcs) measures.
Finally, the novel integrated markers will be useful for hypothesis generation and further investigation of their roles as biomarkers in AML as well as PC. Our approach can be applied to other cancer or other complex disease.
Acknowledgments
Z.Z. was partially supported by National Institutes of Health grant (No. R01LM012806). The funder had no role in the study design, data collection and analysis, decision to publish, or preparation of the manuscript.
Footnotes
AUTHOR’S CONTRIBUTIONS
S.M. has developed and implemented the proposed methodology, carried out experiments, written and revised the manuscript. Z.Z. participated in manuscript writing and revision.
COMPLIANCE WITH ETHICS GUIDELINES
The authors Saurav Mallik and Zhongming Zhao declare they have no conflict of interests.
This article does not contain any studies with human or animal subjects performed by any of the authors.
References
- 1.Strimbu K, Tavel JA. What are biomarkers? Curr Opin HIV AIDS. 2010;5:463–466. doi: 10.1097/COH.0b013e32833ed177. [DOI] [PMC free article] [PubMed] [Google Scholar]
- 2.Dessì N, Pascariello E, Pes B. A comparative analysis of biomarker selection techniques. BioMed Res Int. 2013;2013:387673. doi: 10.1155/2013/387673. [DOI] [PMC free article] [PubMed] [Google Scholar]
- 3.Maiorov EG, Keskin O, Ng OH, Ozbek U, Gursoy A. Identification of interconnected markers for T-cell acute lymphoblastic leukemia. Biomed Res Int. 2013;2013:210253. doi: 10.1155/2013/210253. [DOI] [PMC free article] [PubMed] [Google Scholar]
- 4.Renneville A, Roumier C, Biggio V, Nibourel O, Boissel N, Fenaux P, Preudhomme C. Cooperating gene mutations in acute myeloid leukemia: a review of the literature. Leukemia. 2008;22:915–931. doi: 10.1038/leu.2008.19. [DOI] [PubMed] [Google Scholar]
- 5.Opgen-Rhein R, Strimmer K. Accurate ranking of differentially expressed genes by a distribution-free shrinkage approach. Stat Appl Genet Mol Biol. 2007;6:e9. doi: 10.2202/1544-6115.1252. [DOI] [PubMed] [Google Scholar]
- 6.Ritchie ME, Phipson B, Wu D, Hu Y, Law CW, Shi W, Smyth GK. limma powers differential expression analyses for RNA-sequencing and microarray studies. Nucleic Acids Res. 2015;43:e47. doi: 10.1093/nar/gkv007. [DOI] [PMC free article] [PubMed] [Google Scholar]
- 7.Smyth GK. Linear models and empirical bayes methods for assessing differential expression in microarray experiments. Stat Appl Genet Mol Biol. 2004;3:1–25. doi: 10.2202/1544-6115.1027. [DOI] [PubMed] [Google Scholar]
- 8.He Z, Yu W. Stable feature selection for biomarker discovery. Comput Biol Chem. 2010;34:215–225. doi: 10.1016/j.compbiolchem.2010.07.002. [DOI] [PubMed] [Google Scholar]
- 9.Mallik S, Akashi H, Kundu S. Assembly constraints drive co-evolution among ribosomal constituents. Nucleic Acids Res. 2015;43:5352–5363. doi: 10.1093/nar/gkv448. [DOI] [PMC free article] [PubMed] [Google Scholar]
- 10.Mallik S, Kundu S. Co-evolutionary constraints of globular proteins correlate with their folding rates. FEBS Lett. 2015;589:2179–2185. doi: 10.1016/j.febslet.2015.06.032. [DOI] [PubMed] [Google Scholar]
- 11.Vickers AJ. Parametric versus non-parametric statistics in the analysis of randomized trials with non-normally distributed data. BMC Med Res Methodol. 2005;5:35. doi: 10.1186/1471-2288-5-35. [DOI] [PMC free article] [PubMed] [Google Scholar]
- 12.Hogg RV, Ledolter J. Engineering Statistics. New York: MacMillan Publishers Ltd; 1987. [Google Scholar]
- 13.Vapnik VN. The Nature of Statistical Learning Theory. 2. New York: Springer; 2000. [Google Scholar]
- 14.Ghasemi A, Zahediasl S. Normality tests for statistical analysis: a guide for non-statisticians. Int J Endocrinol Metab. 2012;10:486–489. doi: 10.5812/ijem.3505. [DOI] [PMC free article] [PubMed] [Google Scholar]
- 15.Bhattacharjee S, Renganaath K, Mehrotra R, Mehrotra S. Combinatorial control of gene expression. BioMed Res Int. 2013:407263. doi: 10.1155/2013/407263. [DOI] [PMC free article] [PubMed] [Google Scholar]
- 16.Wang Q, Jia P, Cheng F, Zhao Z. Heterogeneous DNA methylation contributes to tumorigenesis through inducing the loss of coexpression connectivity in colorectal cancer. Genes Chromosome Canc. 2015;54:110–121. doi: 10.1002/gcc.22224. [DOI] [PMC free article] [PubMed] [Google Scholar]
- 17.Mallik S, Mukhopadhyay A, Maulik U. Integrated statistical and rule-mining techniques for DNA methylation and gene expression data analysis. J Arti Int Soft Comp Res. 2013:3. [Google Scholar]
- 18.Mukhopadhyay A, Mandal M. Identifying non-redundant gene markers from microarray data: a multiobjective variable length PSO-based approach. IEEE/ACM Trans Comput Biol Bioinform. 2014;11:1170–1183. doi: 10.1109/TCBB.2014.2323065. [DOI] [PubMed] [Google Scholar]
- 19.Mallik S, Mukhopadhyay A, Maulik U, Bandyopadhyay S. Integrated Analysis of Gene Expression and Genome-wide DNA Methylation for Tumor Prediction: An Association Rule Mining-based Approach. 2013 IEEE Symposium on Computational Intelligence in Bioinformatics and Computational Biology; Singapore. 2013. pp. 120–127. [Google Scholar]
- 20.Liao C, Li S, Luo Z. Gene selection using Wilcoxon rank sum test and support vector machine for cancer classification. Lect Notes Comput Sci. 2007;4456:57–66. [Google Scholar]
- 21.Yu L, Liu H. Efficient feature selection via analysis of relevance and redundancy. J Mach Learn Res. 2004;5:1205–1224. [Google Scholar]
- 22.Jarque C, Bera A. A test for normality of observations and regression residuals. Int Stat Rev. 1987;55:163–172. [Google Scholar]
- 23.Bandyopadhyay S, Mallik S, Mukhopadhyay A. A survey and comparative study of statistical tests for identifying differential expression from microarray data. IEEE/ACM Trans Comput Biol Bioinform. 2013:14299619. doi: 10.1109/TCBB.2013.147. [DOI] [PubMed] [Google Scholar]
- 24.Peng H, Long F, Ding C. Feature selection based on mutual information: criteria of max-dependency, max-relevance, and min-redundancy. IEEE Trans Pattern Anal Mach Intell. 2005;27:1226–1238. doi: 10.1109/TPAMI.2005.159. [DOI] [PubMed] [Google Scholar]
- 25.Welch B. The significance of the difference between two means when the population variances are unequal. Biometrika. 1938;29:350–362. [Google Scholar]
- 26.Mallik S, Mukhopadhyay A, Maulik U. RANWAR: rank-based weighted association rule mining from gene expression and methylation data. IEEE Trans Nanobiosci. 2015;14:59–66. doi: 10.1109/TNB.2014.2359494. [DOI] [PubMed] [Google Scholar]
- 27.Cover TM, Thomas JA. Elements of information theory. New York: Wiley; 1991. [Google Scholar]
- 28.Battiti R. Using mutual information for selecting features in supervised neural net learning. IEEE Trans Neural Netw. 1994;5:537–550. doi: 10.1109/72.298224. [DOI] [PubMed] [Google Scholar]
- 29.Strehl A, Ghosh J. Cluster ensembles-a knowledge reuse framework for combining multiple partitions. J Mach Learn Res. 2002;3:583–617. [Google Scholar]
- 30.Agrawal R, Imielinski T, Swami A. Mining Association Rules between Sets of Items in large Databases. Proceedings of the 1993 ACM SIGMOD international conference on Management of data; New York: ACM SIGMOD; 1993. pp. 207–216. [Google Scholar]
- 31.Maulik U, Mallik S, Mukhopadhyay A, Bandyopadhyay S. Analyzing large gene expression and methylation data profiles using StatBicRM: statistical biclustering-based rule mining. PLoS One. 2015;10:e0119448. doi: 10.1371/journal.pone.0119448. [DOI] [PMC free article] [PubMed] [Google Scholar]
- 32.Pasquier N, Bastide Y, Taouil R, Lakhal L. Discovering Frequent Closed Itemsets for Association Rules. Proceedings of the 7th International Conference on Database Theory; London: Springer-Verlag; 1999. pp. 398–416. [Google Scholar]
- 33.Ruiz R, Riquelme JC, Aguilar-Ruiz JS. Incremental wrapper-based gene selection from microarray data for cancer classification. Pattern Recognit. 2006;39:2383–2392. [Google Scholar]
- 34.Xiong M, Fang X, Zhao J. Biomarker identification by feature wrappers. Genome Res. 2001;11:1878–1887. doi: 10.1101/gr.190001. [DOI] [PMC free article] [PubMed] [Google Scholar]
- 35.Alon U, Barkai N, Notterman DA, Gish K, Ybarra S, Mack D, Levine AJ. Broad patterns of gene expression revealed by clustering analysis of tumor and normal colon tissues probed by oligonucleotide arrays. Proc Natl Acad Sci USA. 1999;96:6745–6750. doi: 10.1073/pnas.96.12.6745. [DOI] [PMC free article] [PubMed] [Google Scholar]
- 36.Li J, Tang X, Zhao W, Huang J. A new framework for identifying differentially expressed genes. Pattern Recognit. 2007;40:3249–3262. [Google Scholar]
- 37.Glaab E, Bacardit J, Garibaldi JM, Krasnogor N. Using rule-based machine learning for candidate disease gene prioritization and sample classification of cancer gene expression data. PLoS One. 2012;7:e39932. doi: 10.1371/journal.pone.0039932. [DOI] [PMC free article] [PubMed] [Google Scholar]
- 38.Mallik S, Sen S, Maulik U. IDPT: Insights into potential intrinsically disordered proteins through transcriptomic analysis of genes for prostate carcinoma epigenetic data. Gene. 2016;586:87–96. doi: 10.1016/j.gene.2016.03.056. [DOI] [PubMed] [Google Scholar]
- 39.Wang Q, Jia P, Cuenco KT, Zeng Z, Feingold E, Marazita ML, Wang L, Zhao Z. Association signals unveiled by a comprehensive gene set enrichment analysis of dental caries genome-wide association studies. PLoS One. 2013;8:e72653. doi: 10.1371/journal.pone.0072653. [DOI] [PMC free article] [PubMed] [Google Scholar]
- 40.Huang HC, Zheng S, VanBuren V, Zhao Z. Discovering disease-specific biomarker genes for cancer diagnosis and prognosis. Technol Cancer Res Treat. 2010;9:219–229. doi: 10.1177/153303461000900301. [DOI] [PubMed] [Google Scholar]
- 41.Coburn LA, Gong X, Singh K, Asim M, Scull BP, Allaman MM, Williams CS, Rosen MJ, Washington MK, Barry DP, et al. L-arginine supplementation improves responses to injury and inflammation in dextran sulfate sodium colitis. PLoS One. 2012;7:e33546. doi: 10.1371/journal.pone.0033546. [DOI] [PMC free article] [PubMed] [Google Scholar]
- 42.Zheng S, Tansey WP, Hiebert SW, Zhao Z. Integrative network analysis identifies key genes and pathways in the progression of hepatitis C virus induced hepatocellular carcinoma. BMC Med Genomics. 2011;4:62. doi: 10.1186/1755-8794-4-62. [DOI] [PMC free article] [PubMed] [Google Scholar]
- 43.Guo X, Xu Y, Zhao Z. In-depth genomic data analyses revealed complex transcriptional and epigenetic dysregulations of BRAFV600E in melanoma. Mol Cancer. 2015;14:60. doi: 10.1186/s12943-015-0328-y. [DOI] [PMC free article] [PubMed] [Google Scholar]
- 44.Mallik S, Maulik U. MiRNA-TF-gene network analysis through ranking of biomolecules for multi-informative uterine leiomyoma dataset. J Biomed Inform. 2015;57:308–319. doi: 10.1016/j.jbi.2015.08.014. [DOI] [PubMed] [Google Scholar]
- 45.Furney SJ, Kronenberg D, Simmons A, Güntert A, Dobson RJ, Proitsi P, Wahlund LO, Kloszewska I, Mecocci P, Soininen H, et al. Combinatorial markers of mild cognitive impairment conversion to Alzheimer’s disease–cytokines and MRI measures together predict disease progression. J Alzheimers Dis. 2011;26:395–405. doi: 10.3233/JAD-2011-0044. [DOI] [PubMed] [Google Scholar]
- 46.Kim HJ, Choi EJ, Sohn HJ, Park SH, Min WS, Kim TG. Combinatorial molecular marker assays of WT1, survivin, and TERT at initial diagnosis of adult acute myeloid leukemia. Eur J Haematol. 2013;91:411–422. doi: 10.1111/ejh.12167. [DOI] [PubMed] [Google Scholar]
- 47.Loulier K, Barry R, Mahou P, Le Franc Y, Supatto W, Matho KS, Ieng S, Fouquet S, Dupin E, Benosman R, et al. Multiplex cell and lineage tracking with combinatorial labels. Neuron. 2014;81:505–520. doi: 10.1016/j.neuron.2013.12.016. [DOI] [PubMed] [Google Scholar]
- 48.Shi ZQ, Song DF, Li RQ, Yang H, Qi LW, Xin GZ, Wang DQ, Song HP, Chen J, Hao H, et al. Identification of effective combinatorial markers for quality standardization of herbal medicines. J Chromatogr A. 2014;1345:78–85. doi: 10.1016/j.chroma.2014.04.015. [DOI] [PubMed] [Google Scholar]
- 49.Rakha EA, Reis-Filho JS, Ellis IO. Combinatorial biomarker expression in breast cancer. Breast Cancer Res Treat. 2010;120:293–308. doi: 10.1007/s10549-010-0746-x. [DOI] [PubMed] [Google Scholar]
- 50.Bandyopadhyay S, Mallik S. Integrating multiple data sources for combinatorial marker discovery: a study in tumorigenesis. IEEE/ACM trans Comput Biol Bioinform. 2016 doi: 10.1109/TCBB.2016.2636207. [DOI] [PubMed] [Google Scholar]
- 51.Kuleshov MV, Jones MR, Rouillard AD, Fernandez NF, Duan Q, Wang Z, Koplev S, Jenkins SL, Jagodnik KM, Lachmann A, et al. Enrichr: a comprehensive gene set enrichment analysis web server 2016 update. Nucleic Acids Res. 2016;44:W90–W97. doi: 10.1093/nar/gkw377. [DOI] [PMC free article] [PubMed] [Google Scholar]
- 52.https://genome-cancer.ucsc.edu/proj/site/hgHeatmap/?dataset-Search=TCGA
- 53.Paziewska A, Dabrowska M, Goryca K, Antoniewicz A, Dobruch J, Mikula M, Jarosz D, Zapala L, Borowka A, Ostrowski J. DNA methylation status is more reliable than gene expression at detecting cancer in prostate biopsy. Br J Cancer. 2014;111:781–789. doi: 10.1038/bjc.2014.337. [DOI] [PMC free article] [PubMed] [Google Scholar]
- 54.Rithidech KN, Tungjai M, Jangiam W, Honikel L, Gordon C, Lai X, Witzmann F. Proteomic profiling of hematopoietic stem/progenitor cells after a whole body exposure of CBA/CaJ mice to titanium (48Ti) ions. Proteomes. 2015;3:132–159. doi: 10.3390/proteomes3030132. [DOI] [PMC free article] [PubMed] [Google Scholar]
- 55.Gu J, Zhang QH, Huang QH, Ren SX, Wu XY, Ye M, Huang CH, Fu G, Zhou J, Niu C, et al. Gene expression in CD34(+) cells from normal bone marrow and leukemic origins. Hematol J. 2000;1:206–217. doi: 10.1038/sj.thj.6200020. [DOI] [PubMed] [Google Scholar]
- 56.Lau CM, Nish SA, Yogev N, Waisman A, Reiner SL, Reizis B. Leukemia-associated activating mutation of Flt3 expands dendritic cells and alters T cell responses. J Exp Med. 2016;213:415–431. doi: 10.1084/jem.20150642. [DOI] [PMC free article] [PubMed] [Google Scholar]
- 57.Khan I, Malinge S, Crispino J. Myeloid leukemia in Down syndrome. Crit Rev Oncog. 2011;16:25–36. doi: 10.1615/critrevoncog.v16.i1-2.40. [DOI] [PMC free article] [PubMed] [Google Scholar]
- 58.Morgan GJ, Walker BA, Davies FE. The genetic architecture of multiple myeloma. Nat Rev Cancer. 2012;12:335–348. doi: 10.1038/nrc3257. [DOI] [PubMed] [Google Scholar]
- 59.Ge Y, Dombkowski AA, LaFiura KM, Tatman D, Yedidi RS, Stout ML, Buck SA, Massey G, Becton DL, Weinstein HJ, et al. Differential gene expression, GATA1 target genes, and the chemotherapy sensitivity of Down syndrome megakaryocytic leukemia. Blood. 2006;107:1570–1581. doi: 10.1182/blood-2005-06-2219. [DOI] [PMC free article] [PubMed] [Google Scholar]
- 60.http://www.bloodjournal.org/content/bloodjournal/suppl/2014/10/20/blood-2014-07-591529.DC1/blood-2014-07-591529-1.pdf?sso-checked=true
- 61.Bello-Fernández C, Stasakova J, Renner A, Carballido-Perrig N, Koening M, Waclavicek M, Madjic O, Oehler L, Haas O, Carballido JM, et al. Retrovirus-mediated IL-7 expression in leukemic dendritic cells generated from primary acute myelogenous leukemias enhances their functional properties. Blood. 2003;101:2184–2190. doi: 10.1182/blood-2002-02-0378. [DOI] [PubMed] [Google Scholar]
- 62.Zarogoulidis P, Lampaki S, Yarmus L, Kioumis I, Pitsiou G, Katsikogiannis N, Hohenforst-Schmidt W, Li Q, Huang H, Sakkas A, et al. Interleukin-7 and interleukin-15 for cancer. J Cancer. 2014;5:765–773. doi: 10.7150/jca.10471. [DOI] [PMC free article] [PubMed] [Google Scholar]
- 63.Brenner AK, Reikvam H, Lavecchia A, Bruserud Ø. Therapeutic targeting the cell division cycle 25 (CDC25) phosphatases in human acute myeloid leukemia–the possibility to target several kinases through inhibition of the various CDC25 isoforms. Molecules. 2014;19:18414–18447. doi: 10.3390/molecules191118414. [DOI] [PMC free article] [PubMed] [Google Scholar]
- 64.Tsai HC, Li H, Van Neste L, Cai Y, Robert C, Rassool FV, Shin JJ, Harbom KM, Beaty R, Pappou E, et al. Transient low doses of DNA-demethylating agents exert durable antitumor effects on hematological and epithelial tumor cells. Cancer Cell. 2012;21:430–446. doi: 10.1016/j.ccr.2011.12.029. [DOI] [PMC free article] [PubMed] [Google Scholar]
- 65.Palande KK, Beekman R, van der Meeren LE, Beverloo HB, Valk PJM, Touw IP. The antioxidant protein peroxiredoxin 4 is epigenetically down regulated in acute promyelocytic leukemia. PLoS One. 2011;6:e16340. doi: 10.1371/journal.pone.0016340. [DOI] [PMC free article] [PubMed] [Google Scholar]
- 66.Chen S, Schneider B, Nagel S, Geffers R, Kaufmann M, Quentmeier H, Drexler HG, MacLeod RA. Spliceosomal targeting in acute myeloid leukemia cells with ETV6-NTRK3 fusion. Blood. 2009;114:5042. [Google Scholar]
- 67.Mallik S, Bhadra T, Maulik U. Identifying epigenetic biomarkers using maximal relevance and minimal redundancy based feature selection for multi-omics data. IEEE Trans Nanobioscience. 2017;16:3–10. doi: 10.1109/TNB.2017.2650217. [DOI] [PubMed] [Google Scholar]
- 68.http://atlasgeneticsoncology.org/Genes/PTK2ID41898ch8q24.html
- 69.Testa U, Riccioni R. Deregulation of apoptosis in acute myeloid leukemia. Haematologica. 2007;92:81–94. doi: 10.3324/haematol.10279. [DOI] [PubMed] [Google Scholar]
- 70.Cellai C, Laurenzana A, Bianchi E, Sdelci S, Manfredini R, Vannucchi AM, Caporale R, Balliu M, Mannelli F, Ferrari S, et al. Mechanistic insight into WEB-2170-induced apoptosis in human acute myelogenous leukemia cells: the crucial role of PTEN. Exp Hematol. 2009;37:1176–1185. doi: 10.1016/j.exphem.2009.07.002. [DOI] [PubMed] [Google Scholar]
- 71.Majeti R, Becker MW, Tian Q, Lee TL, Yan X, Liu R, Chiang JH, Hood L, Clarke MF, Weissman IL. Dysregulated gene expression networks in human acute myelogenous leukemia stem cells. Proc Natl Acad Sci USA. 2009;106:3396–3401. doi: 10.1073/pnas.0900089106. [DOI] [PMC free article] [PubMed] [Google Scholar]
- 72.Jatiani SS, Baker SJ, Silverman LR, Reddy EP. Jak/STAT pathways in cytokine signaling and myeloproliferative disorders: approaches for targeted therapies. Genes Cancer. 2010;1:979–993. doi: 10.1177/1947601910397187. [DOI] [PMC free article] [PubMed] [Google Scholar]
- 73.Eden CO, Edwards VDK, Eide CA, Traer E, Tyner JW, McWeeney SK, Agarwal A. Cytokine-mediated inammatory pathways promote clonal evolution and disease progression in acute myeloid leukemia. Blood. 2016;128:1688. [Google Scholar]
- 74.http://www.kegg.jp/kegg-bin/search_pathway_text?map=map&keyword=Acute+Myeloid+Leukemia&mode=1&viewImage=true
- 75.Yuan X, Chen J, Lin Y, Li Y, Xu L, Chen L, Hua H, Shen B. Network biomarkers constructed from gene expression and protein-protein interaction data for accurate prediction of leukemia. J Cancer. 2017;8:278–286. doi: 10.7150/jca.17302. [DOI] [PMC free article] [PubMed] [Google Scholar]
- 76.Park S, Chapuis N, Tamburini J, Bardet V, Cornillet-Lefebvre P, Willems L, Green A, Mayeux P, Lacombe C, Bouscary D. Role of the PI3K/AKT and mTOR signaling pathways in acute myeloid leukemia. Haematologica. 2010;95:819–828. doi: 10.3324/haematol.2009.013797. [DOI] [PMC free article] [PubMed] [Google Scholar]
- 77.Koski GK, Schwartz GN, Weng DE, Czerniecki BJ, Carter C, Gress RE, Cohen PA. Calcium mobilization in human myeloid cells results in acquisition of individual dendritic cell-like characteristics through discrete signaling pathways. J Immunol. 1999;163:82–92. [PubMed] [Google Scholar]
- 78.http://www.genome.jp/dbget-bin/www_bget?ds:H00003
- 79.https://digital.lib.washington.edu/researchworks/bitstream/handle/1773/34072/Zhang_washington_0250E_15031.pdf?sequence=1
- 80.Caldarelli A, Müller JP, Paskowski-Rogacz M, Herrmann K, Bauer R, Koch S, Heninger AK, Krastev D, Ding L, Kasper S, et al. A genome-wide RNAi screen identifies proteins modulating aberrant FLT3-ITD signaling. Leukemia. 2013;27:2301–2310. doi: 10.1038/leu.2013.83. [DOI] [PMC free article] [PubMed] [Google Scholar]
- 81.Crispino JD, Le Beau MM. BMP meets AML: induction of BMP signaling by a novel fusion gene promotes pediatric acute leukemia. Cancer Cell. 2012;22:567–568. doi: 10.1016/j.ccr.2012.10.008. [DOI] [PMC free article] [PubMed] [Google Scholar]
- 82.Bonardi F, Fusetti F, Deelen P, van Gosliga D, Vellenga E, Schuringa JJ. A proteomics and transcriptomics approach to identify leukemic stem cell (LSC) markers. Mol Cell Proteomics. 2013;12:626–637. doi: 10.1074/mcp.M112.021931. [DOI] [PMC free article] [PubMed] [Google Scholar]
- 83.Chigaev A. Does aberrant membrane transport contribute to poor outcome in adult acute myeloid leukemia? Front Pharmacol. 2015;6:134. doi: 10.3389/fphar.2015.00134. [DOI] [PMC free article] [PubMed] [Google Scholar]
- 84.Badie C, Blachowicz A, Barjaktarovic Z, Finnon R, Michaux A, Sarioglu H, Brown N, Manning G, Abderrafi Benotmane M, Tapio S, et al. Transcriptomic and proteomic analysis of mouse radiation-induced acute myeloid leukaemia (AML) Oncotarget. 2016;7:40461–40480. doi: 10.18632/oncotarget.9626. [DOI] [PMC free article] [PubMed] [Google Scholar]
- 85.Teo T, Lam F, Yu M, Yang Y, Basnet SKC, Albrecht H, Sykes MJ, Wang S. Pharmacologic inhibition of MNKs in acute myeloid leukemia. Mol Pharmacol. 2015;88:380–389. doi: 10.1124/mol.115.098012. [DOI] [PubMed] [Google Scholar]
- 86.Andersson A, Edén P, Lindgren D, Nilsson J, Lassen C, Heldrup J, Fontes M, Borg A, Mitelman F, Johansson B, et al. Gene expression profiling of leukemic cell lines reveals conserved molecular signatures among subtypes with specific genetic aberrations. Leukemia. 2005;19:1042–1050. doi: 10.1038/sj.leu.2403749. [DOI] [PubMed] [Google Scholar]
- 87.Suleiman L, Négrier C, Boukerche H. Protein S: A multifunctional anticoagulant vitamin K-dependent protein at the crossroads of coagulation, inflammation, angiogenesis, and cancer. Crit Rev Oncol Hematol. 2013;88:637–654. doi: 10.1016/j.critrevonc.2013.07.004. [DOI] [PubMed] [Google Scholar]
- 88.http://www.haematologica.org/content/haematol/88/4/363.1.full.pdf
- 89.Krupp M, Maass T, Marquardt JU, Staib F, Bauer T, König R, Biesterfeld S, Galle PR, Tresch A, Teufel A. The functional cancer map: a systems-level synopsis of genetic deregulation in cancer. BMC Med Genomics. 2011;4:53. doi: 10.1186/1755-8794-4-53. [DOI] [PMC free article] [PubMed] [Google Scholar]
- 90.Sun Y, Boyd K, Xu W, Ma J, Jackson CW, Fu A, Shillingford JM, Robinson GW, Hennighausen L, Hitzler JK, et al. Acute myeloid leukemia-associated Mkl1 (Mrtf-a) is a key regulator of mammary gland function. Mol Cell Biol. 2006;26:5809–5826. doi: 10.1128/MCB.00024-06. [DOI] [PMC free article] [PubMed] [Google Scholar]
- 91.Roney KE, O’Connor BP, Wen H, Holl EK, Guthrie EH, Davis BK, Jones SW, Jha S, Sharek L, Garcia-Mata R, et al. Plexin-B2 negatively regulates macrophage motility, Rac, and Cdc42 activation. PLoS One. 2011;6:e24795. doi: 10.1371/journal.pone.0024795. [DOI] [PMC free article] [PubMed] [Google Scholar]
- 92.Rossetti S, Hoogeveen AT, Liang P, Stanciu C, van der Spek P, Sacchi N. A distinct epigenetic signature at targets of a leukemia protein. BMC Genomics. 2007;8:38. doi: 10.1186/1471-2164-8-38. [DOI] [PMC free article] [PubMed] [Google Scholar]
- 93.Foroushani A, Agrahari R, Docking R, Chang L, Duns G, Hudoba M, Karsan A, Zare H. Large-scale gene network analysis reveals the significance of extracellular matrix pathway and homeobox genes in acute myeloid leukemia: an introduction to the Pigengene package and its applications. BMC Med Genomics. 2017;10:16. doi: 10.1186/s12920-017-0253-6. [DOI] [PMC free article] [PubMed] [Google Scholar]
- 94.Barfeld SJ, East P, Zuber V, Mills IG. Metaanalysis of prostate cancer gene expression data identifies a novel discriminatory signature enriched for glycosylating enzymes. BMC Med Genomics. 2014;7:513. doi: 10.1186/s12920-014-0074-9. [DOI] [PMC free article] [PubMed] [Google Scholar]
- 95.Fredericks WJ, Sepulveda J, Lal P, Tomaszewski JE, Lin MF, McGarvey T, Rauscher FJ, 3rd, Malkowicz SB. The tumor suppressor TERE1 (UBIAD1) prenyltransferase regulates the elevated cholesterol phenotype in castration resistant prostate cancer by controlling a program of ligand dependent SXR target genes. Oncotarget. 2013;4:1075–1092. doi: 10.18632/oncotarget.1103. [DOI] [PMC free article] [PubMed] [Google Scholar]
- 96.Shil S, Joshi RS, Joshi CG, Patel AK, Shah RK, Patel N, Jakhesara SJ, Kundu S, Reddy B, Koringa PG, et al. Transcriptomic comparison of primary bovine horn core carcinoma culture and parental tissue at early stage. Vet World. 2017;10:38–55. doi: 10.14202/vetworld.2017.38-55. [DOI] [PMC free article] [PubMed] [Google Scholar]
- 97.Lhakhang TW, Chaudhry MA. Interactome of radiation-induced microRNA-predicted target genes. Comp Funct Genomics. 2012;2012:569731. doi: 10.1155/2012/569731. [DOI] [PMC free article] [PubMed] [Google Scholar]
- 98.Jung CJ, Iyengar S, Blahnik KR, Jiang JX, Tahimic C, Torok NJ, de vere White RW, Farnham PJ, Zern M. Human ESC self-renewal promoting microRNAs induce epithelial-mesenchymal transition in hepatocytes by controlling the PTEN and TGFβ tumor suppressor signaling pathways. Mol Cancer Res. 2012;10:979–991. doi: 10.1158/1541-7786.MCR-11-0421. [DOI] [PMC free article] [PubMed] [Google Scholar]
- 99.Chen Z, Lu W. Roles of ubiquitination and SUMOylation on prostate cancer: mechanisms and clinical implications. Int J Mol Sci. 2015;16:4560–4580. doi: 10.3390/ijms16034560. [DOI] [PMC free article] [PubMed] [Google Scholar]
- 100.Xu HD, Shi SP, Chen X, Qiu JD. Systematic analysis of the genetic variability that impacts SUMO conjugation and their involvement in human diseases. Sci Rep. 2015;5:10900. doi: 10.1038/srep10900. [DOI] [PMC free article] [PubMed] [Google Scholar]
- 101.Vlachostergios PJ, Papandreou CN. The Role of the Small Ubiquitin-Related Modifier (SUMO) Pathway in Prostate Cancer. Biomolecules. 2012;2:240–255. doi: 10.3390/biom2020240. [DOI] [PMC free article] [PubMed] [Google Scholar]
- 102.Young MD, Wakefield MJ, Smyth GK, Oshlack A. Gene ontology analysis for RNA-seq: accounting for selection bias. Genome Biol. 2010;11:R14. doi: 10.1186/gb-2010-11-2-r14. [DOI] [PMC free article] [PubMed] [Google Scholar]
- 103.Junicho A, Matsuda T, Yamamoto T, Kishi H, Korkmaz K, Saatcioglu F, Fuse H, Muraguchi A. Protein inhibitor of activated STAT3 regulates androgen receptor signaling in prostate carcinoma cells. Biochem Biophys Res Commun. 2000;278:9–13. doi: 10.1006/bbrc.2000.3753. [DOI] [PubMed] [Google Scholar]