

Abstract
Goal: To assess the reliability of a reference standard for an information extraction task.
Setting: Twenty-four physician raters from two sites and two specialities judged whether clinical conditions were present based on reading chest radiograph reports.
Methods: Variance components, generalizability (reliability) coefficients, and the number of expert raters needed to generate a reliable reference standard were estimated.
Results: Per-rater reliability averaged across conditions was 0.80 (95% CI, 0.79-0.81). Reliability for the nine individual conditions varied from 0.67 to 0.97, with central line presence and pneumothorax the most reliable, and pleural effusion (excluding CHF) and pneumonia the least reliable. One to two raters were needed to achieve a reliability of 0.70, and six raters, on average, were required to achieve a reliability of 0.95. This was far more reliable than a previously published per-rater reliability of 0.19 for a more complex task. Differences between sites were attributable to changes to the condition definitions.
Conclusion: In these evaluations, physician raters were able to judge very reliably the presence of clinical conditions based on text reports. Once the reliability of a specific rater is confirmed, it would be possible for that rater to create a reference standard reliable enough to assess aggregate measures on a system. Six raters would be needed to create a reference standard sufficient to assess a system on a case-by-case basis. These results should help evaluators design future information extraction studies for natural language processors and other knowledge-based systems.
Evaluators often compare the output of a knowledge-based system to a set of correct answers, known as the reference standard. When a reference standard is generated by expert opinion, it may be far from perfect or “gold.” Yet the reference standard must be of high quality to measure the system's performance accurately and to differentiate several competing systems. Reliability1, 2 is one measure of the quality of a reference standard: it quantifies the agreement among the experts who generated the standard. Poor reliability leads to poor estimates of system accuracy. Evaluators use reliability studies2 to determine whether a reference standard is appropriate for an evaluation and whether it needs to be improved either by increasing the number of experts or by training the experts.
Unfortunately, there have been relatively few reliability studies in medical informatics that have been aimed at knowledge-based system evaluation1 (although other areas such as questionnaires have been covered3). For studies that have used a single expert (without repeat measures), little can be done to measure reliability. A number of researchers have enlisted multiple experts,4,5,6 but because that reliability was not quantified, it cannot be said with assurance that the reliability was sufficient. In some cases, researchers have looked at the variability among experts in various forms—having experts rate each other,7, 8 measuring distance among experts,9,10,11 or calculating an error rate among experts12—but because traditional measurement techniques were not used, the results are difficult to apply to other evaluations. In one such case, the data from an earlier evaluation8 were reused to illustrate the concepts of measurement.1 The body of literature comprising reliability studies in medical informatics clearly needs to be expanded.1
For this paper, we drew on data from two earlier evaluations on natural language processing in medicine.9, 10 Both evaluations had compared the ability of a natural language processor called MedLEE13 to the ability of physicians to draw conclusions from radiology reports. We carried out a reliability study on the physician data and estimated the number of experts needed to generate reference standards for similar evaluations in the future.
Background
Reliability: Classical Theory and Generalizability Theory
Reliability and validity are two important aspects of measurement. Reliability refers to the reproducibility or precision of a result, whereas validity refers to the correctness or accuracy of the result.1, 2 These concepts can be applied to reference standards. Assume that there are a number of experts, more generally referred to as raters, who perform some task on a set of patient cases, resulting in a score for each rater-case pair. The best estimate for the right answer for each case is some combination (for example, average) of the raters' answers, and this becomes the reference standard. Reliability is a measure of the reproductibility of the standard, which can be estimated on the basis of the extent of agreement of the raters. The more the raters agree, the more likely the same reference standard can be reproduced if the study is repeated with the same raters or with a new set of (similar) raters. Validity, on the other hand, is the degree to which the reference standard answers the question intended by the evaluator. In this paper, we focus on reliability but cover validity briefly in the Discussion section.
Reliability can be improved by increasing the number of raters (that is, adding more raters of equivalent quality) or by improving the agreement among raters. Increasing the number of raters improves the reliability of the overall reference standard because the raters' individual quirks are averaged out by a larger number of raters. It is analogous to improving the estimate of the mean by making more measurements. Agreement between individual raters can be improved by training the raters or by removing raters who are especially different from the others. (Removing raters must be done with great care, however, because it may sacrifice validity; the rater who is different may be the one who is correct.) Adding raters and training raters can consume considerable resources, so it is important to quantify reliability and decide how much is enough.
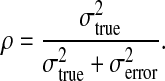
In classical reliability theory, one can qualify reliability by estimating the variance in the raters' answers for each case and separating it into two components. The true variance, σtrue2, represents the true differences between cases independent of raters' differences (for example, the correct diagnosis); ideally, the reference standard should have only true variance. The error variance, σerror2, includes systematic differences in how raters approach individual cases (for example, differences of opinion) and unsystematic errors (for example, coding errors). The reliability coefficient,2 ρ, can then be defined as the proportion of the total variance of interest (σtrue2 + σerror2) that represents the true information being sought (σtrue2). Explicitly, the reliability coefficient, ρ, can be defined as,
 |
1 |
The reliability coefficient equals one when there is no error, and the variation in answers from case to case reflects only the true differences between cases. It equals zero when there is only error.
Classical theory is limited to simple studies in which the variance can be divided into two components. Often, there are many sources of error—known as facets1—that each contributes to the variance. It is not always appropriate to lump these sources of error together under a single σerror2 error term. Generalizability theory14, 15 is an extension of classical theory that accommodates multiple facets and complex study designs. Shavelson et al.15 have published an excellent tutorial. The general approach is to first carry out a generalizability (G) study, which estimates the magnitude of as many sources of error as possible (using a procedure such as variance component analysis16), and then to carry out a decision (D) study, which uses the information from the G study to optimize reliability for a particular purpose.15
For example, even the simple example of cases and raters can benefit from generalizability theory. The variance can actually be divided into three (not two) components. The first component, case variance, or σcase2, is identical to σtrue2; it represents the true differences between cases independent of raters' differences and errors. The second component is rater variance, or σrater2, which represents the tendency of raters to over- or under-diagnose cases (overall threshold to call a condition positive). The third component is the residual variance, or σresid2, which contains additional systematic errors and all the unsystematic error. The earlier term, σerror2, equals the sum of σtrue2 and σresid2.
In a G study, the magnitude of the three components, σcase2, σrater2, and σresid2, would be estimated using variance component analysis, and reliability* would be estimated by the generalizability coefficient.15 In this example, the generalizability coefficient would be defined only in terms of case and residual variances. Rater variance does not contribute to distinguishing cases; it shifts the level of all the cases equally. Because most knowledge-based system evaluations include some arbitrary threshold set by the evaluator, this variance component does not contribute to the reliability estimate. The reliability of each rater's answers would then be estimated by the following generalizability coefficient (denoted ρ1), which is analogous to the reliability coefficient in Equation 1:
 |
2 |
Notice the difference between Equation 1 and Equation 2. While σcase2 equals σtrue2, σresid2 is less than or equal to σerror2. The generalizability coefficient, ρ1, will be greater than the reliability coefficient, ρ, when σrater2 is non-zero. Therefore, in this example, classical theory underestimates the reliability of the raters because there is no structure for separating variance components and eliminating one of them (σrater2) from the error.
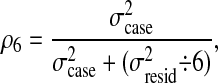
The reliability of the combined answers of the raters can also be estimated. The generalizability coefficient is defined as follows: The numerator contains the variance of the facet of interest (σcase2 in this example). The denominator contains the variance of the facet of interest plus the variance of all the sources of error divided by the number of discrete levels over which each source is averaged. If, for example, there were six raters in the study, then the reliability, ρ6, would be given by
 |
3 |
because σresid2 is averaged over six raters. As expected, the reliability of the combined answer of the six raters, ρ6, is greater than the reliability for individual raters, ρ1.
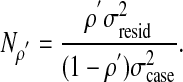
A D study takes the result of a G study and applies it to a new situation. Say, for example, the goal was to achieve some target reliability, ρ′. A D study could tell how many raters would be necessary to achieve that reliability. The number of raters, Nρ′ needed to create an adequate reference standard would be given by
 |
4 |
A target reliability of 0.7 is often suggested as adequate,1, 17 but in fact the target depends on how the reference standard will be used. If the standard will be used only to estimate the overall performance of a system—using measures such as accuracy, sensitivity, or specificity—then a reliability of 0.7 is probably sufficient because individual mistakes will be averaged over many cases. If, however, the reference standard will also be used to uncover the details of why the system failed on a case-by-case basis, then a much greater reliability is needed. A reliability of 0.95 has been suggested17 as reasonable for drawing conclusions about individual cases. The consequence of too low a reliability is that a large proportion of the supposed system errors will in fact be the fault of the reference standard, and some true system errors will be missed. For example, in this paper the answers are dichotomous and the conditions are rare, so the variance approximately equals the proportion of positive answers in the reference standard. A reliability of 0.7 implies that about 30 percent of the variance is error, so nearly 30 percent of the positive answers in the reference standard are in fact incorrect, and a small proportion of the negative answers are incorrect. If the system were modified based on this case-by-case analysis, a large portion of the modifications would actually make the system worse!
MedLEE Evaluation and Information Extraction
MedLEE is a natural language processor that has undergone a number of evaluations,9, 10, 18, 19, 20 including a demonstration that it improved patient care by improving respiratory isolation.21 The data from two of these evaluations9, 10 were used in this paper to carry out a reliability study. The original goal of the evaluations was to compare the performance of the natural language processor to physicians, lay persons, and alternative computer algorithms. The task was to decide the presence or absence of six or seven clinical conditions based on reading a radiology report. Majority physician opinion was used as a reference to calculate sensitivity and specificity for the subjects. The first evaluation,9 carried out at New York Presbyterian Hospital (NYP, formerly Presbyterian Hospital), showed that the system was indistinguishable from the physicians and superior to the other subjects. The second evaluation,10 carried out at Brigham and Women's Hospital (BW), showed a small but measurable drop in performance due to transferring the system.
A summary of the variables (facets) used in these evaluations is shown in ▶. Both studies enlisted 12 physicians and 200 cases with chest radiograph reports. Cases were a random sample of inpatient admissions that included chest radiographs. Physicians were a convenience sample of internists and radiologists from the two institutions, selected on the basis of their affiliation with the institutions and willingness to cooperate. To allow the use of many reports without unduly taxing the physicians, a balanced incomplete block design was used22: Each physician read half the reports (100), and each report was read by half the physicians (6).
Table 1.
Variable Definitions
| Variable | Definition | Levels |
|---|---|---|
| Score | Presence of a condition (the dependent variable) | Present (1); absent (0) |
| Site | Medical center | NYP; BW |
| Case | Chest radiograph for a unique patient; nested within site | 200 cases per site (400 total) |
| Condition | Clinical condition the raters were looking for; nested within site | See ▶ |
| Specialty | Clinical specialty of rater | Internist; radiologist |
| Rater |
Physician rater; nested within site and specialty |
6 raters per site-specialty pair (24 total) |
| Note: NYP indicates New York Presbyterian Hospital; BW, Brigham and Women's Hospital. | ||
The task was to read one chest radiograph report for each case and determine whether one or more of a set of clinical conditions was present. There were nine unique conditions in total; they are enumerated in the first column of ▶. They represented common conditions useful for automated decision support9 and order entry.10 The four conditions in common between the two evaluations had somewhat different definitions. Most notably, in the first evaluation, “pleural effusion” excluded effusions associated with congestive heart failure9; they were included in the second evaluation.10
Table 2.
Variance Components for Random Effects
| Site | Condition | Case | Rater | Case-specialty | Residual |
|---|---|---|---|---|---|
| NYP | Congestive heart failure | 0.0964* | 0.0001 | 0.0000 | 0.0164* |
| Pneumonia | 0.0844* | 0.0014 | 0.0000 | 0.0354* | |
| Pleural effusion | 0.0609* | 0.0009 | 0.0012 | 0.0306* | |
| Pneumothorax | 0.0341* | 0.0000 | 0.0003 | 0.0050* | |
| COPD | 0.0263* | 0.0001 | 0.0000 | 0.0106* | |
| Neoplasm | 0.0541* | 0.0008 | 0.0000 | 0.0189* | |
| BW | Congestive heart failure | 0.0173* | 0.0002 | 0.0000 | 0.0275* |
| Pneumonia | 0.0854* | 0.0029 | 0.0000 | 0.0382* | |
| Pleural effusion | 0.1681* | 0.0005 | 0.0004 | 0.0244* | |
| Pneumothorax | 0.0115* | 0.0000 | 0.0008* | 0.0017* | |
| Atelectasis | 0.1069* | 0.0023 | 0.0019 | 0.0326* | |
| Rib fracture | 0.0345* | 0.0001 | 0.0005 | 0.0058* | |
| Center line presence | 0.0472* | 0.0000 | 0.0034* | 0.0017* | |
| (Both) |
Average condition |
0.0705* |
0.0007* |
0.0006* |
0.0191* |
| Note: NYP indicates New York Presbyterian Hospital; BW, Brigham and Women's Hospital. | |||||
Significantly different from zero at 0.05 level.
As documented in detail in the second evaluation,10 the tasks had varying levels of difficulty, depending on the condition and on the case. Determining the presence of a rib fracture on the basis of a chest radiograph report should be easy, but determining that a finding represents a probable malignancy is by no means straightforward. Difficulty also appeared to vary by case. Pairs of physicians disagreed on at least one condition for 22 percent of reports; the source of disagreement appeared to be interpretation of findings, gauging likelihood and degree of disease, and coding errors. For example, this report was taken from the second study10:
History: Vaginal bleeding, fibroid uterus.
Findings: A small left-sided effusion is seen. Patchy parenchymal opacities are seen within both lower lobes, left greater than right. Mild redistribution of the pulmonary flow is seen as well as distention of the superior vena cava and azygos vein. An NG tube is seen terminating the stomach.
Impression: Small left-sided effusion. Bibasilar subsegmental atelectasis.
Two radiologists and two internists concluded that atelectasis was present, but one radiologist and one internist did not.10 The disagreement in this example may have been due to differences of opinion on whether subsegmental atelectasis was significant or whether the patchy infiltrates really signified atelectasis, or it may have been due to coding errors. Other reports, such as “normal exam,” caused less disagreement.
Methods
Our approach was to combine the data from the two evaluations, design the model, estimate the variance components, and calculate the generalizability coefficients. In the combined data set, the site facet indicated the source of the data (NYP or BW). There was no overlap of cases between the sites, so the case facet was nested within site. Because the condition definitions differed between the two evaluations, the four conditions in common between the two sites were treated as eight different conditions. Therefore, 13 conditions were included in the analysis, and they were nested within site. The specialty facet (radiologist versus internist) was crossed with site. The raters were nested within specialty and site (each rater belonged to only one specialty and one site).
A separate generalizability analysis was done for each condition, as suggested by Shavelson et al.15 The reasoning is as follows: The condition facet is different from the rater, specialty, and site facets in the sense that one does not want to know the average score across conditions. An average score would indicate how many conditions a patient has but not which specific conditions the patient has. A standard model that uses the case variance as the numerator of the generalizability coefficient (Equation 2) is really averaging over the other facets in the model; therefore, if the condition facet is included, the case variance will not reflect the specific diagnosis for each case. Doing a separate analysis for each condition provides the appropriate reliability estimate for making a diagnosis. Because each condition had only one site and a separate analysis was done for each condition, it was not possible to estimate the site variance component: the site facet dropped out of the model.
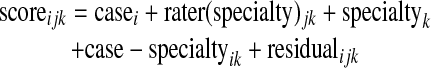
The following variance component model was used for each condition:
 |
5 |
where i is an index on case (200 levels), j is an index on rater within specialty (6 levels), k is an index on specialty (2 levels), rater is nested within specialty, and case-specialty is an interaction term. Case, rater, case-specialty, and the residual were random effects. Specialty was a fixed effect (its two levels were in no way a random sample: one might expect radiologists to read radiograph reports differently from other specialists). The interaction between rater-within-specialty and case could not be distinguished from the residual error in this study. Making the distinction would require retesting raters on the same cases; this was not done in the NYP study, and it was done only for a small number of cases in the BW study.
Variance components were estimated with the SAS procedure MIXED.16 The statistical significance of random effects was estimated using the variance-covariance matrix provided by SAS. The generalizability coefficient included the following terms: The true variance of interest (numerator) comprised the case variance. The error variance comprised only the residual error variance. Therefore, generalizability coefficients were calculated according to Equation 2.
Rater variance was not included as a source of error for reasons described in the Background section. It changes the overall level of the result but does not interfere with distinguishing cases. The overall level of the result is somewhat arbitrary in this study anyway because of the use of the word “probably” in the condition definitions. The specialty component could not be included because it is a fixed effect (no variance was estimated). Even if it were a random effect, it would not have been included, however, because it would also change only the overall level of the result without interfering with distinguishing cases.
The case-specialty component reflects consistent differences in how the two specialties approached cases. It was not considered a source of error for this generalizability coefficient, under the assumption that most investigators pick experts in a related field rather than arbitrarily picking experts from many fields. For example, a urology study is likely to have only urologists as experts, and additional specialty variance will not contribute to the result. (The reader is free, of course, to calculate any generalizability coefficient desired from the reported variance components.)
The number of raters needed to achieve reliability coefficients of 0.7 and 0.95 were estimated using Equation 4. Ninety-five percent confidence intervals were estimated from the variance-covariance matrix using propagation of errors.23 The intervals are conditional on the current choices of specialty and site.
Results
The variance components for the random effects are shown in ▶. All case and residual components were significantly greater than zero. The non-zero case component implies that cases had measurably different diagnoses; raters' answers were not merely noise. The non-zero residual component implies that raters disagreed on their interpretation for individual cases or coding errors occurred, or both. The rater component was small compared with the other components and was statistically indistinguishable from zero within individual conditions. It therefore appears that raters did not differ much in their overall threshold to call a condition positive.
The case-specialty component (differences in how the specialties approached cases) was generally small and indistinguishable from zero, with two exceptions: central line presence and, to a lesser degree, pneumothorax. The fixed effect, specialty, was not significant for any condition (it is not included in ▶ because there are no variance components associated with a fixed effect). This implies that raters within a specialty (on average) did not differ much in their overall threshold to call a condition positive.
▶ shows the generalizability coefficients for each condition; the coefficients are per rater (ρ1). They ranged from 0.67 to 0.97, with most of them between 0.7 and 0.9. The average was 0.80. Conditions that one might expect to be straightforward—pneumothorax, rib fracture, and central line presence—did have a high reliability, and conditions that should require significant interpretation—pneumonia and neoplasm—did have lower reliability. The conditions that were common between sites had very similar reliability except for pleural effusion. This may have been due to the exclusion criterion (no effusions associated with congestive heart failure) specific to NYP Hospital; it may have confused those raters.
Table 3.
Reliability and Number of Raters
| Site | Condition | Generalizability Coefficient per Rater, ρ1 (95% CI) | No. of Raters for ρ = 0.7 (95% CI) | No. of Raters for ρ = 0.95 (95% CI) |
|---|---|---|---|---|
| NYP | Congestive heart failure | 0.85 (0.83-0.88) | 1 (1-1) | 4 (1-8) |
| Pneumonia | 0.70 (0.66-0.75) | 1 (1-2) | 8 (4-12) | |
| Pleural effusion | 0.67 (0.61-0.72) | 2 (1-2) | 10 (6-14) | |
| Pneumothorax | 0.87 (0.85-0.90) | 1 (1-1) | 3 (1-7) | |
| COPD | 0.71 (0.67-0.76) | 1 (1-2) | 8 (4-12) | |
| Neoplasm | 0.74 (0.70-0.78) | 1 (1-2) | 7 (3-11) | |
| BW | Congestive heart failure | 0.80 (0.76-0.83) | 1 (1-2) | 5 (1-9) |
| Pneumonia | 0.69 (0.64-0.74) | 2 (1-2) | 9 (5-13) | |
| Pleural effusion | 0.87 (0.85-0.90) | 1 (1-1) | 3 (1-7) | |
| Pneumothorax | 0.87 (0.85-0.90) | 1 (1-1) | 3 (1-7) | |
| Atelectasis | 0.77 (0.72-0.81) | 1 (1-2) | 6 (2-10) | |
| Rib fracture | 0.86 (0.83-0.88) | 1 (1-1) | 4 (1-8) | |
| Central line presence | 0.97 (0.96-0.97) | 1 (1-1) | 1 (1-5) | |
| Both | Average condition | 0.80 (0.79-0.81) | 1 (1-1) | 6 (5-7) |
The raters were reliable enough that one, or at most two, raters were sufficient to achieve a reliability of 0.70 and calculate aggregate measures on a system. One to ten raters, with an average of six, were needed to achieve a reliability of 0.95 and perform a case-by-case analysis.
Discussion
The most striking result of the study is the high reliability of the raters in this report interpretation task. If one is looking to measure the accuracy of a system in such a task, then a single rater (on average) is reliable enough to create the reference standard.
In practice, however, one would not use a single rater, because then there is no way to document that the chosen rater was typical and that the task was similar to the ones in this study. Nevertheless, a rater who was previously shown to be reliable on a similar task might be enlisted to create a reference standard alone. Or three raters could be tested on the same subset of the cases, and then one or more of those raters could assess the rest of the set alone. As long as the reliability for the common subset was reasonable, a single rater could be trusted to do the rest.
Often a researcher wants to not only measure overall performance, but also assess the reasons for substandard performance. Making case-by-case assessments requires higher reliability. Six raters were found to be necessary in this study. Because the original evaluations9,10 used six raters per case, their reference standards were sufficient to assess performance on a case-by-case basis (a detailed error analysis was in fact published in the second study10).
The applicability of these results to other evaluations depends on the generalizability of its design factors. The cases were randomly selected from two academic medical centers; other environments may have different results. The tasks were reading chest radiograph reports and determining the presence of clincial conditions. This is a typical task for an expert system: given data, determine the presence of conditions. The domain of chest radiographs may be less complex than other domains such as discharge summaries. Overall, it is likely that these are relatively simple tasks and that the estimated number of raters needed for a reliable standard is therefore a lower limit.
No single measurement study will apply to all situations. Only if other researchers carry out and publish similar reliability studies will it be possible to design new evaluations with confidence. In a somewhat similar study, eight physicians and a knowledge-based system named Hypercritic8 generated 298 comments about the care of hypertensive patients. The eight physicians then reviewed all 298 comments and judged them to be correct or incorrect. The reference standard was the majority opinion of the physician judges about each comment. The target demonstration study was to compare Hypercritic's answers to this standard. The measurement study1 found a reliability of 0.65 for the reference standard with eight judges (ρ8), implying that single judges had a reliability of about 0.19 (ρ1). This is very different from the reliability obtained in the current study. Whereas the MedLEE task involved fairly simple mapping from radiology reports to clinical conditions, the Hypercritic study involved a much more complex medical interpretation. This highlights the importance of doing many measurement studies to understand how context affects reliability, and reassessing reliability in every study to confirm that the expected reliability is achieved.
One limitation of the study is that we used a normal mixed-effects model to estimate variance components rather than a model designed specifically for binary outcomes. Methods to estimate variance components from mixed-effect models with binary outcomes are still experimental and not readily available for large problems like this one. Nevertheless, we believe the current results are a reasonable approximation to the true reliability of the raters.
This analysis assessed reliability, not validity. The results shown in ▶ demonstrate that expert raters answer similarly, but not that those answers are valid (for example, that the diagnoses are correct). The MedLEE evaluations had evidence of the three types of validity.1 The use of expert raters who were boardcertified physicians, including both producers (radiologists) and consumers (internists) of the reports, supported content or face validity. The presence of a significant, but imperfect, correlation with the patients' discharge diagnoses, which is what would be expected when admission radiographs are compared to discharge diagnoses, supports criterion-related validity. Construct validity can be addressed by comparing the performance of the subjects. As expected, lay persons differed significantly from the expert raters.9,10 The natural language processing system was indistinguishable from the raters in the first study, but slightly different from them in the second study after the processor was transported to a new locale.
Conclusion
Knowledge-based systems are frequently compared to expert-generated reference standards. Designing an appropriate standard requires knowing the reliability of the expert raters and knowing what question needs to be answered. In the task of determining the presence or absence of clinical conditions on the basis of chest radiograph reports, physician raters were very reliable. An appropriate reference standard would need one to six raters, depending on whether only aggregate measures like overall accuracy are being assessed or whether individual cases are being examined. Based on the much lower reliability found in an earlier hypertension critiquing study, it is clear that more reliability studies must be done for researchers to design future evaluations with confidence.
Acknowledgments
The authors thank Charles P. Friedman, PhD, for discussions that motivated this paper.
This work was supported by grants R29-LM05627, R29-LM05397, and R01-LM06274 from the National Library of Medicine; grant R01-HS08927 from the Agency for Health Care Policy and Research; and a Center for Advanced Technology grant from the New York State Science and Technology Foundation.
Footnotes
The term “generalizability”14 has been coined as a replacement for “reliability” because it reflects generalizability theory's emphasis on explicitly defining the universe to which one is allowed to generalize. Nevertheless, the generalizability coefficient is a legitimate estimate of reliability as defined in this paper, and generalizability theory authors continue to use both words.15 In this paper, we use the word “reliability” throughout.
References
- 1.Friedman CP, Wyatt JC. Evaluation Methods in Medical Informatics. New York: Springer, 1997.
- 2.Dunn G. Design and Analysis of Reliability Studies. New York: Oxford University Press, 1989.
- 3.Cork RD, Detmer WM, Friedman CP. Development and initial validation of an instrument to measure physicians' use of, knowledge about, and attitudes toward computers. J Am Med Inform Assoc. 1998;5:164-76. [DOI] [PMC free article] [PubMed] [Google Scholar]
- 4.Bates DW, Cullen DJ, Laird N, et al. Incidence of adverse drug events and potential adverse drug events: implications for prevention. JAMA. 1996;274:29-34. [PubMed] [Google Scholar]
- 5.Berner ES, Webster GD, Shugerman AA, et al. Performance of four computer-based diagnostic systems. N Engl J Med. 1994;330:1792-6. [DOI] [PubMed] [Google Scholar]
- 6.Cooper GF, Miller RA. An experiment comparing lexical and statistical methods for extracting MeSH terms from clinical free text. J Am Med Inform Assoc. 1998;5:62-75. [DOI] [PMC free article] [PubMed] [Google Scholar]
- 7.Yu VL, Fagan LM, Wraith S, et al. An evaluation of MYCIN's advice. In: Buchanan BG, Shortliffe EH (eds). Rule-based Expert Systems: The MYCIN Experiments of the Stanford Heuristic Programming Project. Reading, Mass.: Addison-Wesley, 1984.
- 8.van der Lei J, Musen MA, van der Does E, Man in't Veld AJ, van Bemmel JH. Comparison of computer-aided and human review of general practitioners' management of hypertension. Lancet. 1991;338:1504-8. [DOI] [PubMed] [Google Scholar]
- 9.Hripcsak G, Friedman C, Alderson PO, DuMouchel W, Johnson SB, Clayton PD. Unlocking clinical data from narrative reports: a study of natural language processing. Ann Intern Med. 1995;122:681-8. [DOI] [PubMed] [Google Scholar]
- 10.Hripcsak G, Kuperman GJ, Friedman C. Extracting findings from narrative reports: software transferability and sources of physician disagreement. Method Inform Med. 1998;37:1-7. [PubMed] [Google Scholar]
- 11.Verdaguer A, Patak A, Sancho JJ, Sierra C, Sanz F. Validation of the medical expert system PNEUMON-IA. Comput Biomed Res. 1992;25:511-26. [DOI] [PubMed] [Google Scholar]
- 12.Will C. Comparing human and machine performance for natural language information extraction: results for English microelectronics from the MUC-5 evaluation. In: Proceedings of the Fifth Message Understanding Conference (MUC-5); Aug 25-27, 1993; Baltimore, Md.
- 13.Friedman C, Hripcsak G, DuMouchel W, Johnson SB, P.D. Clayton. Natural language processing in an operational clinical information system. Natural Language Engineering. 1995;1:83-108. [Google Scholar]
- 14.Cronbach LJ, Gleser GC, Nanda H, Rajaratnam N. The dependability of behavioral measurements: theory of generalizability of scores and profiles. New York: John Wiley, 1972.
- 15.Shavelson RJ, Webb NM, Rowley GL. Generalizability theory. Am Psychologist. 1989;44:922-32. [Google Scholar]
- 16.SAS Institute, Inc. SAS/STAT Software: Changes and Enhancements through Release 6.11. Cary, N.C.: SAS Institute, 1996:533-656.
- 17.StataCorp. Stata Statistical Software, release 4.0, volume 2. College Station, Tex.: StataCorp, 1995:163. [Google Scholar]
- 18.Carol Friedman, George Hripcsak, Irina Shablinsky. An evaluation of natural language processing methodologies. Proc AMIA Annu Fall Symp. 1998:855-9. [PMC free article] [PubMed]
- 19.Adam Wilcox, George Hripcsak. Knowledge discovery and data mining to assist natural language understanding. Proc AMIA Annu Fall Symp. 1998:835-9. [PMC free article] [PubMed]
- 20.Jain NL, Knirsch C, Friedman C, Hripcsak G. Identification of suspected tuberculosis patients based on natural language processing of chest radiograph reports. Proc AMIA Annu Fall Symp. 1996:542-6. [PMC free article] [PubMed]
- 21.Knirsch CA, Jain NL, Pablos-Mendez A, Friedman C, Hripcsak G. Respiratory isolation of tuberculosis patients using clinical guidelines and an automated clinical decision support system. Infect Control Hosp Epidemiol. 1998;19:94-100. [DOI] [PubMed] [Google Scholar]
- 22.Fleiss JL. The Design and Analysis of Clinical Experiments. New York: John Wiley, 1986:291-305.
- 23.Mood AM, Graybill FA, Boes DC. Introduction to the Theory of Statistics, 3rd ed. New York: McGraw-Hill, 1974:181.