Abstract
Background:
Understanding skeletal maturity is important in the management of idiopathic scoliosis. Iliac apophysis, triradiate cartilage, hand, and calcaneal ossification patterns have previously been described to assess both peak height velocity (PHV) and percent growth remaining; however, these markers may not be present on standard spine radiographs. The purpose of this study was to describe a novel maturity assessment method based on proximal humeral epiphyseal ossification patterns.
Methods:
Ninety-four children were followed at least annually throughout growth with serial radiographs and physical examinations. The PHV of each child was determined by measuring the change in height observed at each visit and adjusting for the interval between visits. Percent growth remaining was determined by comparing current to final standing height. The humeral head periphyseal ossification was grouped into stages by 8 investigators ranging from medical student to attending surgeon.
Results:
The morphologic changes involving the proximal humeral physis were categorized into 5 stages based on development of the humeral head epiphysis and fusion of the lateral margin of the physis. Our novel classification scheme was well distributed around the PHV and reliably correlated with age of peak growth and percent growth remaining with >70% nonoverlapping interquartile ranges. Furthermore, the scheme was extremely reliable with intraclass correlation coefficients of 0.96 and 0.95 for intraobserver and interobserver comparisons, respectively.
Conclusions:
The humeral head classification system described here was strongly correlated with age of PHV as well as percentage growth remaining. Furthermore, the staging system was extremely reliable in both interobserver and intraobserver correlations suggesting that it can be easily generalized.
Clinical Relevance:
As a view of the humeral head is almost always present on standard scoliosis spine x-ray at our institution, our classification can be easily adapted by surgeons to gain additional insight into skeletal maturity of patients with scoliosis. We believe that our method will significantly improve the evaluation of the child with scoliosis without increasing radiation exposure, time, or cost.
Key Words: scoliosis, humeral head growth morphology, classification system, pediatric growth markers, peak growth velocity, growth remaining
The accurate assessment of skeletal maturity and growth is crucial for many decisions in pediatric orthopaedics such as the management of adolescent idiopathic scoliosis,1–3 the determination of when to stop growth using an epiphysiodesis, and the treatment of contralateral slipped capital femoral epiphysis.4,5 To assess these important metrics, a variety of systems have been developed.
This began with the work of Todd et al6 in 1937 and includes the famous Greulich and Pyle atlas of the hand7–9 as well as the Tanner-Whitehouse III (TW-III) system.10,11 Unfortunately, many of these systems either did not take into account the timing of growth [the peak height velocity (PHV) age—PHV or peak growth age (PGA), both terms are used] or were too complicated for routine clinical use.12 Furthermore, increased awareness of the need to minimize radiation in children has suggested that maturity should be able to be assessed from any required x-ray image. Given these issues, the optimal methods for predicting the remaining growth and precise degree of skeletal maturity in children remains a pressing area of research.
Fortunately, progress in addressing these issues has been seen in the development of site-specific staging systems. For example, previous work demonstrated a method of evaluating the hand that was based upon the TW-III system and was found to be more straightforward than the full system yet more accurate than either the Risser grading system or the Greulich and Pyle atlas.13–15 Similarly, our group has developed a method of skeletal maturity and growth determination based on ossification of the calcaneal apophysis that was found to be well distributed around PHV with excellent intraobserver and interobserver reliability.16,17 Despite these advances, no such method currently exists for evaluating the physes of the upper extremity that are captured in standard scoliosis spine films.
In this study, we hypothesized that proximal humeral ossification would closely correlate with growth, could be staged with high interrater and intrarater reliability, and could be integrated with existing clinical classification systems to better understand growth.
METHODS
The Brush Inquiry was a prospective, longitudinal assessment of growth conducted with 4435 children in Cleveland, OH between 1926 and 1942.18 The study was directed by Dr T. Wingate Todd of the Brush Foundation at Western Reserve University. These children were followed at least annually using serial radiographs of their skull and left-sided extremities including shoulder, elbow, wrist, hand, hip, knee and foot.16,18
Notably, these radiographs were used by Greulich and Pyle in their landmark atlas of bone age using hand ossification and the same set has been used to describe other ossification markers.7,8 Furthermore, the data are enriched by anthropometric data such as height and weight that were recorded when the children presented for radiographs. Height was measured with a stadiometer using a standardized method meaning that measurements would be consistent between observers and over time. Children selected did not have any gross physical or mental defect and parental permission was granted for children to participate for the duration of the study.18,19
Here we identified a subset of 94 children (49 female, 45 male individuals) who had complete data with consecutive radiographs and height data performed at least annually between the ages of 10 and 15 years. This age range was selected because it corresponds with the PHV and therefore represents the usual age of decision making in managing adolescent idiopathic scoliosis.
The PGA was defined by calculating growth velocity in centimeters per year and applying a cubic spline method to fit curves. The age at which the child went through PHV was then determined after the approach of Tanner and Davies. Determining PHV by this validated approach determines a single time point that represents the instant when the fastest rate of growth occurs.16 We also calculated percent growth remaining by comparing the standing height of the child at the time of radiograph and their final standing height measurement at age 18. Note that 10% of growth remaining occurs around PGA and is plotted in Figure 3. All other figures use the cubic spline method for PGA.
FIGURE 3.
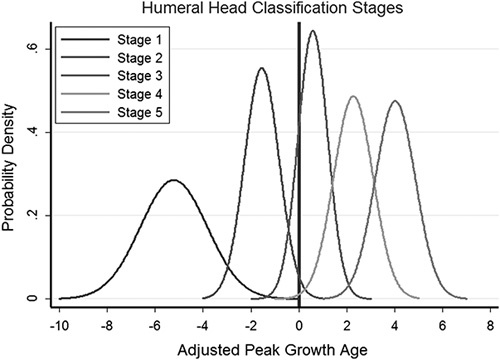
Normalized distribution of staging with age to PHV (years) on the x-axis and proportion of observations on the y-axis. A vertical line is drawn at PHV occurring between stages 2 and 3. PHV indicates peak height velocity.
Eight observers including 3 medical students, 3 residents, and 2 attending surgeons viewed randomly selected radiographs from 30 patients in order to assign a humeral head stage for each radiograph. Risser, triradiate closure, and hand systems were also determined during the same sets of radiographs using widely accepted guidelines. Cohen’s κ was calculated to determine intraobserver and interobserver reliability. Means and SDs were determined using pooled data from all observers. Stata was used for statistical analysis and plots were generated in Microsoft Excel.
RESULTS
A 5-stage humeral head classification system was developed based on the appearance of the lateral margin of the epiphysis (schematized in Fig. 1 with examples provided in Fig. 2). The earliest radiographs examined (on average 5.22 y before PHV) showed partial ossification of the humeral head epiphysis leaving an oblique lateral epiphyseal margin and a triangular area of radiolucency. Ossification then continued with rounding of the lateral margin (on average 1.54 y before PHV) that continued via lateral epiphyseal growth until the margin became colinear to the metaphysis (on average 0.58 y after PHV). Partial and complete fusion of the physis then followed (on average 2.27 and 4.02 y after PHV, respectively) (Fig. 3).
FIGURE 1.
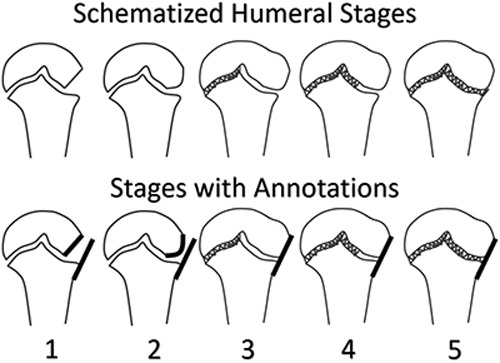
Periphyseal changes around the proximal humerus: stage 1 demonstrates an incompletely ossified lateral epiphysis such that the lateral margin is oblique (short bold line). Stage 2 demonstrates increased ossification of the lateral epiphysis with a curvilinear lateral margin (bold curve). Note that in stages 1 and 2, the bold line parallel to the lateral metaphysis does not touch the epiphysis. Stages 3 through 5 all demonstrate colinearity between the lateral margin of the epiphysis and the metaphysis such that a single bold line touches both edges. In stage 3, the lateral half of the physis is open without obvious fusion. In stage 4, the lateral half of the physis thins and begins partial fusion. Finally, by stage 5 the lateral half of the physis demonstrates essentially complete fusion. Fusion is indicated by the hashes.
FIGURE 2.
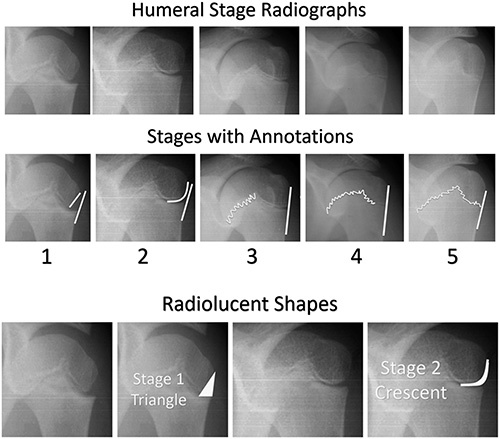
Representative images of the humeral stages. Stage 1 demonstrates an incompletely ossified lateral epiphysis leaving a triangular area of radiolucency on the lateral aspect of the epiphysis. Stage 2 demonstrates increased ossification of the lateral epiphysis leaving a crescent shaped area of radiolucency on the lateral side of the epiphysis. These shapes are highlighted below the annotations with representative images shown both unmodified and with the shapes superimposed. Note that in stages 1 and 2, the black line parallel to the lateral metaphysis does not touch the epiphysis. Stages 3 through 5 all demonstrate colinearity between the lateral margin of the epiphysis and the metaphysis. In Stage 3, the lateral half of the physis is open without obvious fusion. In stage 4, the lateral half of the physis thins and begins partial fusion. Finally, by stage 5 the lateral half of the physis demonstrates essentially complete fusion. The same annotations used on the schematic are superimposed upon the radiographic examples for ease of comparison.
In 72% of cases, PGA occurred within 1 year of the transition between stages 2 and 3. The remaining stages were well distributed both before and after the critical age of PHV. In order to place this novel system in the appropriate clinical context, well characterized standards were plotted against the humeral system (Fig. 4). From this plot we observe that the transition between stages 1 and 2 is the earliest indicator that a patient is approaching PHV. The transition between 2 and 3 also slightly precedes PHV. The humerus system was also found to be reliable when tested by investigators of diverse experience levels from high school to attending surgeon. In total, 84% of observations had perfect agreement and no set of observations differed by >1 stage. For intraobserver comparisons, κ was 0.80 and intraclass correlation coefficient was 0.96. For interobserver comparisons, κ was 0.78 and intraclass correlation coefficient was 0.95.
FIGURE 4.
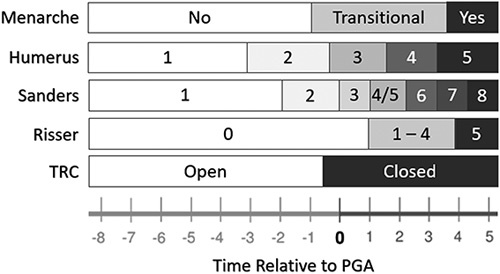
Humeral head ossification system placed in context of currently used standards for the determination of skeletal maturity including TRC, iliac apophysis ossification (Risser), hand scoring systems, and menarche. Boxes are indicated based on the stage containing the plurality of data at that time point. All ossification systems were measured on the same patients used to develop our humeral head staging system. Menarche for this dataset is likely unreliable for modern patients so a modern standard from our previous work has been used. Time relative to PGA was measured in years. PGA indicates peak growth age; TRC, triradiate cartilage closure.
As regards growth remaining, on average, patients with x-rays categorized as stage 1 had 26% (SD, 7%) of their growth remaining. Patients in stage 2 had an average of 16% of their growth remaining (SD, 5%). Patients in stage 3 had 7% growth remaining on average (SD, 4%), while patients in stage 4 had an average of 2% of growth remaining (SD, 3%). Patients in stage 5 had only 0.5% of their growth remaining on average (SD, 2%). Therefore, we found that the humeral head stages were well distributed across growth remaining (Fig. 5).
FIGURE 5.
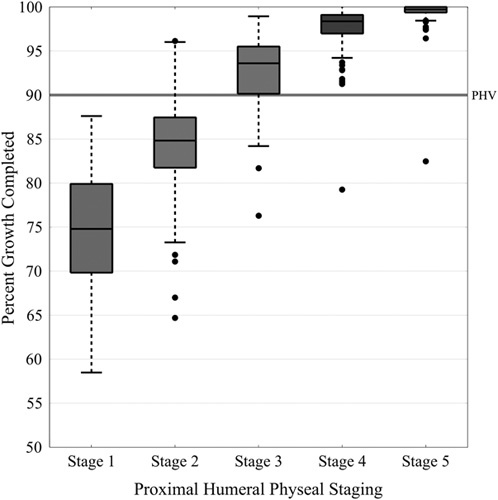
Humeral head staging system with regard to percentage of growth remaining in patients as determined by current standing height versus final standing height. Note that PHV usually occurs around 90% of growth completed and is indicated by the horizontal line. PHV indicates peak height velocity.
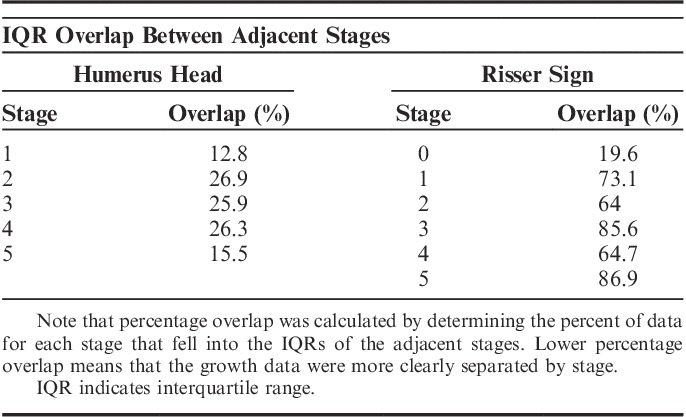
Finally, the distinctness of each humeral head stage with regards to growth remaining was determined by determining the degree of overlap between adjacent stages. The humeral head stages overlapped very little with one another with between 13% and 27% of data crossing into the interquartile ranges of adjacent stages. In contrast, the Risser sign had between 20% and 87% data that overlapped into the interquartile ranges of adjacent stages (Table 1).
TABLE 1.
Percentage of Overlap Between Adjacent Stages in Both Systems
DISCUSSION
Scoliosis is an important pediatric orthopaedic condition that affects 0.5% to 5% of adolescents20–22 and is associated with increased morbidity and mortality due to major spinal deformity, restrictive lung disease, and postoperative complications.23,24 Bracing and surgery for scoliosis are major interventions that can affect the quality of life for adolescents and cost up to $5000 for bracing or $100,000 for surgery.25,26
Selecting the proper treatment course for patients with scoliosis is therefore an important pediatric orthopaedic imperative; however, tools currently available for assessing maturity that guides treatment decision making have major limitations. For example, the Risser sign does not cover the period around peak growth where the most critical curve progression occurs and hand staging systems require additional radiation.15 The development of a reliable tool that does not require additional radiation represents a significant advance in determining maturity and directing the treatment of patients with scoliosis.
Our group has previously shown that novel markers based on periphyseal ossification can be used to reliably predict the PGA and the percent of growth remaining.17 Here, we show that the proximal humerus provides one such potential marker of growth that can be used to accurately determine growth in the treatment of scoliosis. Specifically, we demonstrate that proximal humeral ossification closely correlates with both age of PGA and % growth remaining, features much less overlap between stages compared with the Risser system, and can be implemented by providers with a broad range of experience with high interrater and intrarater reliability. Therefore, we conclude that this novel classification system can be learned easily by physicians and provides additional information about skeletal maturity. The position can also be easily understood by radiology technicians because it is seen with the hands by the sides and the palms facing forwards. Furthermore, since a view of the humeral head is almost always present on standard scoliosis spine x-ray at our institution we believe that this classification system will improve care without increasing radiation, time, or cost.
A possible limitation of this study is the historical collection of radiographs; however the suggestion that these patients are not representative because children now reach puberty at an earlier age is not accurate as our system compares PHV and growth remaining to skeletal maturity rather than chronological age.12,27,28 Specifically, a calcaneal classification that we developed with the same collection matched well with a modern cohort.17,27 Furthermore, there may also be concerns that children in the Bolton Brush study were more likely to be malnourished; however, the selection of participants included criteria such as good health. Finally, although growth remaining values are presented for each stage in this study, the values for stages 1 and 5 should be interpreted with caution, as they are influenced by the age range used in the study.
Development of a staging system involving the proximal humeral physis represents a novel approach to the evaluation of skeletal maturity in scoliosis patients that can eliminate the need to obtain additional x-rays and provides better stratification of patients among treatment algorithms. In particular, we believe that this system will be effective in the evaluation of Risser 0, premenarchal patients. We are currently in the process of conducting a companion study of this system using a retrospective review of modern scoliosis patients to determine the effects of using this system in determining curve progression and effectiveness of bracing. Ultimately, the proximal humeral physis skeletal maturity system is an innovative and impactful method to assist scoliosis surgeons in the evaluation of skeletal maturity.
Footnotes
The authors declare no conflicts of interest.
REFERENCES
- 1.Lonstein JE, Carlson JM. The prediction of curve progression in untreated idiopathic scoliosis during growth. J Bone Joint Surg Am. 1984;66:1061–1071. [PubMed] [Google Scholar]
- 2.Peterson LE, Nachemson AL. Prediction of progression of the curve in girls who have adolescent idiopathic scoliosis of moderate severity. Logistic regression analysis based on data from The Brace Study of the Scoliosis Research Society. J Bone Joint Surg Am. 1995;77:823–827. [DOI] [PubMed] [Google Scholar]
- 3.Ylikoski M. Growth and progression of adolescent idiopathic scoliosis in girls. J Pediatr Orthop B. 2005;14:320–324. [DOI] [PubMed] [Google Scholar]
- 4.Popejoy D, Emara K, Birch J. Prediction of contralateral slipped capital femoral epiphysis using the modified Oxford bone age score. J Pediatr Orthop. 2012;32:290–294. [DOI] [PubMed] [Google Scholar]
- 5.Stasikelis PJ, Sullivan CM, Phillips WA, et al. Slipped capital femoral epiphysis. Prediction of contralateral involvement. J Bone Joint Surg Am. 1996;78:1149–1155. [DOI] [PubMed] [Google Scholar]
- 6.Todd TW. Atlas of Skeletal Maturation. St. Louis: The C.V. Mosby Company; 1937:1855–1938. [Google Scholar]
- 7.Pyle SI, Mann AW, Dreizen S, et al. A substitute for skeletal age (Todd) for clinical use; the red graph method. J Pediatr. 1948;32:125–136. [DOI] [PubMed] [Google Scholar]
- 8.Pyle SI, Reed RB, Stuart HC. Patterns of skeletal development in the hand. Pediatrics. 1959;24:886–903. [PubMed] [Google Scholar]
- 9.Pyle SI, Waterhouse AM, Greulich WW. Attributes of the radiographic standard of reference for the National Health Examination Survey. Am J Phys Anthropol. 1971;35:331–337. [DOI] [PubMed] [Google Scholar]
- 10.Tanner JM, Davies PS. Clinical longitudinal standards for height and height velocity for North American children. J Pediatr. 1985;107:317–329. [DOI] [PubMed] [Google Scholar]
- 11.Tanner JM, Whitehouse RH, Takaishi M. Standards from birth to maturity for height, weight, height velocity, and weight velocity: British children, 1965. II. Arch Dis Child. 1966;41:613–635. [DOI] [PMC free article] [PubMed] [Google Scholar]
- 12.Hackman L, Black S. The reliability of the Greulich and Pyle atlas when applied to a modern Scottish population. J Forensic Sci. 2013;58:114–119. [DOI] [PMC free article] [PubMed] [Google Scholar]
- 13.Sanders JO, Browne RH, McConnell SJ, et al. Maturity assessment and curve progression in girls with idiopathic scoliosis. J Bone Joint Surg Am. 2007;89:64–73. [DOI] [PubMed] [Google Scholar]
- 14.Sanders JO, Khoury JG, Kishan S, et al. Predicting scoliosis progression from skeletal maturity: a simplified classification during adolescence. J Bone Joint Surg Am. 2008;90:540–553. [DOI] [PubMed] [Google Scholar]
- 15.Vira S, Husain Q, Jalai C, et al. The interobserver and intraobserver reliability of the sanders classification versus the risser stage. J Pediatr Orthop. 2017;37:e246–e249. [DOI] [PubMed] [Google Scholar]
- 16.Nicholson AD, Liu RW, Sanders JO, et al. Relationship of calcaneal and iliac apophyseal ossification to peak height velocity timing in children. J Bone Joint Surg Am. 2015;97:147–154. [DOI] [PubMed] [Google Scholar]
- 17.Nicholson AD, Sanders JO, Liu RW, et al. The relationship of calcaneal apophyseal ossification and Sanders hand scores to the timing of peak height velocity in adolescents. Bone Joint J. 2015;97-b:1710–1717. [DOI] [PubMed] [Google Scholar]
- 18.Nelson S, Hans MG, Broadbent BH, Jr, et al. The brush inquiry: an opportunity to investigate health outcomes in a well-characterized cohort. Am J Hum Biol. 2000;12:1–9. [DOI] [PubMed] [Google Scholar]
- 19.Laowansiri U, Behrents RG, Araujo E, et al. Maxillary growth and maturation during infancy and early childhood. Angle Orthod. 2013;83:563–571. [DOI] [PMC free article] [PubMed] [Google Scholar]
- 20.Daruwalla JS, Balasubramaniam P, Chay SO, et al. Idiopathic scoliosis. Prevalence and ethnic distribution in Singapore schoolchildren. J Bone Joint Surg Br. 1985;67:182–184. [DOI] [PubMed] [Google Scholar]
- 21.Konieczny MR, Senyurt H, Krauspe R. Epidemiology of adolescent idiopathic scoliosis. J Child Orthop. 2013;7:3–9. [DOI] [PMC free article] [PubMed] [Google Scholar]
- 22.Soucacos PN, Soucacos PK, Zacharis KC, et al. School-screening for scoliosis. A prospective epidemiological study in northwestern and central Greece. J Bone Joint Surg Am. 1997;79:1498–1503. [DOI] [PubMed] [Google Scholar]
- 23.Helenius I, Mattila M, Jalanko T. Morbidity and radiographic outcomes of severe scoliosis of 90 degrees or more: a comparison of hybrid with total pedicle screw instrumentation. J Child Orthop. 2014;8:345–352. [DOI] [PMC free article] [PubMed] [Google Scholar]
- 24.Sansur CA, Smith JS, Coe JD, et al. Scoliosis research society morbidity and mortality of adult scoliosis surgery. Spine (Phila Pa 1976). 2011;36:E593–E597. [DOI] [PubMed] [Google Scholar]
- 25.Daffner SD, Beimesch CF, Wang JC. Geographic and demographic variability of cost and surgical treatment of idiopathic scoliosis. Spine (Phila Pa 1976). 2010;35:1165–1169. [DOI] [PubMed] [Google Scholar]
- 26.Yawn BP, Yawn RA. The estimated cost of school scoliosis screening. Spine (Phila Pa 1976). 2000;25:2387–2391. [DOI] [PubMed] [Google Scholar]
- 27.Li SQ, Nicholson AD, Cooperman DR, et al. Applicability of the calcaneal apophysis ossification staging system to the modern pediatric population. J Pediatr Orthop. 2017. [Epub ahead of print]. [DOI] [PubMed] [Google Scholar]
- 28.Loder RT, Estle DT, Morrison K, et al. Applicability of the Greulich and Pyle skeletal age standards to black and white children of today. Am J Dis Child. 1993;147:1329–1333. [DOI] [PubMed] [Google Scholar]


