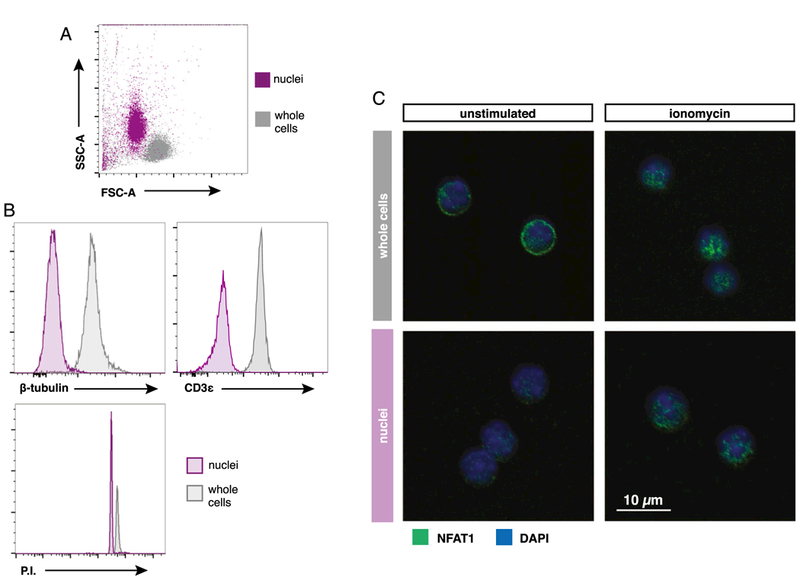
FIGURE 1. Isolation of stimulated OT-I nuclei and analysis via conventional flow cytometry.

(A) Representative forward scatter (FSC) and side scatter (SSC) plot of OT-I nuclei isolated and fixed in sucrose buffer compared with OT-I whole cells. (B) Flow cytometry histograms comparing nuclei versus whole cells stained with indicated Abs or propidium iodide (P.I.). (C) Confocal images displaying NFAT1 localization in isolated OT-I nuclei compared with whole cells after 30 min of stimulation with or without 1 μg/ml ionomycin.
