. 2018 Aug 28;7:e37078. doi: 10.7554/eLife.37078

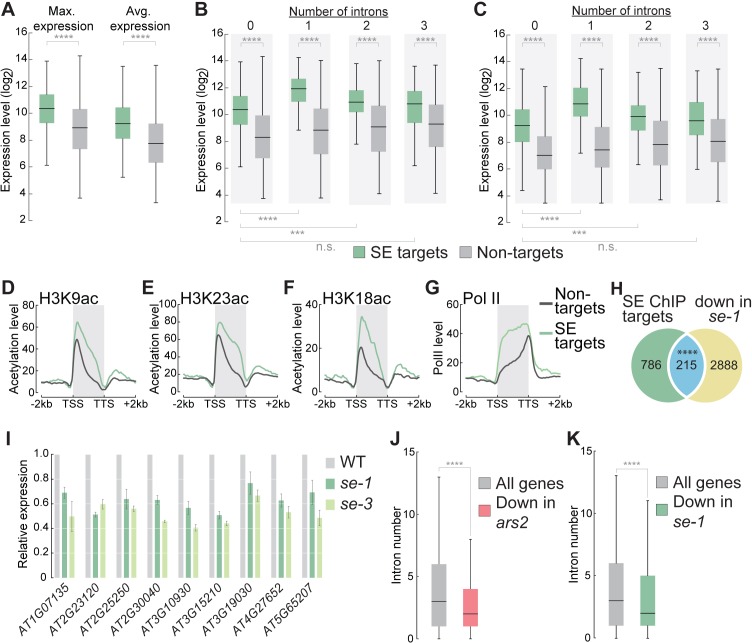
Figure 2. SE association to intronless genes indicates and maintains high gene expression levels.

(A) Box plots showing the maximum and average gene expression of SE targets and non-targets across different Arabidopsis tissues and developmental stages (described in Laubinger et al., 2008). (Wilcoxon-Mann-Whitney test, ****p<0.0001) (B,C) Box plots showing the maximum (B) and average (C) gene expression of intronless and intron-containing SE targets and non-targets across different Arabidopsis tissues and developmental stages (described in Laubinger et al., 2008). (Wilcoxon-Mann-Whitney test, ***p<0.001; ****p<0.0001; n.s., not significant) (D–G) Profiles of histone H3K9, (B) H3K18 (C) and H3K23 (D) acetylation and pol II (D) levels over SE target genes and non-target genes. (H) Venn diagram showing the overlap between SE-ChIP targets and genes that are significantly down-regulated in se-1 mutants (hypergeometric test, ****p<0.0001). (I) Quantification of indicated RNA transcript level determined by qPCR in WT, se-1 and se-3 mutants. Error bars indicate mean ± SEM of three biological replicates. (J,K) Box plots depicting the number introns of all Drosophila melanogaster (J) and Arabidopsis thaliana (K) genes and genes whose expression is significantly down-regulated (to < 50%) in ars2 (J) and se-1 (K) mutants. (Wilcoxon-Mann-Whitney test, ****p<0.0001).

Figure 2.

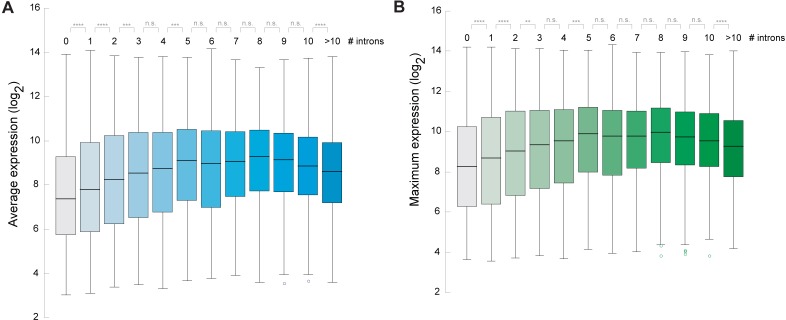
Figure 2—figure supplement 1. Arabidopsis genes containing introns are expressed at higher levels.

Figure 2—figure supplement 1.

(A, B) Box blots showing the correlation between number of introns and the average gene expression level (A) or the maximum gene expression level (B) across a wide range of different growth stages and tissues of Arabidopsis. Gene expression data was obtained from Laubinger et al. (2008). A Wilcoxon-Mann-Whitney test was performed to test for difference between the different categories. *p<0.05; **p<0.01; ***p<0.001; ****p<0.0001; NS not significant.
Figure 2—figure supplement 2. Stress-regulated genes contain fewer introns in diverse plant species.

Figure 2—figure supplement 2.

(A–D) Box blots showing the number of introns per genes which are upregulated upon different kind of stress treatment in comparison to all genes. A) Arabidopsis plants were treated for 12 hr with salt, cold, osmotic or heat stress (B). Rice plants were treated for treated for 1 hr with cold or osmotic stress. (C) Soy plants were treated for treated for 1 hr with salt or dehydration stress. (D) Maize plants were treated for treated for 1 hr with salt or cold stress. Details on the used data sets are provided in ‘Material and methods’. Wilcoxon-Mann-Whitney test; *p<0.05; **p<0.01; ***p<0.001; ****p<0.0001; NS not significant.
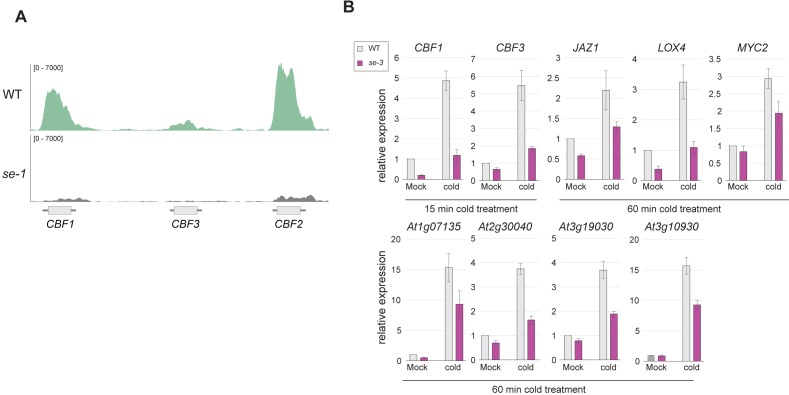
Figure 2—figure supplement 3. SE binds and affects the expression strength of CBF genes.

Figure 2—figure supplement 3.

(A) Visualization of SE ChIP-seq data in WT and se-1. Tracks showing read counts of sequencing reads mapped to the CBF1/2/3 locus. (B) Quantification of indicated RNA transcript level by qPCR in WT and se-3 mutants after 15 or 60 min of cold stress or mock treatment treatment. Error bars denote the standard error of 3 biological replicates.