Abstract
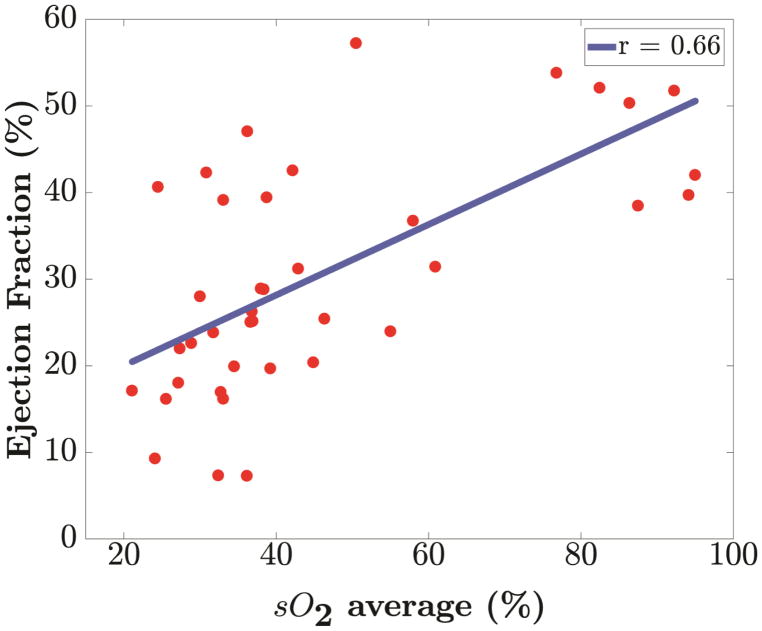
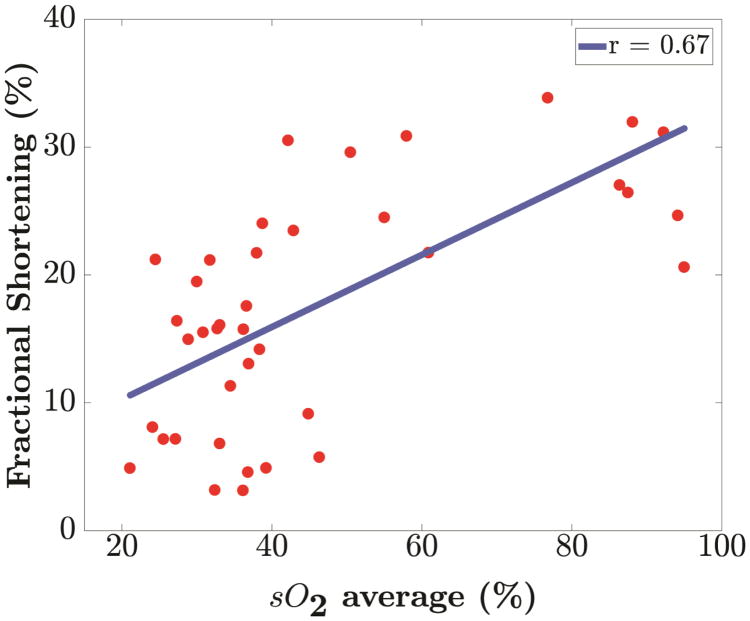
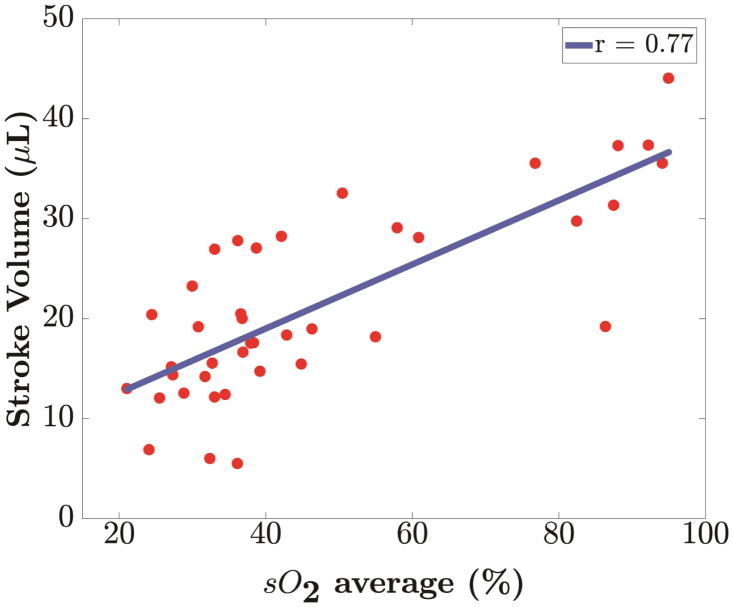
Photoacoustic imaging (PAI) is an evolving real-time imaging modality that combines the higher contrast of optical imaging with the higher spatial resolution of ultrasound imaging. In this paper we utilize dual-wavelength PAI for the diagnosis and monitoring of myocardial ischemia by assessing variations in blood oxygen saturation (% sO2) estimated in a murine model. The use of high frequency ultrasound in conjunction with PAI enabled imaging anatomical and functional changes associated with ischemia. Myocardial ischemia was established in eight mice by ligating the left anterior descending artery (LAD). Longitudinal results reveal that PAI is sensitive to acute myocardial ischemia, with a rapid decline in blood oxygen saturation (p <0.001) observed after LAD ligation (30 min: 33.05% ± 6.80; 80 min: 36.59% ± 5.22; 120 min: 36.70% ± 9.46; 24 h: 40.55% ± 13.04) when compared to baseline (87.83% ± 5.73). Variation of % sO2 is found to be linearly correlated with ejection fraction (%), fractional shortening (%) and stroke volume (μL) with Pearson’s correlation coefficient values of 0.66, 0.67 and 0.77 respectively (p <0.001). Our results demonstrate that PAI has the potential for real time diagnosis and monitoring of acute myocardial ischemia.
Keywords: Photoacoustic Imaging, High-Frequency Ultrasound, Myocardial Ischemia, Murine Model
Introduction
Coronary heart disease including myocardial infarction (MI) is one of leading causes of mortality accounting for 1 in 7 deaths in the US with over 360,000 fatalities each year (Benjamin et al. 2017). MI results from necrosis of heart cells, typically caused by ischemia; a diminished supply of blood which causes hypoxia in cardiac muscle cells (Thygesen et al. 2007). Conventional diagnostic tools for MI includes electrocardiography (ECG), laboratory tests such as assays of creatine kinase MB (CK-MB) and non-invasive imaging such as echocardiography (Bolooki and Askari 2010). However, ECG is not always specific to the extent of ischemia and assays of CK-MB may take up to 12 hours ruling out the possibility of real time diagnosis and treatment of acute MI (Puleo et al. 1994).
Non-invasive imaging methods include clinical echocardiography (Eaton et al. 1979; Pfeffer et al. 1979; Kanno et al. 2002), tissue Doppler, and myocardial strain imaging (Konofagou et al. 2002; Varghese et al. 2003; Bauer et al. 2011; Bhan et al. 2014; Ma et al. 2016). These methods assess cardiac performance by tracking structural changes in heart muscle movement after MI but do not provide specific information regarding perfusion of cardiac muscle which might be more definitive in indicating the extent of ischemia. Position emission tomography (PET) and contrast enhanced magnetic resonance imaging (MRI) have also been used to obtain 3D mapping of perfusion (Schwaiger and Muzik 1991; Kober et al. 2005; Wiemer et al. 2009). However, these methods do not function in real-time, are time intensive and expensive. Myocardial contrast echocardiography (MCE) has been used to evaluate myocardial perfusion and identify perfusion defects in ischemia models (Gao et al. 2011). MCE involves intravenous injection of contrast agents (micro bubbles) to enhance the myocardial B-mode image (Gao et al. 2011). However, performing MCE in a small animal model with a rapidly beating heart is quite demanding both in terms of surgical procedures and image acquisition with a high resolution scanner (French et al. 2006).
Photoacoustic imaging (PAI) is an evolving real-time biomedical imaging modality that combines optical imaging contrast with ultrasonic spatial resolution (Xu and Wang 2006; Hu and Wang 2010; Su et al. 2010; Beard 2011; Mallidi et al. 2011; Wang and Hu 2012). PAI illuminates tissue with short pulses of electromagnetic radiation typically ranging from 700–900 nm (Needles et al. 2013; Rich and Seshadri 2016). Light energy is selectively absorbed by endogenous chromophores present in tissue resulting in rapid thermo-elastic expansion (Xu and Wang 2006; Su et al. 2010; Beard 2011; Wang and Hu 2012; Rich and Seshadri 2016). This thermo-elastic expansion generates broadband acoustic waves which are detected using ultrasound transducers (Needles et al. 2013). Photoacoustic (PA) images provide anatomical information with ultrasound imaging coupled with tissue specific information such as oxygen saturation via the optical absorption contrast.
In recent years, efforts have concentrated on in-vivo quantitative imaging by capitalizing on the absorption spectra of endogenous contrast agents such as hemoglobin (Xu and Wang 2006; Wang and Hu 2012), leading to use of dual-wavelength PA to estimate blood oxygen saturation (% sO2). Differing absorption spectra of oxyhemoglobin (HbO2) and deoxyhemoglobin (HHb) enables quantification of blood oxygenation with this approach (Beard 2011). Literature reports have described the use of % sO2 to depict organ microvasculature (Beard 2011; Mallidi et al. 2011; Yao et al. 2011; Laufer et al. 2012; Wang and Hu 2012) and hypoxia (Gerling et al. 2014; Rich and Seshadri 2016; Arthuis et al. 2017) in real time. Dual-wavelength will enable studying myocardial perfusion changes without requiring any exogenous contrast agent when compared to MCE. Real-time PAI and its sensitivity to blood oxygenation levels coupled with the recent development of PA integrated micro-ultrasound systems (Needles et al. 2013) make it suitable for diagnosis and monitoring of myocardial ischemia in-vivo. Initial reports of PAI for murine cardiovascular dynamics was reported in (Zemp et al. 2008). They utilized a 30-MHz linear array to image the beating heart of athymic nude mice at ~50 frames per second. Li et al. (2011) tried to establish a correlation between the extent of myocardial ischemia and variation of PA signal intensity in rats submerged in water under tracheal intubation, on a section of the left ventricular wall. They used a wavelength of 532 nm and a single element transducer with center frequency of 3.5 MHz for reception (Li et al. 2011). They reported an exponential decay in the PA signal intensity with time after left anterior descending (LAD) artery occlusion.
In this paper, we use a commercially available PA imaging system for the diagnosis and monitoring of myocardial ischemia in murine models. Dual-wavelength PAI was utilized to generate parametric maps of blood oxygen saturation, % sO2 that were overlaid on high resolution high-frequency ultrasound images of the myocardium. PAI is shown to be sensitive to changes in myocardial oxygenation associated with acute myocardial ischemia.
Materials and Methods
Animal Models
Ten 10–12 weeks old male BALB/CJ mice obtained from Jackson Labs (ME, USA) were studied using PAI and high frequency ultrasound (HFUS) imaging. Myocardial ischemia was established in each murine model using the procedure described below. All in vivo procedures were performed under an approved protocol by the Institutional Animal Care and Use Committee (IACUC) at the University of Wisconsin-Madison.
Murine model of Myocardial Ischemia
Following induction of isoflurane anesthesia (3%), the mouse was intubated with an 18-gauge catheter and placed on a ventilator at 120–130 breaths per minute with a stroke volume of 150 μL and maintained on 2% isoflurane. A left lateral incision through the fourth intercostal space was made to expose the heart. After visualizing the left coronary artery, a 7–0 clear prolene suture was placed through the myocardium in the anterolateral wall and secured (Kumar et al. 2005; Singla et al. 2006). Coronary artery entrapment was confirmed by observing blanching of the distal circulation (ventricular apex) and ECG changes indicative of myocardial ischemia. The lungs were over inflated and the ribs and muscle layers were closed by absorbable sutures. The skin was closed by additional suturing using 6–0 clear nylon or silk sutures. The mouse was then recovered from anesthesia and extubated.
Photoacoustic (PA) and High-frequency Ultrasound Imaging
Longitudinal variations of perfusion and cardiac function of the heart after ischemia, was evaluated using PA and HFUS. Imaging sessions were performed before LAD ligation (baseline) and at 30 minutes, 80 minutes, 120 minutes and 24 hours after LAD ligation. The objective of imaging after LAD ligation (from 30 minutes to 24 hours) was to study the ability of PAI in the early detection of ischemia in the ventricular wall. All imaging was performed using a Vevo LAZR imaging system (FUJIFILM VisualSonics, Inc., Toronto, Canada). During imaging sessions, mice were anesthetized using 1.5 % isoflurane and a constant flow of oxygen was maintained. Hair was removed from the chest region using depilatory cream to ensure better transmission of light energy. Mice were placed supine on a heated imaging platform for imaging with continuous monitoring of physiological parameters.
2-D PAI was performed in “Oxy-Hemo” mode to obtain parametric maps of oxygen saturation (% sO2) and hemoglobin (Hbt) concentration in the anterior myocardium. In this mode, an automated imaging sequence is used to perform dual-wavelength PAI at 750 and 850 nm. Parametric maps of % sO2 and Hbt are then generated using the algorithm reported in (Laufer et al. 2005; Wang et al. 2006; Needles et al. 2013), implemented on the system. Mice hearts were imaged in a parasternal long axis (PSLAX) view using a LZ 400 transducer (FUJIFILM VisualSonics, Inc., Toronto, Canada) with broadband frequency range from 18 – 38 MHz and operating at a center frequency of 30 MHz. The imaging parameters used for PAI are presented in Table 1.
Table 1.
PAI presets
| Imaging Parameter | Set Value |
|---|---|
| PA Gain | 52 dB 2D |
| Gain | 27 dB |
| Image Width | 10.36 mm |
| Image Depth | 15.00 mm |
| Image Depth Offset | 2.00 mm |
| Focus Depth | 10.00 mm |
| Persistence | 10 |
| Correct Energy | On |
| Threshold HbT | 20 % |
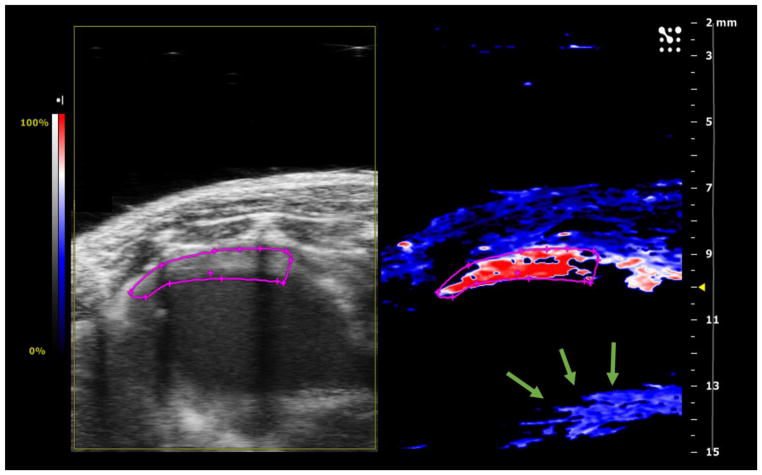
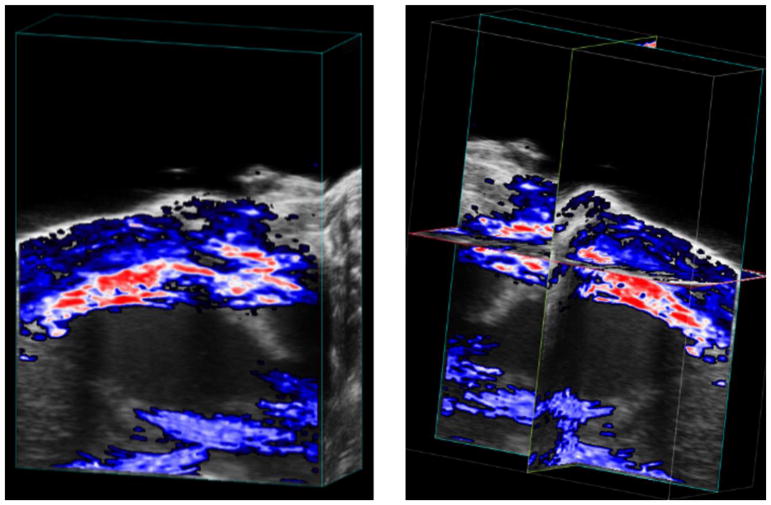
A large amount of centrifuged acoustic gel was applied on the chest and in the transducer cavity to ensure that no air bubbles were present in the imaging plane. This precaution was taken in order to avoid reverberation artifacts which can interfere with PA images. Special attention was also paid to keeping the heart in the imaging plane such that the anterior myocardium lies within a depth of 9–11 mm where laser energy is focused. The transducer was also placed horizontally keeping the skin surface at a depth of 7.5 mm or higher to avoid any reverberation artifacts from the skin whenever possible. Manual time gain compensation (TGC) was applied to improve the signal to noise ratio at this depth setting and to compensate for the attenuation of light as its energy drops with depth in the tissue. The imaging parameters were optimized by experimenting on two mice models in the group and then saved as a preset in the scanner for the remainder of the animal models. Figure 1 presents a representative Oxy-Hemo PA image of the mouse heart using the above-mentioned preset. Note that our study focused only on the anterior myocardium, since most of the light energy is absorbed here leaving very little energy for posterior myocardium to generate any reasonable PA estimates which is also evident from Figure 1. 3-D PAI was then performed using the acquisition motor with a scanning range of 6 mm and step size of 0.16 mm resulting in 37 2-D slices/volume. Persistence (frame averaging) of 10 was also maintained during 3-D PA acquisition. Figure 2 illustrates a representative case of 3-D Oxy-Hemo PA image.
Figure 1.
Representative Oxy-Hemo Photoacoustic (PA) Image of Mice Heart at baseline (before LAD ligation). Left panel shows the ultrasound image while right panel shows the corresponding Oxy-Hemo PA image. The region outlined in pink represents the region of interest (ROI). The anterior myocardium is placed within a depth range of 9–11 mm with the skin surface at 7 mm maintained parallel to the transducer face. The reverberation artifact (indicated by green arrows) is seen at a depth of 13–14 mm caused due to the PA signal being reflected between the skin layer and transducer face. High oxygen saturation (% sO2) (in red) is visible in the anterior myocardium within the ROI. No estimates are obtained in posterior myocardium (black region in the Oxy-Hemo Image).
Figure 2.
Representative 3-D Oxy-Hemo PA Image of Mice Heart at baseline (before LAD ligation). Left panel shows the cube-view representation of %sO2 average estimates overlaid on ultrasound images while the right panel presents an orthogonal representation of the same heart.
HFUS was performed using two transducers - MS 550D (broadband frequency range of 22 – 55 MHz) operating at center frequency of 40 MHz and LZ 400 transducer (broadband frequency range of 18 – 38 MHz) operating at center frequency of 30 MHz. 2-D B-mode images were collected in both PSLAX and short axis (PSAX) views using MS 550D while LZ 400 was used to collect only PSLAX views. Image width, depth, gain and TGC were adjusted carefully to optimize image quality by maximizing the signal-to-noise ratio and adjusting for the attenuation of light with depth. A 235 Hz frame rate was maintained over all ultrasound only imaging sessions. This frame rate ensured optimal temporal resolution and captured the motion of the rapidly beating mouse heart without distortion which is critical in performing 2-D echocardiographic measurements. Cine loops containing 1000 frames per imaging plane were stored digitally for further analysis.
3-D imaging was performed along the parasternal long axis view using the acquisition motor by translating the transducer perpendicular to the long axis imaging orientation. For all mice, scanning range of 5 mm with step size of 0.14 mm was maintained resulting in 36 2-D slices/volume.
Photoacoustic (PA) Image Analysis
Quantitative analysis of Oxy-Hemo PA images were performed offline using VevoLab Software commercially available with Vevo LAZR imaging system. For each imaging session, an average of 20 frames per cine loop of Oxy-Hemo data were collected and digitally stored. Given that frame averaging was used while acquiring OxyHemo images (average of 10 frames per wavelength), each frame represents an average of % sO2 values throughout multiple cardiac cycles. The system is therefore not sensitive enough to detect variation of % sO2 over one cardiac cycle. However, in this work, our main focus was to detect the general trend in the variation of % sO2 after induction of LAD ligation which is still measurable using the frame averaging scheme. Even with persistence of 10, we experienced signal dropouts in some of the collected frames. Therefore, a single frame with reasonable amount of % sO2 estimate was chosen for analysis. A ROI was delineated manually in the anterior myocardium based on the anatomical ultrasound images. Delineated ROI encompassed the entire myocardium and sometimes a thin portion of ventricular chamber adjacent to endocardium. Both the OxyZated™ and HemoMeaZure™ tool were utilized to quantify oxygen saturation (% sO2) and total hemoglobin (Hbt) respectively within the ROI. The software reports two measures of oxygen saturation, namely % sO2 Average and % sO2 Total. Values of % sO2 Total calculates the average oxygen saturation in all pixels including those with a zero/void estimate within the ROI while % sO2 Average calculates the average oxygen saturation within the ROI after excluding the zero/void estimates (Rich and Seshadri 2016). After LAD ligation we sometimes observe loss of PA signal in the ROI due to presence of a suture in the path of light transmission. This also resulted in higher numbers of zero/void estimates within ROI than for the baseline case which could introduce a small bias in the longitudinal study. To avoid this issue, % sO2 Average was chosen as the measure of oxygen saturation in our study. The percent change of oxygen saturation (% sO2 Average) between baseline and post-LAD ligation cases were calculated using the following formula:
| (1) |
Quantitative results from VevoLab software were exported to excel files for statistical analysis using MATLAB (The MathWorks, Inc., Natick, MA, USA).
Two-Dimensional Echocardiographic Measurements
Conventional echocardiographic measurements were derived from both grayscale B-mode and M-mode images acquired along the PSLAX views. PSLAX cardiac measurement protocol for VevoLab software was utilized for performing the measurement of left ventricular (LV) ejection fraction (% EF), fractional shortening (% FS) and stroke volume (SV μL). EF and SV were derived from PSLAX B-mode images obtained using LZ550D transducer. For performing the measurements, endocardial wall was delineated at end diastole and end systole of a cardiac cycle. Software then automatically traces out the intermediate frames and calculates the left ventricle volume diastole (LVvol;d) and left ventricle volume systole (LVvol;s). Finally, EF (%) was calculated as while SV (μL) was calculated as SV (μL) = LVvol;d − LVvol;s.
M-mode PSLAX images were used to derive the measure of FS using LZ400 transducer. A section of the cine loop without breathing motion artifacts was chosen for analysis. LV trace tool was used to delineate the left ventricular anterior wall (LVAW) and posterior wall (LVPW). Based on the delineation, the software automatically calculates the end diastolic diameter (LVEDD) and end systolic diameter (LVESD). Finally, FS (%) was calculated as .
These measurements provide anatomical information about the heart after induction of myocardial ischemia. Quantitative results from VevoLab software were exported to excel files for statistical analysis using MATLAB.
Statistical Analysis
All data are represented as mean ± standard deviation. One-way analysis of variance (ANOVA) with Tukey-Kramer post hoc test was performed for the five observation time points (Baseline, 30 minutes, 80 minutes, 120 minutes and 24 hours) to determine the statistical difference between observations. A p <0.05 was considered statistically significant. Correlation obtained using linear regression and Pearson correlation coefficient (r-value) was reported. All statistical analysis was performed using MATLAB (Statistics and Machine Learning Toolbox Release 2017b, The MathWorks, Inc., Natick, Massachusetts, United States).
Results
In this study, we used a commercially available PA imaging system for monitoring myocardial ischemia in a murine model of ischemia. The main results of the study are visualization and quantification of alterations in oxygen saturation levels post LAD ligation using dual-wavelength PA imaging. The variation in the % sO2 Average also exhibits a positive linear relationship with conventional echocardiographic measurements.
Detection of alterations in oxygenation level in anterior myocardium after LAD ligation
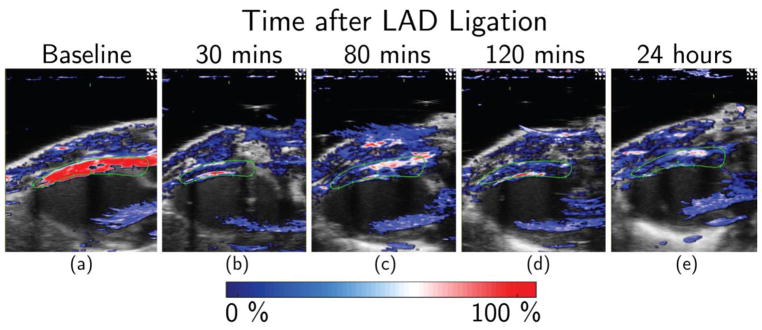
Representative PA images of myocardial ischemia are presented in Figure 3. Figure 3(a) shows baseline PA image with very high oxygen saturation (dark red) in the anterior myocardium indicating high perfusion. Figure 3(b) – (e) illustrates the oxygen saturation levels at 30 minutes, 80 minutes, 120 minutes and 24 hours after LAD ligation. Qualitative observations indicate a reduction of % sO2 level shown in blue in the PA-US co-registered images. We also observed a decrease in the total colored area in post-surgery cases when compared to the baseline indicating lower % sO2 level in the anterior myocardium.
Figure 3.
Dual-wavelength in-vivo PA monitoring of acute myocardial ischemia. Representative Oxy-Hemo PA images at (a) baseline, (b) 30 minutes, (c) 80 minutes, (d) 120 minutes and (e) 24 hours after LAD ligation. The heat map represents % sO2 levels ranging from 0% (dark blue) to 100% (dark red). ROI in the anterior myocardium is shown in green. Figure (b) and (d) represents images where a thin sliver of the ventricular chamber could have been included in chosen ROI for analysis (red line right against the inside of the anterior myocardium).
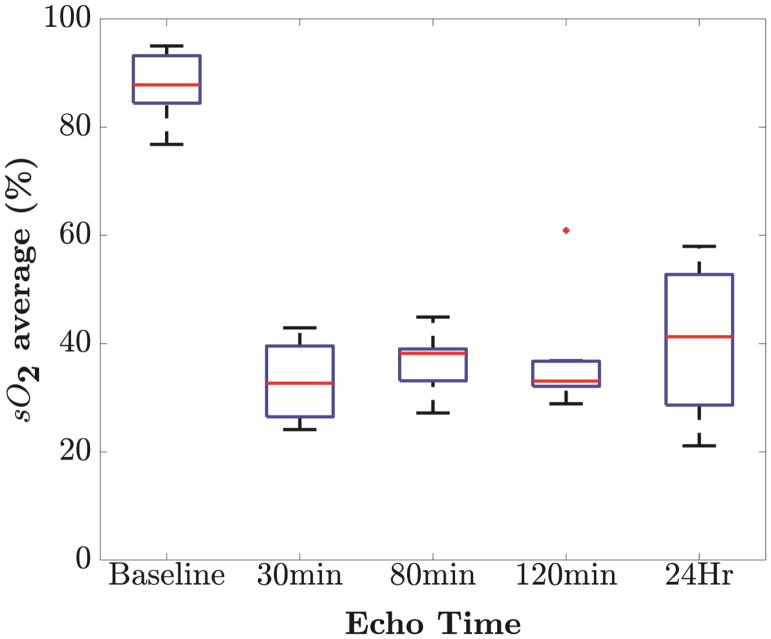
To obtain statistically significant results, the experiment was repeated over seven additional mice. All mice experienced similar rapid decreases in blood oxygen saturation (% sO2) starting at 30 minutes after LAD ligation with p <0.001. One-way ANOVA with Tukey-Kramer post hoc test indicate statistical difference of blood oxygen saturation (% sO2) at baseline compared to post ligation time points (p <0.001). There was no statistically significant difference of % sO2 level among post ligation observations compared to each other. Figure 4 shows the box-and-whisker plots of blood oxygen saturation (% sO2) at five time points of observation. The plot illustrates that % sO2 level at 30, 80, 120 minutes and 24 hours are close to each other and lower than baseline % sO2 level. One outlier is observed at 120 minute’s which can be attributed to the physiological variability among the mice. Highest variability is observed at 24 hours which might be caused by the variation in response to ischemia among mice. Even then, the oxygenation level after 24 hours remained significantly lower than the baseline (p <0.001) showing the effect of permanent ligation on anterior myocardium. In general, LAD ligation was associated with significant decrease (p <0.001) in blood oxygen saturation (% sO2) post-LAD ligation (30 min: 33.05% ± 6.80; 80 min: 36.59% ± 5.22; 120 min: 36.70% ± 9.46; 24 h: 40.55% ± 13.04) when compared to baseline (87.83% ± 5.73). This reduction of oxygenation level is a clear suggestion of ischemia revealing the sensitivity of PAI for real time monitoring.
Figure 4.
Variation in blood oxygen saturation levels (% sO2) over time. Box-and-whisker plots of blood oxygen saturation (% sO2) at five time points of observation (at baseline, 30 minutes, 80 minutes, 120 minutes and 24 hours). Box-and-whisker plot present min and max values (whiskers), and the 25th and 75th percentile (box), finite outlier (red plus) and median % sO2 level. The trend indicates rapid fall from baseline to 30 minutes with a 62.97% reduction.
Relationship between variation of % sO2 Average and echocardiographic measurements
To obtain a relationship between cardiac perfusion and cardiac structural changes, PA in vivo oxygen saturation measurements were correlated with % EF, % FS and SV μL derived from 2-D echocardiographic measurements. It has been reported previously that myocardial infarction in mice models were associated with declines in EF, FS and SV with time after ligation (Patten et al. 1998; Gao et al. 2000; Kanno et al. 2002; Yang et al. 2002; Bauer et al. 2011). Our results corroborate these previous reports revealing declines in % EF, % FS and SV μL over time. Table 2 summarizes results obtained from echocardiographic measurements. Statistically significant difference was observed in post-ligation cases compared to baseline (p<0.001).
Table 2.
Conventional echocardiographic measurements over monitoring period
| Measurement | Baseline | 30 min | 80 min | 120 min | 24 Hours | p < |
|---|---|---|---|---|---|---|
| % EF | 48.05±6.47 | 26.04±11.16 | 28.76±9.45 | 23.95±8.88 | 28.15±14.92 | 0.001 |
| % FS | 29.05±4.98 | 15.65±7.39 | 14.53±6.55 | 13.24±6.91 | 16.95±10.55 | 0.001 |
| SV (μL) | 33.73±6.81 | 15.99±5.92 | 19.79±5.05 | 17.52±7.18 | 19.12±8.04 | 0.001 |
Correlation analysis of % sO2 was performed with EF, FS and SV to understand the relationship between functional and perfusion changes associated with myocardial ischemia. Our analysis reveals a positive linear (p <0.001) relationship of blood oxygen saturation with each of the conventional echocardiographic measurements as shown in Figure 5. In Table 3, we present the Pearson correlation coefficient (r) along with the corresponding p-values for blood oxygen saturation with EF, FS and SV respectively for all mice.
Figure 5.
Linear regression of blood oxygenation, % sO2 against parameters from 2-D echocardiography measurements. Positive correlation of blood oxygenation (% sO2) with (a) Ejection Fraction (r=0.66), (b) Fractional Shortening (r=0.67) and (c) Stroke Volume (r=0.77) was found. All relationships have a p value less than 0.001.
Table 3.
Correlation of blood oxygen saturation with EF, FS and SV.
| Parameters | Baseline – Day 1 | |
|---|---|---|
|
| ||
| r value | p value < | |
| Ejection Fraction (%) | 0.66 | 0.001 |
| Fractional Shortening (%) | 0.67 | 0.001 |
| Stroke Volume (μL) | 0.77 | 0.001 |
Discussion
Our results indicate that cardiac dysfunction associated with myocardial ischemia in a murine model can be detected using PAI. In Figure 4, we show that blood oxygen saturation decreases over time when compared to baseline measurements (p <0.001). We consider this alteration of % sO2 being indicative of myocardial ischemia. PAI contrast is “absorption-based” because the PA signal can be considered to be proportional to optical absorption properties of tissue (Beard 2011). In dual-wavelength PAI, the absorption spectral difference between oxyhemoglobin (HbO2) and deoxyhemoglobin (HHb) is utilized to generate estimates of relative blood oxygen saturation, % sO2. In particular, equation (2) is utilized in the Vevo 2100 LAZR imaging system to estimate blood oxygen saturation of blood (Needles et al. 2013).
| (2) |
where [HbO2] and [HHb] are the molar concentrations of oxyhemoglobin and deoxyhemoglobin respectively, Aλ is the PA signal intensity at wavelength λ, εHHb and εHbO2 are molar extinction coefficient of deoxyhemoglobin and oxyhemoglobin respectively, ΔεHHb = εHbO2 − εHHb. In cardiac muscle, PAI contrast can be attributed to oxygenated hemoglobin present in blood perfused into the anterior myocardium. At baseline, the continuous flow of arterial blood contributed to the PAI contrast with high oxygen saturation values in the PA image. In our experimental setup, a permanent LAD ligation was performed to restrict the flow of arterial blood into the myocardium. We then observed a significant decline in % sO2 from baseline measurements after ligation at the 30 minute time step. The decline in % sO2 can be caused either by a decrease in arterial blood with rich oxygenation affecting the HbO2 term or by possible pooling of venous blood affecting the HHb term in equation (2). In the current setup, it is difficult to state with specificity the exact contributing factor to the % sO2 decline. We hypothesize that the major contributor is reduced arterial blood flow as LAD ligation was performed in these mice.
In this study, we present observations from baseline to 24 hours post-LAD ligation to image changes in perfusion of the heart at possible initial stages of myocardial infarction. Acute ischemic insult of heart shortly following the beginning of MI is well reported in literature (Swan et al. 1972; Weber et al. 1978; Pfeffer et al. 1979). Our results indicate that PAI is able to track a rapid fall in the oxygenation due to LAD ligation which could lead to an MI. The accuracy of measuring real tissue oxygen saturation has been previously reported in phantom studies (Rich and Seshadri 2014; Yamaleyeva et al. 2017). These studies support the use of PAI for detection of oxygen saturation changes associated with acute myocardial ischemia with LAD ligation. At 30 minutes post ligation, a 62.37% decrease in % sO2 was observed when compared to baseline measurements. This preliminary study provides us with possible future directions to assess chronic changes associated with MI through the use of PAI.
A persistence of 10 (frame averaging) was utilized to generate reasonable % sO2 estimates as the estimation of % sO2 using multi-wavelength imaging is very prone to system noise. This persistence setting generates the % sO2 estimate in one frame by taking average of 10 frames per wavelength (in this case 750 nm and 850 nm). Thus, each acquired frame represents an average of % sO2 values throughout multiple cardiac cycles. This results in reduced sensitivity in detecting subtle variation of % sO2 over a single cardiac cycle and limits us to detect less severe ischemic events. However, in this work, our main focus was to detect the general trend in the variation of % sO2 after induction of permanent LAD ligation which is still measurable using the frame averaging scheme. One possible solution is to have an ECG gated method for acquiring PA images. This would greatly improve accuracy and precision of the measurements and potentially make this much more sensitive to assessing less severe ischemic events.
Change of % EF, % FS and SV (μL) are indicative of left ventricular dysfunction after MI. We have shown statistically significant positive linear correlation (p <0.001) of tissue oxygenation with EF, FS and SV in this study. This linear relationship substantiates our claim that dual-wavelength PAI has potential to be a real-time monitoring tool for myocardial ischemia. While performing PAI, we were cautious to ensure that no bubbles are present in the images to avoid bubble related artifacts. Presence of bubbles causes unreliable tissue oxygenation estimates and in some case may corrupt information inside the ROI where analysis is performed. We recommend application of large amount of centrifuged gel to overcome these artifacts. Another key challenge in PAI imaging are reverberation artifacts appearing at a depth twice that of the skin surface. General recommendation is to use higher standoff to push the artifact out of the field of view. In our work, the skin surface was placed at depth of around 7.5 mm to avoid reverberation artifacts. Even after using clear sutures in our study, we sometimes observe a significant loss of PA signal. Although light propagated through the suture without interference, we suspect the suture was actually blocking the light induced ultrasound signal. Therefore, care should be taken to avoid possible suture locations while imaging the myocardium which can be quite challenging.
Limitations with use of PAI for studying myocardial dynamics include the following; first, the VisualSonics system performs Oxy-Hemo imaging with a frame rate of 5 Hz resulting in lower temporal resolution when compared to conventional echocardiography. Thus, it may not be possible to accurately time-register PA signals with ECG events in the heart. Secondly, in our study we focused on the anterior myocardium as most of light energy is absorbed in this region. This imposed a fundamental limit on the penetration depth achievable using PAI. Resolving these issues will further enhance the potential of PAI for routine cardiovascular assessment.
Conclusion
We demonstrate the use of photoacoustic imaging (PAI) for the real-time assessment of myocardial dynamics in a murine model of myocardial ischemia. Combined high-frequency ultrasound and PAI enabled imaging of both functional and perfusion changes associated with acute myocardial ischemia. A rapid decline in blood oxygenation was observed 30 minutes post-LAD ligation when compared to the baseline, indicating an ischemic state of the heart muscle. Correlation analysis indicates that tissue oxygenation is positively correlated (p<0.001) with ejection fraction, fractional shortening and stroke volume with r values of 0.66, 0.67 and 0.77 respectively. Thus, perfusion changes derived from PAI complement findings from conventional echocardiography. This study opens new avenues for further exploration of PAI in studying both acute and chronic changes in cardiovascular dynamics and treatment monitoring for cardiac tissue repair.
Acknowledgments
The Vevo 2100 and LAZR system was acquired using NIH grant S10 OD018505. We gratefully acknowledge funding support from the UW Carbone Cancer Center grant P30 CA014520 and UW School of Medicine and Public Health (SMPH) for the ultrasound small animal imaging and analysis facility. Funding from NIH grant R01-CA112192 is also acknowledged.
Supported by NIH grant S10 OD018505 and R01-CA112192.
Footnotes
Publisher's Disclaimer: This is a PDF file of an unedited manuscript that has been accepted for publication. As a service to our customers we are providing this early version of the manuscript. The manuscript will undergo copyediting, typesetting, and review of the resulting proof before it is published in its final citable form. Please note that during the production process errors may be discovered which could affect the content, and all legal disclaimers that apply to the journal pertain.
References
- Arthuis CJ, Novell A, Raes F, Escoffre J-M, Lerondel S, Le Pape A, Bouakaz A, Perrotin F. Real-Time Monitoring of Placental Oxygenation during Maternal Hypoxia and Hyperoxygenation Using Photoacoustic Imaging. PloS one. 2017;12:e0169850. doi: 10.1371/journal.pone.0169850. [DOI] [PMC free article] [PubMed] [Google Scholar]
- Bauer M, Cheng S, Jain M, Ngoy S, Theodoropoulos C, Trujillo A, Lin F-C, Liao R. Echocardiographic Speckle-Tracking Based Strain Imaging for Rapid Cardiovascular Phenotyping in MiceNovelty and Significance. Circulation research. 2011;108:908–16. doi: 10.1161/CIRCRESAHA.110.239574. [DOI] [PMC free article] [PubMed] [Google Scholar]
- Beard P. Biomedical photoacoustic imaging. Interface focus. 2011:rsfs20110028. doi: 10.1098/rsfs.2011.0028. [DOI] [PMC free article] [PubMed] [Google Scholar]
- Benjamin EJ, Blaha MJ, Chiuve SE, Cushman M, Das SR, Deo R, de Ferranti SD, Floyd J, Fornage M, Gillespie C. Heart disease and stroke statistics—2017 update: a report from the American Heart Association. Circulation. 2017;135:e146–e603. doi: 10.1161/CIR.0000000000000485. [DOI] [PMC free article] [PubMed] [Google Scholar]
- Bhan A, Sirker A, Zhang J, Protti A, Catibog N, Driver W, Botnar R, Monaghan MJ, Shah AM. High-frequency speckle tracking echocardiography in the assessment of left ventricular function and remodeling after murine myocardial infarction. American Journal of Physiology-Heart and Circulatory Physiology. 2014;306:H1371–H83. doi: 10.1152/ajpheart.00553.2013. [DOI] [PMC free article] [PubMed] [Google Scholar]
- Bolooki HM, Askari A. Acute myocardial infarction. Disease Manag Proj. 2010 [Google Scholar]
- Eaton LW, Weiss JL, Bulkley BH, Garrison JB, Weisfeldt ML. Regional cardiac dilatation after acute myocardial infarction: recognition by two-dimensional echocardiography. New England Journal of Medicine. 1979;300:57–62. doi: 10.1056/NEJM197901113000202. [DOI] [PubMed] [Google Scholar]
- French BA, Li Y, Klibanov AL, Yang Z, Hossack JA. 3D perfusion mapping in post-infarct mice using myocardial contrast echocardiography. Ultrasound in Medicine and Biology. 2006;32:805–15. doi: 10.1016/j.ultrasmedbio.2006.03.002. [DOI] [PubMed] [Google Scholar]
- Gao S, Ho D, Vatner DE, Vatner SF. Echocardiography in mice. Current protocols in mouse biology. 2011:71–83. doi: 10.1002/9780470942390.mo100130. [DOI] [PMC free article] [PubMed] [Google Scholar]
- Gao X-M, Dart AM, Dewar E, Jennings G, Du X-J. Serial echocardiographic assessment of left ventricular dimensions and function after myocardial infarction in mice. Cardiovascular research. 2000;45:330–8. doi: 10.1016/s0008-6363(99)00274-6. [DOI] [PubMed] [Google Scholar]
- Gerling M, Zhao Y, Nania S, Norberg KJ, Verbeke CS, Englert B, Kuiper RV, Bergström Å, Hassan M, Neesse A. Real-time assessment of tissue hypoxia in vivo with combined photoacoustics and high-frequency ultrasound. Theranostics. 2014;4:604. doi: 10.7150/thno.7996. [DOI] [PMC free article] [PubMed] [Google Scholar]
- Hu S, Wang LV. Photoacoustic imaging and characterization of the microvasculature. Journal of biomedical optics. 2010;15:011101–15. doi: 10.1117/1.3281673. [DOI] [PMC free article] [PubMed] [Google Scholar]
- Kanno S, Lerner DL, Schuessler RB, Betsuyaku T, Yamada KA, Saffitz JE, Kovacs A. Echocardiographic evaluation of ventricular remodeling in a mouse model of myocardial infarction. Journal of the american society of echocardiography. 2002;15:601–9. doi: 10.1067/mje.2002.117560. [DOI] [PubMed] [Google Scholar]
- Kober F, Iltis I, Cozzone PJ, Bernard M. Myocardial blood flow mapping in mice using high-resolution spin labeling magnetic resonance imaging: Influence of ketamine/xylazine and isoflurane anesthesia. Magnetic resonance in medicine. 2005;53:601–6. doi: 10.1002/mrm.20373. [DOI] [PubMed] [Google Scholar]
- Konofagou EE, D’hooge J, Ophir J. Myocardial elastography—A feasibility study in vivo. Ultrasound in medicine & biology. 2002;28:475–82. doi: 10.1016/s0301-5629(02)00488-x. [DOI] [PubMed] [Google Scholar]
- Kumar D, Hacker TA, Buck J, Whitesell LF, Kaji EH, Douglas PS, Kamp TJ. Distinct mouse coronary anatomy and myocardial infarction consequent to ligation. Coronary artery disease. 2005;16:41–4. doi: 10.1097/00019501-200502000-00008. [DOI] [PubMed] [Google Scholar]
- Laufer J, Elwell C, Delpy D, Beard P. In vitro measurements of absolute blood oxygen saturation using pulsed near-infrared photoacoustic spectroscopy: accuracy and resolution. Physics in Medicine & Biology. 2005;50:4409. doi: 10.1088/0031-9155/50/18/011. [DOI] [PubMed] [Google Scholar]
- Laufer J, Johnson P, Zhang E, Treeby B, Cox B, Pedley B, Beard P. In vivo preclinical photoacoustic imaging of tumor vasculature development and therapy. Journal of biomedical optics. 2012;17:0560161–8. doi: 10.1117/1.JBO.17.5.056016. [DOI] [PubMed] [Google Scholar]
- Li Z, Li H, Chen H, Xie W. In vivo determination of acute myocardial ischemia based on photoacoustic imaging with a focused transducer. Journal of biomedical optics. 2011;16:076011–6. doi: 10.1117/1.3598314. [DOI] [PubMed] [Google Scholar]
- Ma C, Wang X, Varghese T. Segmental Analysis of Cardiac Short-Axis Views Using Lagrangian Radial and Circumferential Strain. Ultrasonic imaging. 2016;38:363–83. doi: 10.1177/0161734615613322. [DOI] [PMC free article] [PubMed] [Google Scholar]
- Mallidi S, Luke GP, Emelianov S. Photoacoustic imaging in cancer detection, diagnosis, and treatment guidance. Trends in biotechnology. 2011;29:213–21. doi: 10.1016/j.tibtech.2011.01.006. [DOI] [PMC free article] [PubMed] [Google Scholar]
- Needles A, Heinmiller A, Sun J, Theodoropoulos C, Bates D, Hirson D, Yin M, Foster FS. Development and initial application of a fully integrated photoacoustic micro-ultrasound system. IEEE transactions on ultrasonics, ferroelectrics, and frequency control. 2013;60:888–97. doi: 10.1109/TUFFC.2013.2646. [DOI] [PubMed] [Google Scholar]
- Patten RD, Aronovitz MJ, Deras-Mejia L, Pandian NG, Hanak GG, Smith JJ, Mendelsohn ME, Konstam MA. Ventricular remodeling in a mouse model of myocardial infarction. American Journal of Physiology-Heart and Circulatory Physiology. 1998;274:H1812–H20. doi: 10.1152/ajpheart.1998.274.5.H1812. [DOI] [PubMed] [Google Scholar]
- Pfeffer MA, Pfeffer JM, Fishbein MC, Fletcher PJ, Spadaro J, Kloner RA, Braunwald E. Myocardial infarct size and ventricular function in rats. Circulation research. 1979;44:503–12. doi: 10.1161/01.res.44.4.503. [DOI] [PubMed] [Google Scholar]
- Puleo PR, Meyer D, Wathen C, Tawa CB, Wheeler S, Hamburg RJ, Ali N, Obermueller SD, Triana FJ, Zimmerman JL. Use of a rapid assay of subforms of creatine kinase MB to diagnose or rule out acute myocardial infarction. New England Journal of Medicine. 1994;331:561–6. doi: 10.1056/NEJM199409013310901. [DOI] [PubMed] [Google Scholar]
- Rich LJ, Seshadri M. Photoacoustic imaging of vascular hemodynamics: validation with blood oxygenation level–dependent MR imaging. Radiology. 2014;275:110–8. doi: 10.1148/radiol.14140654. [DOI] [PMC free article] [PubMed] [Google Scholar]
- Rich LJ, Seshadri M. Photoacoustic monitoring of tumor and normal tissue response to radiation. Scientific reports. 2016;6:21237. doi: 10.1038/srep21237. [DOI] [PMC free article] [PubMed] [Google Scholar]
- Schwaiger M, Muzik O. Assessment of myocardial perfusion by positron emission tomography. The American journal of cardiology. 1991;67:35D–43D. doi: 10.1016/s0002-9149(05)80006-2. [DOI] [PubMed] [Google Scholar]
- Singla DK, Hacker TA, Ma L, Douglas PS, Sullivan R, Lyons GE, Kamp TJ. Transplantation of embryonic stem cells into the infarcted mouse heart: formation of multiple cell types. Journal of molecular and cellular cardiology. 2006;40:195–200. doi: 10.1016/j.yjmcc.2005.09.001. [DOI] [PubMed] [Google Scholar]
- Su JL, Wang B, Wilson KE, Bayer CL, Chen Y-S, Kim S, Homan KA, Emelianov SY. Advances in clinical and biomedical applications of photoacoustic imaging. Expert opinion on medical diagnostics. 2010;4:497–510. doi: 10.1517/17530059.2010.529127. [DOI] [PMC free article] [PubMed] [Google Scholar]
- Swan H, Forrester JS, Diamond G, Chatterjee K, Parmley WW. Hemodynamic spectrum of myocardial infarction and cardiogenic shock. Circulation. 1972;45:1097–110. doi: 10.1161/01.cir.45.5.1097. [DOI] [PubMed] [Google Scholar]
- Thygesen K, Alpert JS, White HD, Jaffe AS, Apple FS, Galvani M, Katus HA, Newby LK, Ravkilde J, Chaitman B. Universal definition of myocardial infarction: Kristian Thygesen, Joseph S. Alpert and Harvey D. White on behalf of the Joint ESC/ACCF/AHA/WHF Task Force for the Redefinition of Myocardial Infarction. European heart journal. 2007;28:2525–38. doi: 10.1093/eurheartj/ehm355. [DOI] [PubMed] [Google Scholar]
- Varghese T, Zagzebski JA, Rahko P, Breburda CS. Ultrasonic imaging of myocardial strain using cardiac elastography. Ultrason Imaging. 2003;25:1–16. doi: 10.1177/016173460302500101. [DOI] [PubMed] [Google Scholar]
- Wang LV, Hu S. Photoacoustic tomography: in vivo imaging from organelles to organs. Science. 2012;335:1458–62. doi: 10.1126/science.1216210. [DOI] [PMC free article] [PubMed] [Google Scholar]
- Wang X, Xie X, Ku G, Wang LV, Stoica G. Noninvasive imaging of hemoglobin concentration and oxygenation in the rat brain using high-resolution photoacoustic tomography. Journal of biomedical optics. 2006;11:024015. doi: 10.1117/1.2192804. [DOI] [PubMed] [Google Scholar]
- Weber KT, Janicki JS, Russell RO, Rackley CE, Swan H, Resnekov L, Killip T, Morris J, Wallace A, Ross RS. Identification of high risk subsets of acute myocardial infarction: derived from the myocardial infarction research units cooperative study data bank. The American journal of cardiology. 1978;41:197–203. doi: 10.1016/0002-9149(78)90156-x. [DOI] [PubMed] [Google Scholar]
- Wiemer M, Wielepp JP, Lindner O, Burchert W, Langer C, Horstkotte D, Butz T. Assessment of myocardial perfusion by positron emission tomography in patients with end-stage coronary artery disease treated with percutaneous myocardial revascularization. Chinese Medical Journal (English Edition) 2009;31:2807. [PubMed] [Google Scholar]
- Xu M, Wang LV. Photoacoustic imaging in biomedicine. Review of scientific instruments. 2006;77:041101. [Google Scholar]
- Yamaleyeva LM, Sun Y, Bledsoe T, Hoke A, Gurley SB, Brosnihan KB. Photoacoustic imaging for in vivo quantification of placental oxygenation in mice. The FASEB Journal. 2017;31:5520–9. doi: 10.1096/fj.201700047RR. [DOI] [PMC free article] [PubMed] [Google Scholar]
- Yang F, Liu Y-H, Yang X-P, Xu J, Kapke A, Carretero OA. Myocardial infarction and cardiac remodelling in mice. Experimental Physiology. 2002;87:547–55. doi: 10.1113/eph8702385. [DOI] [PubMed] [Google Scholar]
- Yao J, Maslov KI, Zhang Y, Xia Y, Wang LV. Label-free oxygen-metabolic photoacoustic microscopy in vivo. Journal of biomedical optics. 2011;16:076003–11. doi: 10.1117/1.3594786. [DOI] [PMC free article] [PubMed] [Google Scholar]
- Zemp R, Song L, Bitton R, Shung K, Wang L. Realtime photoacoustic microscopy of murine cardiovascular dynamics. Optics express. 2008;16:18551–6. doi: 10.1364/oe.16.18551. [DOI] [PMC free article] [PubMed] [Google Scholar]


