Abstract
Given the high morbidity and the trend of younger individuals being affected observed in cervical cancer, it is important to identify sensitive and effective biomarkers for predicting the survival outcome of patients. Based on data from 307 cervical cancer cases acquired from The Cancer Genome Atlas portal, 1920 differentially expressed mRNAs, 70 microRNAs(miRNAs), and 493 long non-coding(lncRNAs) were screened by comparing cervical cancer tissues with paracancerous tissues. A competing endogenous (ceRNA) network containing 50 lncRNAs, 16 miRNAs, and 81 mRNAs was constructed. Eighteen RNAs, comprising 13 mRNAs, 2 miRNAs, and 3 lncRNAs, were identified as significant prognostic factors by univariate Cox proportional hazards regression. ETS-related gene and fatty acid synthase signatures were discovered using a multivariate Cox regression model built to identify independent prognostic factors in cervical cancer patients. Receiver operating characteristic (ROC) analysis was used to determine the optimal cut-off value for distinguishing the risk level of cervical cancer patients. High-risk patients exhibited a poorer prognosis than low-risk patients did. This study focused on ceRNA networks to provide a novel perspective and insight into cervical cancer and suggested that the identified signature can serve as an independent prognostic biomarker in cervical cancer.
Keywords: cervical cancer, ceRNA network, prognostic factor, FASN, ERG
Introduction
Cervical cancer (CC) is one of the leading malignant carcinomas threatening women's health and represents a worldwide concern (1). Since the introduction of the Papanicolaou test and human papilloma (HPV) DNA test, the incidence and mortality of CC has dramatically reduced (2). The long transmit time from cervical intraepithelial lesions to CC provides an opportunity to identify pre-cancerous lesions and enable early treatment. Once the disease develops into CC, the overall survival rate directly depends on stage, with an average survival of 70% at 5 years (3). However, approximately 11.4% of women are not screened using the effective screening systems mentioned above (4). Although HPV was identified as a driving factor that can lead to CC, a substantial proportion of CC tissues are HPV-negative (5). Given the high morbidity of this disease and the trend of younger individuals being affected (6), it is important to identify sensitive and effective biomarkers.
mRNA, microRNA(miRNA), long non-coding(lncRNA), and competing endogenous (ceRNA) represent a new RNA mechanism that regulates gene expression. Assessing miRNA regulatory networks to provide new perspectives for evaluating cancer regulatory networks is complex (7). Using miRNA as a bridge, lncRNA can modulate cell functions by regulating mRNA expression levels.
The Cancer Genome Atlas (TCGA) is a publicly available dataset that provides many types of genomic data (8). This information can be mined to construct a lncRNA-miRNA-mRNA ceRNA network in CC. In this study, we obtained RNA-seq profiles from TCGA and performed integrated analysis of differentially expressed RNAs. By using Cox regression analysis, a signature based on ETS-related gene (ERG) and fatty acid synthase (FASN) showed potential as a biomarker with prognostic value in CC.
Methods and materials
Data source and clinical information
High-throughput sequencing-counts (HTSeq-counts) and miRNA sequencing profiles were obtained from TCGA data portal, which included 307 CC patients as of March 1, 2018. Three profiles were obtained from normal or adjunct cervical tissues, whereas the other signatures were obtained from CC tissues.
Clinical information from CC patients was also downloaded from TCGA. Of the 307 patients, 254 patients had cervical squamous cell carcinoma and 53 patients had adenocarcinoma carcinoma. The median age of these population was 46 years. According to clinical stage, 188 individuals were stage I-IIa while 109 individuals were stage IIb-IV. According to the status after surgical treatment, 191 patients were tumor free, whereas 74 patients survived with tumors. At the time of the last follow-up, 247 patients were still alive, whereas 60 had died. Infection with HPV was not consistently reported, with only 15 patients reported to have HPV. Thus, the HPV subgroup was not analyzed.
Identification of differentially expressed mRNAs, miRNAs, and lncRNAs
All expression profiles were normalized within and among samples. mRNA and lncRNA were classified by their HTSeq-counts based on CRCh38.87 mapping. To identify potential RNAs involved in the development of CC, differentially expressed RNAs between normal or adjunct cervical tissues and CC tissues were analyzed using the edgeR package with a cutoff of false discovery rate-adjusted p < 0.01 and |logFC|≥2 (9). Because many RNAs exhibit low expression, RNAs with a mean expression of less than 1 were excluded. The heatmap was plotted using the heatmap.2 function in gplots package.
Construction of the ceRNA network
Because mRNA, miRNA, and lncRNA can regulate each other, it is necessary to construct a ceRNA network to provide insight into their interaction mechanisms. Thus, we set miRNA as the central point and differentially expressed RNAs were analyzed based on the following pairings: miRNA-lncRNA and mRNA-miRNA. Briefly, according to the miRcode database (10), differentially expressed lncRNAs were used to pair differentially expressed miRNAs. Next, the paired miRNAs were used to identify target mRNAs according to three databases: miRDB (11), miRTarBase (12), and TargetScan (13). Only mRNAs predicted by all three databases were defined as target mRNAs. Next, the intersection of target mRNAs and differentially expressed mRNAs was selected to construct the ceRNA network along with the miRNAs and lncRNAs mentioned above.
Functional enrichment analysis of gene ontology and KEGG pathways
The intersections of target mRNAs and differentially expressed mRNAs were subjected to functional enrichment analysis, including gene ontology and KEGG pathway analysis. The mRNAs involved in the ceRNA network were divided into two groups: upregulated mRNAs and downregulated mRNAs. The clusterProfiler package was utilized to analyze function enrichment (14). A p < 0.05 was considered to indicate significant enrichment.
Construction of a prognostic signature based on the ceRNA network
Univariate Cox proportional hazards regression analyses were performed based on mRNAs, miRNAs, and lncRNAs in the ceRNA network. Prognosis-related RNAs were defined using the cutoff of p < 0.05. Next, a multivariate Cox proportional hazards regression model was constructed based on RNAs with a p < 0.01 to predict the risk score of each patient based on the expression of RNA. The risk score for predicting overall survival was calculated as follows: expRNA1*βRNA1+ expRNA2*βRNA2+ expRNA3*βRNA3+…expRNAn*βRNAn, where expRNA is the expression level of RNA and βRNA is the regression coefficient calculated by the multivariate Cox proportional hazards regression model. Patients were divided into a low-risk group and high-risk group according to the mean risk score. Kaplan-Meier curve analysis was conducted to compare the survival times of the low-risk group and high-risk group. P < 0.05 was considered statistically significant. Chi-square test was utilized to correlate risk level with clinical parameters including age, race, body mass index (BMI), menopause status, histological type, tumor grade, clinical stage, neoplasm status, and vital status. Receiver operating characteristic (ROC) curve analysis using 3 years as the predicted time was also performed to estimate the predictive value of the outcome. The area under the ROC curve along with sensitive and specificity were used as evaluation indices of the prediction value.
A Cox proportional hazards regression model was further used to better evaluate the effects of clinical characteristics and risk score on the overall survival of CC patients.
Protein-protein interaction network construction
The protein-protein interaction network was constructed using the STRING website (15), which is a tool for analyzing the relationship between proteins and scoring these relationships based on experimental data and forecast data. The interaction network was visualized using Cytoscape software.
Statistical analysis
In the analysis of differently expressed genes, significance was tested using the optimal discovery procedure and generalized likelihood ratio tests. p < 0.01 and |logFC|≥2 were considered statistically significant.
Enumeration data were described by sample size and constituent ratio and chi-square test was utilized correlate the risk level with clinical parameters. A univariate Cox proportional hazards model was used to assess the risk factors associated with the outcomes of CC patients, and then clinical parameters with p < 0.05 were entered in multivariate Cox proportional hazards model to evaluate prognostic factors. Kaplan-Meier plot analysis was used to determine the overall survival rate and the Log-rank test was utilized to analyze the differences between groups. The ROC curve was applied to calculate the sensitivity and specificity of risk score. P < 0.05 was considered statistically significant.
Results
Identification of differentially expressed mRNAs, miRNAs, and lncRNAs
A total of 19676 mRNAs, 1881 miRNAs, and 14487 lncRNAs were extracted from TCGA dataset. Differentially expressed RNAs were analyzed using the edgeR package following extraction of the expression matrix from 307 CC cases. Using p < 0.05 and |logFC|≥2 as the cut-off criteria, 1920 differentially expressed mRNAs (712 upregulated and 1208 downregulated), 70 differentially expressed miRNAs (33 upregulated and 37 downregulated), and 493 differentially expressed lncRNAs (128 upregulated and 365 downregulated) were identified by comparing CC and adjacent normal cervical tissues (Supplement Figure 1).
Construction of the ceRNA network based on predicted miRNA targets
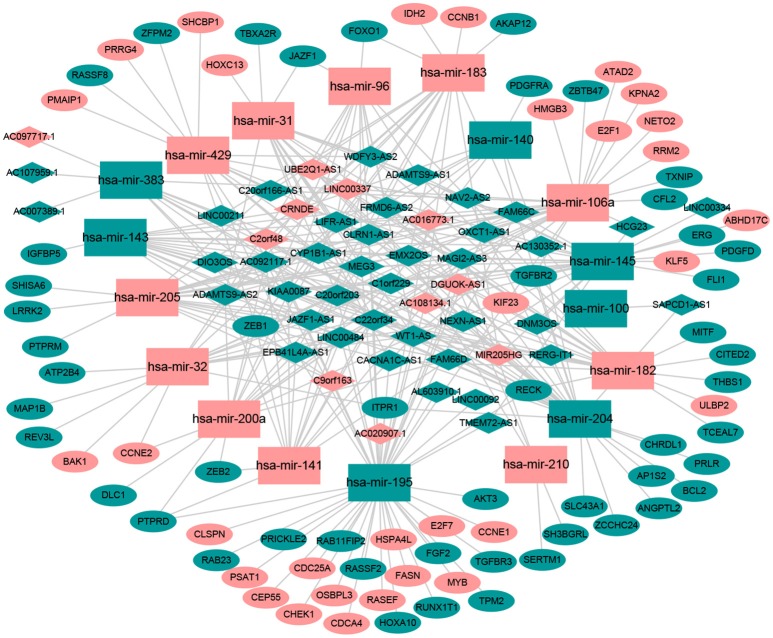
Numerous studies have suggested that lncRNAs interact with miRNA response elements to act as miRNA sponges (16, 17). First, the target regulation network of lncRNA-miRNA was constructed. Using miRcode to screen for potential miRNA response elements of lncRNA, 242 potential lncRNA-miRNA pairs, including 50 lncRNAs and 18 miRNAs, were formed (Supplement Table 1). Next, the miRNA-mRNA target regulation network was further assessed using miRDB, TargetScan, and miRTarBase. In total, 98 miRNA-mRNA pairs were identified, including 81 mRNAs and 16 miRNAs (Supplement Table 2). The lncRNA-miRNA-mRNA network was then constructed using Cytoscape software based on the results above and contained 50 lncRNAs, 16 miRNAs, and 81 mRNAs (Figure 1).
Figure 1.
The ceRNA network of lncRNA-miRNA-mRNA. Green diamonds represent downregulated lncRNA, red diamonds indicate upregulated lncRNA, green rectangles indicate downregulated miRNA, red rectangles indicate upregulated miRNA, green ellipses indicate downregulated mRNA, and red ellipses indicate upregulated mRNA.
Enrichment analysis of gene ontology and KEGG pathways
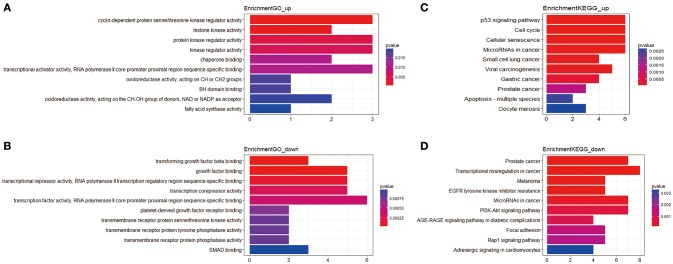
In total, 81 mRNAs were involved in the ceRNA network: 31 upregulated mRNAs and 50 downregulated mRNAs. ClusterProfiler package was utilized to compare gene clusters based on their enriched biological processes with a cutoff of p < 0.05. In GO functional enrichment analysis, the upregulated mRNAs that were significantly enriched included cyclin-dependent protein serine/threonine kinase regulator activity, histone kinase activity, protein kinase regulator activity, kinase regulator activity, and chaperone binding. The downregulated mRNAs that were significantly enriched included transforming growth factor beta binding, growth factor binding, transcriptional repressor activity, RNA polymerase II transcription regulatory region sequence-specific binding, transcription corepressor activity, transcription factor activity, and RNA polymerase II core promoter proximal region sequence-specific binding (Supplement Table 3). In the KEGG analysis, the upregulated mRNAs were mainly enriched in p53 signaling pathway, cell cycle, cellular senescence, microRNAs in cancer, and small cell lung cancer. Downregulated mRNAs were mainly enriched in prostate cancer, transcriptional misregulation in cancer, melanoma, epidermal growth factor receptor (EGFR) tyrosine kinase inhibitor resistance, and microRNAs in cancer (Supplement Table 4) (Figure 2).
Figure 2.
The functional enrichment analysis of mRNAs in the ceRNA network. (A) Gene Ontology enrichment analysis of upregulated mRNAs. (B) Gene Ontology enrichment analysis of downregulated mRNAs. (C) KEGG pathway analysis of upregulated mRNAs. (D) KEGG pathway analysis of downregulated mRNAs. The horizontal axis represents gene counts. The vertical axis represents enrichment analysis terms.
Construction of a prognostic signature based on the ceRNA network
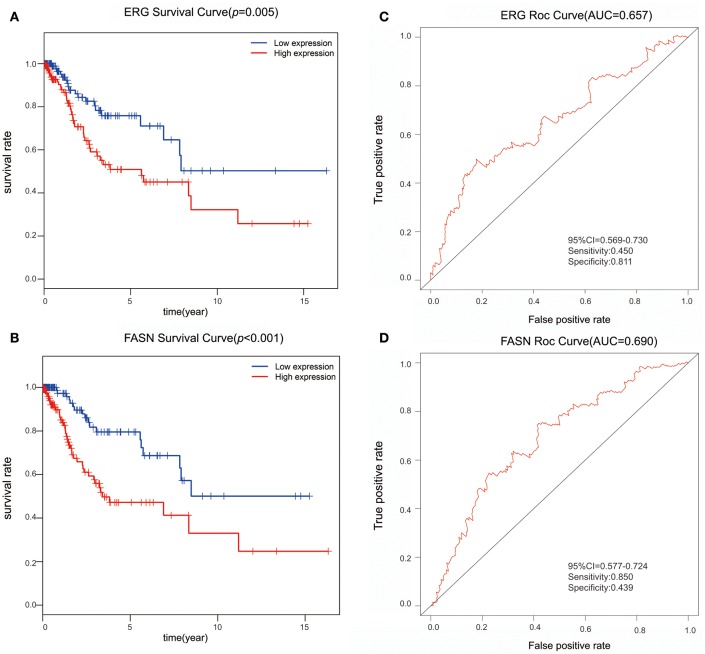
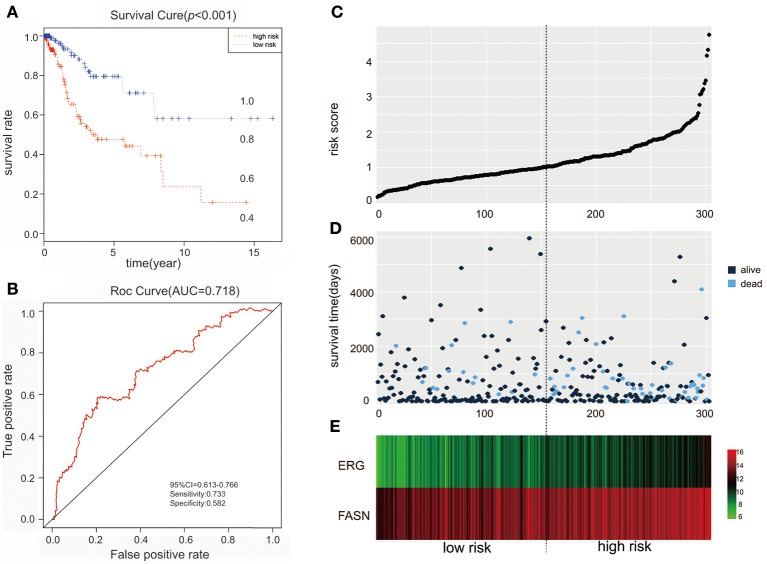
We further performed survival and prognostic analyses of the 50 lncRNAs, 16 miRNAs, and 81 mRNAs in the ceRNA network. Univariate Cox proportional hazards regression revealed that 18 RNAs, comprised of 13 mRNAs, 2 miRNAs, and 3 lncRNAs, were identified as significant prognostic factors based on the cutoff of a p < 0.05 (Supplement Table 5). Multivariate Cox proportional hazards regression analysis revealed that two RNAs exhibited a significant prognostic value: ERG and FASN (Supplement Table 6) (Figure 3). The risk assessment score for predicting overall survival was calculated as follows: Risk score = expERG*0.359+ expFASN*0.345. Based on the risk score, cervical cancer patients were divided into two group: low-risk and high-risk. Kaplan-Meier survival analysis indicated that the mean survival time was 2154 days for the high-risk group and 4166 days for the low-risk group (p < 0.001). In ROC curve analysis, the 3-year survival of the area under the curve was 0.718 (p < 0.001, 95% confidence interval of hazard ratio: 0.613-0.766, sensitivity: 0.733, specificity: 0.582) (Figure 4).
Figure 3.
The predictive value of ERG and FASN on outcome. (A) The Kaplan-Meier survival analysis of ERG expression in overall survival. (B) The Kaplan-Meier survival analysis of FASN expression in overall survival. (C) ROC cure for predicting 3-year survival based on ERG expression levels. (D) ROC curve for predicting 3-year survival based on FASN expression level.
Figure 4.
The predictive value of the risk score calculated by ERG and FASN on outcome. (A) Kaplan-Meier survival analysis of the risk score for overall survival. (B) ROC curve for predicting 3-year survival based on risk score. (C) Risk score of each individual. (D) Survival status and survival time of each individual. (E) Heatmap of ERG and FASN in high-risk and low-risk groups.
The clinical parameters along with risk level are shown in Table 1. In the Chi-square test, as shown in Table 2, the risk level was significantly related to BMI (p = 0.006), histological type (p < 0.001), clinical stage (p = 0.001), and vital status (p < 0.001). No dramatic correlation between the risk level and other clinical parameters such as age, race, or neoplasm status were found.
Table 1.
Clinical parameters of cervical cancer patients.
| Subgroup | Frequency | Percent | Valid percent |
|---|---|---|---|
| Age | |||
| <60 | 238 | 78.6 | 78.6 |
| >=60 | 65 | 21.4 | 21.4 |
| Race | |||
| White | 209 | 68.8 | 91.3 |
| Asian | 20 | 6.6 | 8.7 |
| BMI | |||
| <25 | 98 | 32.2 | 37.8 |
| >=25 | 161 | 53 | 62.2 |
| Menopause | |||
| Premenopausal | 124 | 40.8 | 53.7 |
| Perimenopause/postmenopausal | 107 | 35.2 | 46.3 |
| Histological type | |||
| Squamous cellcarcinoma | 252 | 82.9 | 82.9 |
| Adenocarcinoma/adenosquamous carcinoma | 52 | 17.1 | 17.1 |
| Grade | |||
| G1+G2 | 153 | 50.3 | 56.3 |
| G3 | 119 | 39.1 | 43.8 |
| Clinical stage | |||
| I-IIA2 | 188 | 61.8 | 63.3 |
| IIB-IV | 109 | 35.9 | 36.7 |
| Neoplasm status | |||
| Tumor free | 188 | 61.8 | 71.8 |
| With tumor | 74 | 24.3 | 28.2 |
| Vital status | |||
| Alive | 244 | 80.3 | 80.3 |
| Dead | 60 | 19.7 | 19.7 |
| Risk level | |||
| Low | 152 | 50 | 50 |
| High | 152 | 50 | 50 |
Table 2.
Relationship between risk level and clinical parameters.
| Subgroup | High-risk | Low-risk | Total | P-value |
|---|---|---|---|---|
| Age | 0.484 | |||
| <60 | 122 | 117 | 239 | |
| >=60 | 30 | 35 | 65 | |
| Race | 0.684 | |||
| White | 105 | 104 | 209 | |
| Asian | 11 | 9 | 20 | |
| BMI | 0.006* | |||
| <25 | 58 | 40 | 98 | |
| >=25 | 67 | 94 | 161 | |
| Menopause | 0.315 | |||
| Premenopausal | 65 | 59 | 124 | |
| Perimenopause/postmenopausal | 49 | 58 | 107 | |
| Histological type | <0.001* | |||
| Squamous cellcarcinoma | 139 | 113 | 252 | |
| Adenocarcinoma/adenosquamous carcinoma | 13 | 39 | 52 | |
| Grade | 0.783 | |||
| G1+G2 | 72 | 81 | 153 | |
| G3 | 58 | 61 | 119 | |
| Clinical stage | 0.001* | |||
| I-IIA2 | 80 | 108 | 188 | |
| IIB-IV | 68 | 41 | 109 | |
| Neoplasm statue | 0.17 | |||
| Tumor free | 89 | 99 | 188 | |
| With tumor | 42 | 32 | 74 | |
| Vital status | <0.001* | |||
| Alive | 108 | 136 | 244 | |
| Dead | 44 | 16 | 60 |
p < 0.05.
To better evaluate the prognostic value of the risk score, clinical characteristics, including race, age, tumor grade, clinical stage, pathological type, type of neoplasm, BMI, and menopause status, were examined in survival analysis. Univariate analysis of clinicopathological parameters revealed that survival time was significantly associated with clinical stage (p = 0.02), type of neoplasm (p < 0.001), BMI (p = 0.04), and risk score (p < 0.001). However, no significant differences were found between the survival time and race, age, tumor grade, pathological type or menopause status (Figure 5). Unexpectedly, multivariate Cox proportional hazards regression analysis indicated that type of neoplasm (p < 0.001) and risk level (p = 0.04) were significantly independent predictive factors of poorer prognosis for CC but not clinical stage (p > 0.05) (Figure 6).
Figure 5.
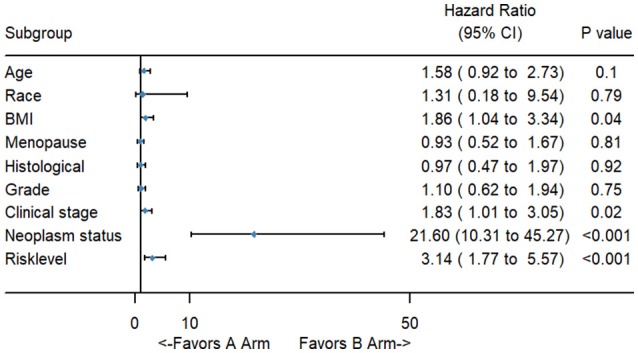
The forest map of univariate logistic regression analysis. The line provided an imaginal of 95% CI, location of diamond on the line represented the odds ratio.
Figure 6.
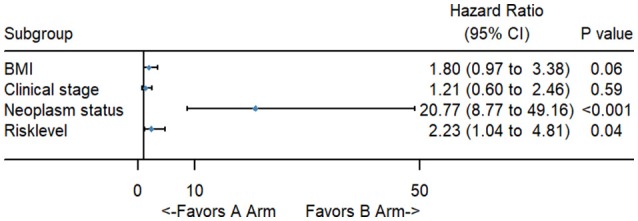
The forest map of multivariate logistic regression analysis. The line provided an imaginal of 95% CI, location of diamond on the line represented the odds ratio.
Protein-protein network analysis
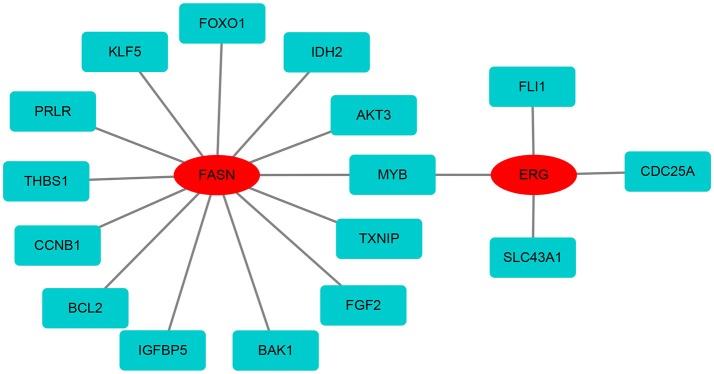
Based on the differentially expressed mRNAs, the protein-protein network was constructed using FASN and ERG as the center. We found that FASN was related to FOXO1, KLF5, PRLR, THBS1, CCNB1, BCL2, IGFBP5, BAK1, FGF2, TXNIP, MYB, AKT3, and IDH2, whereas ERG was closely related to FLI1, CDC25A, SLC43A1, and MYB (Figure 7).
Figure 7.
The protein-protein network of FASN and ERG with differentially expressed mRNAs. FASN and ERG were surrounded by differentially expressed mRNAs based on the STRING database.
Discussion
Screening systems such as the Pap and HPV DNA test dramatically reduced the incidence and morality of CC, but its high sensitivity and low specificity contribute to colposcopy in numerous women with doubtful lesions. Increasing studies have performed to identify biomarkers to distinguish disease stages and some progress has been made. P16ink4a, p16, E-cadherin, Ki67, pRb, and p53 are markers that can discriminate CC from intraepithelial lesions, while CEA, SCC, and CD44 are used to detect invasive cancer (3). Among them, P16ink4a is directly linked to HPV oncogenic action, and is overexpressed in nearly all cases of high-grade squamous intraepithelial lesion but rarely in low-grade squamous intraepithelial lesion (18). P16ink4a and Ki67 can improve the sensitivity and specificity of the equivocal atypical squamous cells of undetermined significance or low-grade squamous intraepithelial lesion Pap test results, reducing the requirement for colposcopy.
In this study, differentially expressed RNAs, including mRNA, miRNA, and lncRNA, were identified by comparing adjunct or normal cervical tissues with CC tissues. Using miRNA as a bridge, paired lncRNA-miRNA-mRNAs were screened to construct a ceRNA network. To explore the effect of the ceRNA network on survival status, univariate and multivariate Cox proportional hazard regression analyses were conducted to successively analyze the prognostic value of differentially expressed RNAs. According to the expression level of prognostic genes, CC patients were divided into low-risk and high-risk groups. Next, clinical characteristics and risk scores were analyzed. TNM stage, BMI, type of neoplasm, and risk score were identified as prognostic factors of CC patients.
Compared to mRNA, lncRNA was recently discovered. Abundant evidence indicates that lncRNAs interact with the miRNA response element and function as miRNA sponges. Using miRNA as a bridge, ceRNA networks involving mRNA and lncRNA have been constructed, providing insight into CC. Previous studies revealed interactions between miRNA and mRNA. Functional analysis of differentially expressed miRNA targets revealed numerous cancer-associated pathways, cell growth and death-related pathways, including apoptosis, cell cycle, p53 signaling pathway and other signal transduction pathways, such as ErbB, MAPK, mTOR, Notch, TGF-β, and Wnt. Particularly, based on bioinformatics analysis of datasets including GEO and TCGA, key genes have been identified and found to be involved in cell proliferation including TP53, MYC, CCND1, CDKN2A, JUN, FOS, which are targets of differentially expressed miRNAs in CC. These transcription regulators may form feedback loops with miRNAs to modulate cell apoptosis and migration in CC. A pioneer study based on the interaction of mRNA and miRNA indicated that CHEK1, SOX17, CDKN2A, and CEP55, which are targets of star miRNAs in CC including miR-424-5p, miR-200a-5p, miR-9-5p, and miR-133b, play a vital role in the development of CC (19). However, the combination of lncRNA, miRNA and mRNA expression profile has not widely examined in CC. In this study of ceRNA, 50 lncRNAs, 16 miRNAs, and 81 mRNAs were found to be involved in cervical carcinogenesis.
miRNA are short regulatory RNAs that modulate gene expression levels by partial base pairing with the 3′ untranslated region of their target mRNAs. miRNAs show partial nucleotide sequence paring between miRNAs and their mRNA targets, leading to promiscuous interactions: one miRNA may interact with one or more mRNAs and one mRNA may be targeted by multiple miRNAs. miRNAs play vital roles in maintaining physiological function, including development, metabolism, senile, and apoptosis. Dysregulation of miRNAs can result in various diseases.
In the progression of CC, miRNAs were analyzed according to the severity of disease including CIN1, CIN2, CIN3, and CC. Few changes were observed in the miRNA expression in CIN1 compared to in normal cervical tissue. As the disease progressed, increasing number of miRNAs was found to be greatly altered (20).
In preeclampsia (PE), the perturbation of angiogenesis is recognized as a vital pathogenic factor. Various studies demonstrated that miR-16, miR-26b, miR-29b, miR-335, miR-222, miR-181a, and miR-195, which are associated with vascular endothelial growth factor, were aberrantly upregulated in PE (21). Among them, miR-181a was over-expressed in both the placenta and maternal sera. Additionally, miR-181, acting as modulator of T-cell sensitivity and is associated with tolerance induction at the maternal-fetal interface, was disturbed during PE (22).
Placental vascular alterations due to angiogenic imbalance occurred in PE as well as fetal growth restriction (FGR). FGR is the termination or decrease of the fetus determined by generic factors during pregnancy. Accumulating evidence demonstrated that the dysregulation of miRNAs is involved in FGR. In placental tissue, miR-21, miR-499a-5p, miR-1-3p, miR-424, miR-141, and miR-519a are overexpressed in FGR while miR-194 are downregulated (23). In maternal circulation, miR-100-5p, miR-125-5p, and miR-199a-5p are downregulated in FGR as well as preeclampsia and gestational hypertension (24). In vitro and in vivo experiments showed that, miR-141-3p and miR-200A-3p are vital for placental development in mouse by regulating the level of insulin like growth factor 2 (25).
The survival outcome of CC is mainly predicted by two elements, TNM stage and type of neoplasm; however, these indices are not quantifiable. Some studies suggested that hypoxia-inducible factor-1α can serve as an independent poor survival marker of CC, as it is involved in numerous pathways, including the PI3K/AKT and mTOR pathways (26). Additionally, hypoxia-inducible factor-1α may be induced by HPV to promote tumor angiogenesis (27). BCL-2, a key protein in the process of transmitting apoptosis signals, is negatively correlated with disease-free survival in CC and can function as an independent survival factor (28). Cyclooxygenase-2, a cyclooxygenase subtype, can inhibit the apoptosis signal, increase vascularization, and activate the PI3K/AKT pathway to promote chemoresistance (29). Additionally, EGFR was upregulated with the degree of malignancy in CC. EGFR exhibits a positive correlation with lymph node metastasis (30). However, an efficient and sensitive marker for predicting the outcome of CC is lacking. In this study, we identified a signature based on ERG and FASN to predict the risk score of each patient and evaluate the outcome in combination with information regarding TNM stage and type of neoplasm in cervical cancer patients.
ERG is a member of the erythroblast transformation-specific family that regulates embryonic development, cell proliferation, apoptosis, and angiogenesis. It is indispensable for inducing vascular cell remodeling (31). Under normal circumstances, ERG is highly expressed in the embryonic mesoderm and endothelium. During vascular development, its expression decreases, but the pluripotency of hematopoietic stem cells continues to be regulated (32). An increasing number of studies has indicated that ERG functions in malignant cancers. In acute myeloid leukemia, ERG expression is high and predicts adverse clinical outcome (33). Several studies demonstrated that ERG is highly and consistently expressed in many prostate cancer patients because of gene fusion with TMPRSS2, an androgen-dependent gene (34). ERG serves as an actuation factor in the development of prostate cancer. ERG overexpression is associated with advanced TNM stage, high Gleason score, and poor survival outcome (35). ERG overexpression influences the epithelial-mesenchymal transition by upregulating FZD4 and downregulating E-cadherin (36). Additionally, NOTCH and Wnt signaling are activated by high levels of ERG to induce cell migration and invasion. ERG is upregulated in central nervous system tumors, including glioblastomas and hemangioblastomas, and may function as a specific marker in these tumors (37).
FASN encodes an enzyme that catalyzes the conversion of acetyl-CoA and malonyl-CoA into long-chain saturated fatty acids. FASN overexpression is associated with malignant tumors, including breast cancer (38), prostate cancer (39), colorectal cancer (40), gastric cancer (41), and lung cancer (42), as well as poor prognosis. Loss of FASN can reduce the energy metabolism, proliferation, and migration of cancer cells. FASN also inhibits the expression of HER2 and may function as a potential therapeutic target in estrogen receptor- and progesterone receptor-positive endometrial cancers (43).
Few studies have focused on the role and mechanism of ERG and FASN in CC. In our protein-protein interaction network analysis, we found that FASN and ERG proteins interact with other proteins, including FOXO1, KLF5, THBS1, CCNB1, BCL2, AKT3, and CDC25A, to play a crucial role in CC. We identified a signature based on ERG and FASN as a biomarker in CC. This signature may serve as a therapeutic target for precision medicine in CC. This study describes a new method for further investigating the pathogenesis of CC. Further studies are required to explore the biological functions and underlying molecular mechanisms of ERG and FASN in cervical cancer.
Conclusion
This study focused on ceRNA networks to provide a novel perspective and insight into CC and suggested that the signature based on ERG and FASN can serve as an independent prognostic biomarker in CC.
Ethics statement
High-throughput sequencing-counts (HTSeq-counts) and miRNA sequencing profiles were obtained from the TCGA data portal, which is a publicly available dataset for which no ethics approval is needed.
Author contributions
LX constructed the ceRNA network using R software. HW analyzed the data using SPSS. SC download data from TCGA. XS used photoshop and illustration software. JS organized the data. QM performed GO and KEGG analysis. YC performed PPI network analysis. LL wrote the manuscript. JY performed survival analysis. CZ polished the language. MX provided guidance.
Conflict of interest statement
The authors declare that the research was conducted in the absence of any commercial or financial relationships that could be construed as a potential conflict of interest.
Glossary
Abbreviations
- TCGA
The Cancer Genome Altas
- CeRNA
competing endogenous RNA
- ERG
ETS Transcription Factor
- FASN
Fatty Acid Synthase
- ROC
receiver operating characteristic curve
- HPV
Human Papillomavirus
- HTSeq
high-throughput sequencing
- GO
gene ontology
- KEGG
Kyoto Encyclopedia of Genes and Genomes
- EGFR
Epidermal Growth Factor Receptor
- BMI
Body Mass Index
- FOXO1
Forkhead Box O1
- KLF5
Kruppel Like Factor 5
- PRLR
Prolactin Receptor
- THBS1
Thrombospondin 1
- CCNB1
Cyclin B1
- BCL2
B-Cell CLL/Lymphoma 2
- IGFBP5
Insulin Like Growth Factor Binding Protein 5
- BAK1
BCL2 Antagonist/Killer 1
- FGF2
Fibroblast Growth Factor 2
- TXNIP
Thioredoxin Interacting Protein
- MYB
MYB Proto-Oncogene
- AKT3
AKT Serine/Threonine Kinase 3
- IDH2, Isocitrate Dehydrogenase [NADP(+)] 2
Mitochondrial
- FLI1
Friend Leukemia Virus Integration 1
- CDC25A
Cell Division Cycle 25A
- SLC43A1
Solute Carrier Family 43 Member 1
- MYB
MYB Proto-Oncogene
- mTOR
Mechanistic Target of Rapamycin Kinase
- HIF1-1α
Hypoxia Inducible Factor 1 Alpha Subunit
- BCL2
B-Cell CLL/Lymphoma 2
- COX-2
Mitochondrially Encoded Cytochrome C Oxidase II
- ETS
erythroblast transformation-specific
- TMPRSS2, Transmembrane Protease
Serine 2
- FZD4
Frizzled Class Receptor 4
- CNS
central nervous system
- PPI
Protein protein interactions.
Footnotes
Funding. This work was supported by National Key Research and Development Program of China (NO: 2016YFC1303100).
Supplementary material
The Supplementary Material for this article can be found online at: https://www.frontiersin.org/articles/10.3389/fonc.2018.00368/full#supplementary-material
Heatmap of differentially expressed RNAs. (A) The heatmap of 200 randomly selected differentially expressed mRNAs. (B) The heatmap of 70 differentially expressed miRNAs. (C) The heatmap of 200 randomly selected differentially expressed lncRNAs. Red indicates a high level of RNA expression, whereas green indicates low expression.
Paired lncRNA and miRNA. 50 differently expressed lncRNAs and 18 differently expressed miRNAs paired according to the miRcode database.
Paired miRNA and mRNA. 98 differently expressed miRNA-mRNA pairs were identified including 81 mRNAs and 16miRNAs based on the three databases: miRDB, miRTarBase, and TargetScan. Only the mRNAs predicted by all the above three databases defined as the target mRNAs.
Gene ontology function enrichment analysis.
KEGG pathway analysis.
The prognostic differently expressed RNAs involved in ceRNA network by univariate cox regression analysis.
The prognostic differently expressed RNAs involved in ceRNA network by multivariate cox regression analysis. *P < 0.05.
References
- 1.Waggoner SE. Cervical cancer. Lancet (2003) 361:2217–25. 10.1016/S0140-6736(03)13778-6 [DOI] [PubMed] [Google Scholar]
- 2.Denny L. Cervical cancer: prevention and treatment. Discov Med. (2012) 14:125–31. [PubMed] [Google Scholar]
- 3.Valenti G, Vitale SG, Tropea A, Biondi A, Laganà AS. Tumor markers of uterine cervical cancer: a new scenario to guide surgical practice? Updates Surg. (2017) 69:441–9. 10.1007/s13304-017-0491-3 [DOI] [PubMed] [Google Scholar]
- 4.Benard VB, Thomas CC, King J, Massetti GM, Doria-Rose VP, Saraiya M, et al. Vital signs: cervical cancer incidence, mortality, and screening - United States, 2007-2012. MMWR Morb Mortal Wkly Rep. (2014) 63:1004–9. [PMC free article] [PubMed] [Google Scholar]
- 5.Eileen M. Burd. Human papillomavirus and cervical cancer. Clin Microbiol Rev. (2003) 16:1–17. 10.1128/CMR.16.1.1-17.2003 [DOI] [PMC free article] [PubMed] [Google Scholar]
- 6.Motoki Y, Mizushima S, Taguri M, Takahashi K, Asano R, Kato H, et al. Increasing trends in cervical cancer mortality among young Japanese women below the age of 50 years: an analysis using the Kanagawa population-based Cancer Registry, 1975-2012. Cancer Epidemiol. (2015) 39:700–6. 10.1016/j.canep.2015.08.001 [DOI] [PubMed] [Google Scholar]
- 7.Salmena L, Poliseno L, Tay Y, Kats L, Pandolfi PP. A ceRNA hypothesis: the rosetta stone of a hidden rna language?.Cell (2011) 146:353–8. 10.1016/j.cell.2011.07.014 [DOI] [PMC free article] [PubMed] [Google Scholar]
- 8.Tomczak K, Czerwinska P, Wiznerowicz M. The cancer genome atlas (TCGA): an immeasurable source of knowledge. Contemp Oncol (Pozn). (2015) 19:A68–77. 10.5114/wo.2014.47136 [DOI] [PMC free article] [PubMed] [Google Scholar]
- 9.Robinson MD, McCarthy DJ, Smyth GK. edgeR: a bioconductor package for differential expression analysis of digital gene expression data. Bioinformatics (2010) 26:139–40. 10.1093/bioinformatics/btp616 [DOI] [PMC free article] [PubMed] [Google Scholar]
- 10.Jeggari A, Marks DS, Larsson E. miRcode: a map of putative microRNA target sites in the long non-coding transcriptome. Bioinformatics (2012) 28:2062–3. 10.1093/bioinformatics/bts344 [DOI] [PMC free article] [PubMed] [Google Scholar]
- 11.Wong N, Wang X. miRDB: an online resource for microRNA target prediction and functional annotations. Nucleic Acids Res. (2015) 43(Database issue):D146–52. 10.1093/nar/gku1104 [DOI] [PMC free article] [PubMed] [Google Scholar]
- 12.Chou CH, Chang NW, Shrestha S, Hsu SD, Lin YL, Lee WH, et al. miRTarBase 2016: updates to the experimentally validated miRNA-target interactions database. Nucleic Acids Res. (2016) 44(D1):D239–47. 10.1093/nar/gkv1258 [DOI] [PMC free article] [PubMed] [Google Scholar]
- 13.Agarwal V, Bell GW, Nam JW, Bartel DP. Predicting effective microRNA target sites in mammalian mRNAs. Elife (2015) 4:e05005. 10.7554/eLife.05005 [DOI] [PMC free article] [PubMed] [Google Scholar]
- 14.Yu G, Wang LG, Han Y, He QY. clusterProfiler: an R package for comparing biological themes among gene clusters. OMICS (2012) 16:284–7. 10.1089/omi.2011.0118 [DOI] [PMC free article] [PubMed] [Google Scholar]
- 15.Szklarczyk D, Morris JH, Cook H, Kuhn M, Wyder S, Simonovic M, et al. The STRING database in 2017: quality-controlled protein–protein association networks, made broadly accessible. Nucleic Acids Res. (2017) 45(D1):D362–8. 10.1093/nar/gkw937 [DOI] [PMC free article] [PubMed] [Google Scholar]
- 16.Xia T, Liao Q, Jiang X, Shao Y, Xiao B, Xi Y, et al. Long noncoding RNA associated-competing endogenous RNAs in gastric cancer. Sci Rep. (2014) 4:6088. 10.1038/srep06088 [DOI] [PMC free article] [PubMed] [Google Scholar]
- 17.Tan JY, Sirey T, Honti F, Graham B, Piovesan A, Merkenschlager M, et al. Extensive microRNA-mediated crosstalk between lncRNAs and mRNAs in mouse embryonic stem cells. Genome Res. (2015) 25:655–66. 10.1101/gr.181974.114 [DOI] [PMC free article] [PubMed] [Google Scholar]
- 18.Zhang HS, Postigo AA, Dean DC. Active transcriptional repression by the Rb-E2F complex mediates G1 arrest triggered by p16INK4a, TGFbeta, and contact inhibition. Cell (1999) 97:53–61. [DOI] [PubMed] [Google Scholar]
- 19.Zhao L, Zhang Z, Lou H, Liang J, Yan X, Li W, et al. Exploration of the molecular mechanisms of cervical cancer based on mRNA expression profiles and predicted microRNA interactions. Oncol Lett. (2018) 15:8965–72. 10.3892/ol.2018.8494 [DOI] [PMC free article] [PubMed] [Google Scholar]
- 20.He Y, Lin J, Ding Y, Liu G, Luo Y, Huang M, et al. A systematic study on dysregulated microRNAs in cervical cancer development. Int J Cancer (2016) 138:1312–27. 10.1002/ijc.29618 [DOI] [PubMed] [Google Scholar]
- 21.Laganà AS, Vitale SG, Sapia F, Valenti G, Corrado F, Padula F, et al. miRNA expression for early diagnosis of preeclampsia onset: hope or hype? J Matern Fetal Neonatal Med. (2018) 31:817–21. 10.1080/14767058.2017.1296426 [DOI] [PubMed] [Google Scholar]
- 22.Henao-Mejia J, Williams A, Goff LA, Staron M, Licona-Limón P, Kaech SM, et al. The microRNA miR-181 is a critical cellular metabolic rheostat essential for NKT cell ontogenesis and lymphocyte development and homeostasis. Immunity (2013) 38:984–97. 10.1016/j.immuni.2013.02.021 [DOI] [PMC free article] [PubMed] [Google Scholar]
- 23.Chiofalo B, Laganà AS, Vaiarelli A, La Rosa VL, Rossetti D, Palmara V, et al. Do miRNAs play a role in fetal growth restriction? a fresh look to a busy corner. Biomed Res Int. (2017) 2017:6073167. 10.1155/2017/6073167 [DOI] [PMC free article] [PubMed] [Google Scholar]
- 24.Hromadnikova I, Kotlabova K, Hympanova L, Krofta L. Gestational hypertension, preeclampsia and intrauterine growth restriction induce dysregulation of cardiovascular and cerebrovascular disease associated microRNAs in maternal whole peripheral blood. Thromb Res. (2016) 137:126–40. 10.1016/j.thromres.2015.11.032 [DOI] [PubMed] [Google Scholar]
- 25.Saha S, Choudhury J, Ain R. MicroRNA-141-3p and miR-200a-3p regulate insulin-like growth factor 2 during mouse placental development. Mol Cell Endocrinol. (2015) 414:186–93. 10.1016/j.mce.2015.07.030 [DOI] [PubMed] [Google Scholar]
- 26.Huang M, Chen Q, Xiao J, Yao T, Bian L, Liu C, et al. Overexpression of hypoxia-inducible factor-1α is a predictor of poor prognosis in cervical cancer: a clinicopathologic study and a meta-analysis. Int J Gynecol Cancer (2014) 24:1054–64. 10.1097/IGC.0000000000000162 [DOI] [PubMed] [Google Scholar]
- 27.Tang X, Zhang Q, Nishitani J, Brown J, Shi S, Le AD. Overexpression of human papillomavirus type 16 oncoproteins enhances hypoxia-inducible factor 1 alpha protein accumulation and vascular endothelial growth factor expression in human cervical carcinoma cells. Clin Cancer Res. (2007) 13:2568–76. 10.1158/1078-0432.CCR-06-2704 [DOI] [PubMed] [Google Scholar]
- 28.Crawford RA, Caldwell C, Iles RK, Lowe D, Shepherd JH, Chard T. Prognostic significance of the bcl-2 apoptotic family of proteins in primary and recurrent cervical cancer. Br J Cancer (1998) 78:210–4. [DOI] [PMC free article] [PubMed] [Google Scholar]
- 29.Ferrandina G, Lauriola L, Distefano MG, Zannoni GF, Gessi M, Legge F, et al. Increased cyclooxygenase-2 expression is associated with chemotherapy resistance and poor survival in cervical cancer patients. J Clin Oncol. (2002) 20:973–81. 10.1200/JCO.2002.20.4.973 [DOI] [PubMed] [Google Scholar]
- 30.Soonthornthum T, Arias-Pulido H, Joste N, Lomo L, Muller C, Rutledge T, et al. Epidermal growth factor receptor as a biomarker for cervical cancer. Ann Oncol. (2011) 22:2166–78. 10.1093/annonc/mdq723 [DOI] [PubMed] [Google Scholar]
- 31.Han R, Pacifici M, Iwamoto M, Trojanowska M. Endothelial Erg expression is required for embryogenesis and vascular integrity. Organogenesis (2015) 11:75–86. 10.1080/15476278.2015.1031435 [DOI] [PMC free article] [PubMed] [Google Scholar]
- 32.Nikolova-Krstevski V, Yuan L, Le Bras A, Vijayaraj P, Kondo M, Gebauer I, et al. ERG is required for the differentiation of embryonic stem cells along the endothelial lineage. BMC Dev Biol. (2009) 9:72. 10.1186/1471-213X-9-72 [DOI] [PMC free article] [PubMed] [Google Scholar]
- 33.Pigazzi M, Masetti R, Martinolli F, Manara E, Beghin A, Rondelli R, et al. Presence of high-ERG expression is an independent unfavorable prognostic marker in MLL-rearranged childhood myeloid leukemia. Blood (2012) 119:1086–7; author reply 1087–8. 10.1182/blood-2011-10-385815 [DOI] [PubMed] [Google Scholar]
- 34.Kron KJ, Murison A, Zhou S, Huang V, Yamaguchi TN, Shiah YJ, et al. TMPRSS2-ERG fusion co-opts master transcription factors and activates NOTCH signaling in primary prostate cancer. Nat Genet. (2017) 49:1336–45. 10.1038/ng.3930 [DOI] [PubMed] [Google Scholar]
- 35.Adamo P, Ladomery MR. The oncogene ERG: a key factor in prostate cancer. Oncogene (2016) 35:403–14. 10.1038/onc.2015.109 [DOI] [PubMed] [Google Scholar]
- 36.Gupta S, Iljin K, Sara H, Mpindi JP, Mirtti T, Vainio P, et al. FZD4 as a mediator of ERG oncogene-induced WNT signaling and epithelial-to-mesenchymal transition in human prostate cancer cells. Cancer Res. (2010) 70:6735–45. 10.1158/0008-5472.CAN-10-0244 [DOI] [PubMed] [Google Scholar]
- 37.Haber MA, Iranmahboob A, Thomas C, Liu M, Najjar A, Zagzag D. ERG is a novel and reliable marker for endothelial cells in central nervous system tumors. Clin Neuropathol. (2015) 34:117–27. 10.5414/NP300817 [DOI] [PMC free article] [PubMed] [Google Scholar]
- 38.Giró-Perafita A, Sarrats A, Pérez-Bueno F, Oliveras G, Buxó M, Brunet J, et al. Fatty acid synthase expression and its association with clinico-histopathological features in triple-negative breast cancer. Oncotarget (2017) 8:74391–405. 10.18632/oncotarget.20152 [DOI] [PMC free article] [PubMed] [Google Scholar]
- 39.Van de Sande T, Roskams T, Lerut E, Joniau S, Van Poppel H, Verhoeven G, et al. High-level expression of fatty acid synthase in human prostate cancer tissues is linked to activation and nuclear localization of Akt/PKB. J Pathol. (2005) 206:214–9. 10.1002/path.1760 [DOI] [PubMed] [Google Scholar]
- 40.Zaytseva YY, Harris JW, Mitov MI, Kim JT, Butterfield DA, Lee EY, et al. Increased expression of fatty acid synthase provides a survival advantage to colorectal cancer cells via upregulation of cellular respiration. Oncotarget (2015) 6:18891–904. 10.18632/oncotarget.3783 [DOI] [PMC free article] [PubMed] [Google Scholar]
- 41.Duan J, Sun L, Huang H, Wu Z, Wang L, Liao W. Overexpression of fatty acid synthase predicts a poor prognosis for human gastric cancer. Mol Med Rep. (2016) 13:3027–35. 10.3892/mmr.2016.4902 [DOI] [PMC free article] [PubMed] [Google Scholar]
- 42.Orita H, Coulter J, Lemmon C, Tully E, Vadlamudi A, Medghalchi SM, et al. Selective inhibition of fatty acid synthase for lung cancer treatment. Clin Cancer Res. (2007) 13:7139–45. 10.1158/1078-0432.CCR-07-1186 [DOI] [PubMed] [Google Scholar]
- 43.Rahman MT, Nakayama K, Ishikawa M, Rahman M, Katagiri H, Katagiri A, et al. Fatty acid synthase is a potential therapeutic target in estrogen receptor- /progesterone receptor-positive endometrioid endometrial cancer. Oncology (2013) 84:166–73. 10.1159/000342967 [DOI] [PubMed] [Google Scholar]
Associated Data
This section collects any data citations, data availability statements, or supplementary materials included in this article.
Supplementary Materials
Heatmap of differentially expressed RNAs. (A) The heatmap of 200 randomly selected differentially expressed mRNAs. (B) The heatmap of 70 differentially expressed miRNAs. (C) The heatmap of 200 randomly selected differentially expressed lncRNAs. Red indicates a high level of RNA expression, whereas green indicates low expression.
Paired lncRNA and miRNA. 50 differently expressed lncRNAs and 18 differently expressed miRNAs paired according to the miRcode database.
Paired miRNA and mRNA. 98 differently expressed miRNA-mRNA pairs were identified including 81 mRNAs and 16miRNAs based on the three databases: miRDB, miRTarBase, and TargetScan. Only the mRNAs predicted by all the above three databases defined as the target mRNAs.
Gene ontology function enrichment analysis.
KEGG pathway analysis.
The prognostic differently expressed RNAs involved in ceRNA network by univariate cox regression analysis.
The prognostic differently expressed RNAs involved in ceRNA network by multivariate cox regression analysis. *P < 0.05.


