

Summary
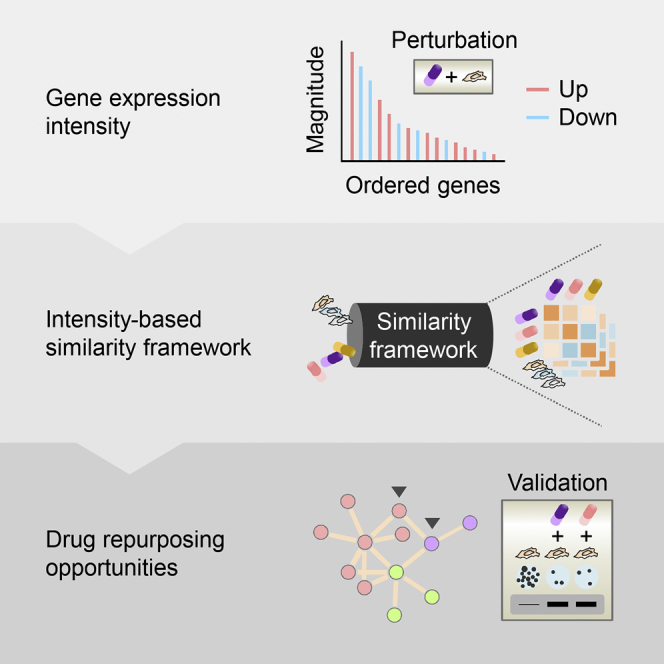
Biological systems often respond to a specific environmental or genetic perturbation without pervasive gene expression changes. Such robustness to perturbations, however, is not reflected on the current computational strategies that utilize gene expression similarity metrics for drug discovery and repositioning. Here we propose a new expression-intensity-based similarity metric that consistently achieved better performance than other state-of-the-art similarity metrics with respect to the gold-standard clustering of drugs with known mechanisms of action. The new metric directly emphasizes the genes exhibiting the greatest changes in expression in response to a perturbation. Using the new framework to systematically compare 3,332 chemical and 3,934 genetic perturbations across 10 cell types representing diverse cellular signatures, we identified thousands of recurrent and cell type-specific connections. We also experimentally validated two drugs identified by the analysis as potential topoisomerase inhibitors. The new framework is a valuable resource for hypothesis generation, functional testing, and drug repositioning.
Subject Areas: Pharmaceutical Science, Genetics, Bioinformatics
Graphical Abstract
Highlights
-
•
Intensity-based similarity metric surpasses other standard metrics in drug clustering
-
•
This metric was applied to compare thousands of compounds for drug repurposing
-
•
Two drugs are experimentally confirmed as potential topoisomerase inhibitors
Pharmaceutical Science; Genetics; Bioinformatics
Introduction
The phenomenon of drug promiscuity (coined as polypharmacology), whereby a single drug can bind to multiple targets (Hopkins, 2007, Hopkins, 2008, Reddy and Zhang, 2013), has revealed new therapeutic indications for marketed drugs (i.e., drug repositioning or repurposing). With recent technological advances, drug repurposing opportunities have been actively explored through computational strategies that use various similarity measures to relate pharmaceutical and experimental compounds, such as chemical similarity (Paolini et al., 2006, Keiser et al., 2009) and side effect similarity (Campillos et al., 2008). Since polypharmacology interactions that a drug might undergo within a cell should faithfully translate into cellular phenotypic responses (Feng et al., 2009, Moffat et al., 2014), similarity approaches that compare gene expression profiles after chemical perturbations are showing considerable promise, from an initial effort to predict the mechanism of action (MoA) of a drug (Hughes et al., 2000). The Connectivity Map (CMap), as a milestone in this field, incorporates gene expression signatures and a rank-based pattern-matching strategy based on the Kolmogorov-Smirnov (KS) (Massey, 1951) statistic embedded in the Gene Set Enrichment Analysis (GSEA) (Subramanian et al., 2005) technique to connect small molecules and diseases (Lamb et al., 2006). CMap can be tailored to interrogate MoAs from a drug network (Iorio et al., 2010), predict new therapeutic indications using drug-disease relationships (Sirota et al., 2011), or map the effects of drugs on the immune system (Kidd et al., 2016). Although the multiplexity of gene expression profiling is seemingly useful, the mathematical and statistical properties of these high-dimensional data still remain poorly understood (Clarke et al., 2008). In high-dimensional spaces, data points are highly correlated, often with spurious relationships (Caldarelli et al., 2004), and distances of a data point to its nearest and farthest neighbors are becoming almost equidistant (Beyer et al., 1999). In addition, when a cell encounters a genetic or environmental stress, changes in gene expression are usually confined to a small number of genes, establishing the robustness of phenotypic traits (Felix and Barkoulas, 2015). However, these aspects of high dimensionality and biological robustness are mostly overlooked in state-of-the-art gene expression similarity approaches. Although CMap and its extension methods have applied data reduction techniques to a chemical perturbagen by generating a gene signature from differential expression analyses (across cell types) (Lamb et al., 2006, Sirota et al., 2011) or by extracting an arbitrary number of genes from a ranked list (merged across cell types) (Iorio et al., 2010, Kidd et al., 2016), the resulting metrics between perturbagens represent “aggregate” similarities in a way that disables cell type-specific discoveries. Moreover, the extent to which the genes selected from these methods represent a chemical perturbagen is currently unclear, owing to the lack of systematic evaluation and comparison of these similarity metrics.
Here, we present a new expression-based similarity framework that exploits the “perturbation intensity” (i.e., the difference in gene expression between perturbed and unperturbed conditions) of individual profiles, rather than aggregate information, to enable cell type-specific discoveries and to identify recurring relationships through a bottom-up approach. The new intensity-based similarity metric was designed not only to reflect the biological robustness to perturbations but also to reduce data dimensionality by simply using the genes showing the greatest changes in expression levels in response to perturbations. This framework was applied to correlate more than 7,000 chemical and genetic perturbagens across 10 different cell types obtained from the Library of Integrated Network-Based Cellular Signatures (LINCS) project (Subramanian et al., 2017). Importantly, clustering analyses using this intensity-based similarity metric produced superior results more often than those using the KS statistic (the state-of-the-art similarity metric [Lamb et al., 2006, Iorio et al., 2010, Sirota et al., 2011, Kidd et al., 2016]), GSEA method (the similarity metric defined using the standard enrichment scores in the original report [Subramanian et al., 2005]), Pearson correlation, or Euclidean distance (two commonly used similarity metrics [D'Haeseleer, 2005]) when grouping a selected set of drugs with diverse MoAs.
We further employed the intensity-based similarity metric to compare perturbation pairs with similar action restricted to one or multiple cell types and effectively recapitulated many well-known drugs as recurrently interconnected groups according to their MoAs. Novel therapeutic indications or previously unknown connectivity for marketed drugs or experimental compounds can be derived using the new metric and the results experimentally tested. For example, using our new approach, pyrvinium pamoate (an anthelmintic) and etacrynic acid (a loop diuretic) were found to connect to a cluster of topoisomerase inhibitors and to irinotecan (a topoisomerase inhibitor), respectively. The topoisomerase-inhibitory action of these two drugs was confirmed in vitro, indicating their potential for repurposing as a broad-spectrum (pyrvinium pamoate) or specific (etacrynic acid) anticancer drug.
Our metric represents a significant improvement over state-of-the-art and commonly used gene expression metrics to capture similar perturbations corroborated through the objective evaluation and comparison of clustering performance.
Results
Workflow of the Intensity-Based Similarity Framework
We leveraged the perturbation intensity of gene expression datasets obtained from LINCS to define a tunable intensity-based similarity metric for scoring large-scale perturbation-induced changes and analyzing the similarities among perturbations (Figure 1). We considered three types of perturbations, namely, exposure to chemical drugs for 6 hr (abbreviated as d6), exposure to chemical drugs for 24 hr (d24), and exposure to short hairpin RNAs for 96 hr (sh96) in 10 selected cell types, because most experiments from LINCS were of these perturbation types and performed in these cell types. The intensity-based similarity metric relates any two given perturbations at the level of genes exhibiting the greatest changes in expression (regardless of the direction of regulation) in response to a perturbation, which is slightly different from the KS metric implemented using the same number of genes at both extremes of a ranked list (Iorio et al., 2010, Kidd et al., 2016). Using a rank-based pattern-matching strategy, our algorithm evaluates the degree of overlap between a gene set of the query perturbation and the genes at the extreme of a ranked list of perturbation intensity of the reference perturbation. The ranks of the perturbation intensity are transformed into a sequence of scores such that, with the leading term being 1, each succeeding term is obtained by multiplying its preceding term by a fixed, non-zero number (<1; as the geometric progression). For each of the two cases in which genes in the gene set match in the same or opposite direction to those in the perturbation intensity, the extent of matching can be quantified as the sum of matched entries in the geometric progression. Finally, the intensity-based similarity metric is derived by taking the difference between these two types of matching scores (“the same” minus “the opposite”) over the theoretical maximum score (i.e., the geometric series; see Transparent Methods).
Figure 1.

Workflow of the Intensity-Based Similarity Framework
We accessed gene expression profiles corresponding to thousands of chemical and genetic perturbations across multiple cell lines from LINCS. To determine optimal parameters for the intensity-based similarity metric (query gene set size b and decay factor σ), we selected 74 chemical compounds corresponding to 10 mechanisms of action (MoAs) as the gold-standard clustering and then used majority voting to choose the most frequently occurring parameter combination that yielded the best clustering performance from their treatments at 6 or 24 hr across 10 cell types. For each metric paired with one clustering method, an optimal clustering was determined across a full range of number of clusters k with the best external cluster validity index F1 score. These intensity-based metrics and resultant clusterings were further compared with other state-of-the-art and commonly used metrics. We then used the optimal parameter set to compute pairwise intensity-based similarities for all available chemical and genetic perturbations and performed in-depth analyses to uncover perturbation pairs recurrently or exclusively similar among multiple cell types. Experimental validation of discoveries was performed for drugs showing immediate repurposing opportunities.
Two independent parameters are introduced in the intensity-based similarity metric to select the number of genes as a query gene set size (parameter b) and to govern the weights of ranks of the perturbation intensity (parameter σ, as the common ratio in the geometric progression). To determine an optimal parameter set, we used a gold-standard clustering (the ground truth) of a selected panel of chemical perturbagens with established primary MoAs manually curated from LINCS (Table S1; for the MoAs of all chemical perturbagens used in this study, see Figure S1 and Table S2). For each chemical perturbation type in a cell type, which we referred to as a “context”, we assessed the clustering performance across a range of parameter sets based on the external cluster validity index F1 score (the harmonic mean between precision and recall, reaching the best value at 1 and the worst at 0) (Wiwie et al., 2015). Figure 2A shows an example clustering result for the context representing A375 cells exposed to chemical perturbations for 6 hr. Using a majority voting scheme, we selected the most frequently occurring parameter set among the top five context-specific intensity-based clusterings across all contexts as the optimal parameter set (b* = 100 and σ* = 0.99; Figure 2B). When we varied the size of the top-scoring clusterings used for voting, this optimal parameter set consistently received the most votes (Figure S2). However, we note that the parameter sets yielding the best clustering results were context specific (Figure S2A), reflecting the biological robustness to different extents across cell types (Felix and Barkoulas, 2015). The parameter sets with an emphasis on much genetic information often received the least votes (b ≥ 1,000 and σ ≥ 0.998; Figures S2A–S2D), consistent with high-dimensional noise in gene expression data (Clarke et al., 2008). Alternatively, when we counted the votes across the bottom-scoring clusterings, the parameter sets that applied far less genetic information usually received the most votes (b = 10 or σ = 0.9; Figure S3), indicating a requirement of a minimum number of genes for distinguishing between chemical perturbations.
Figure 2.

Parameter Optimization, Comparison, and Performance Evaluation
(A) Top 10 intensity-based clusterings along with a comparison of the best clusterings produced by similarity metrics using the KS statistic, GSEA, Pearson correlation, or Euclidean distance in the context of d6 perturbation in A375 cells. For presentation purpose, we show the results using the gene set sizes of 100 and 250 for KS and GSEA metrics. HC-avg, hierarchical clustering using average link. HC-ward, hierarchical clustering using Ward link. PAM, partitioning around medoids; AP, affinity propagation; EBC, exemplar-based agglomerative clustering.
(B) Summary of majority voting results in choosing the best parameter combination for the intensity-based similarity metric. Red box indicates the parameter set that received the most votes in this scheme.
(C) Best F1 scores for clusterings across all contexts (n = 20) using intensity-based metric across all parameter sets or with the optimal parameter set or using KS, GSEA, Pearson-based, or Euclidean-based metric (Wilcoxon two-sided paired signed-rank test for the intensity-based metric compared with [cf.] the other metrics).
(D) Area under the receiver operating characteristic curve (AUROC) performance using the intensity-based metric with the optimal parameter set with respect to the 74-drug gold-standard clustering for each context.
(E) Best AUROC scores across all contexts (n = 20) achieved by the intensity-based metric, or by the KS, GSEA, Pearson-based, or Euclidean-based metric (Wilcoxon two-sided paired signed-rank test for the intensity-based metric compared with [cf.] the other metrics).
*p < 0.05; **p < 0.01; ***p < 0.001; #p < 1 × 10⁻⁴.
Next, we compared our intensity-based similarity metric with two state-of-the-art metrics based on the KS statistic (Lamb et al., 2006, Iorio et al., 2010, Sirota et al., 2011, Kidd et al., 2016) or GSEA method (Subramanian et al., 2005) and two commonly used metrics derived from Pearson correlation or Euclidean distance (D'Haeseleer, 2005) (see Transparent Methods). For KS and GSEA metrics, we considered a range of set sizes for each of the top- and bottom-ranked genes used for their matching algorithms. Across all contexts, the intensity-based metric consistently achieved higher F1 scores than the KS (p < 0.01, Wilcoxon two-sided paired signed-rank test, n = 20), GSEA (p < 0.001), Pearson-based (p < 1 × 10⁻⁴), or Euclidean-based metric (p < 1 × 10⁻⁴; Figure 2C). Despite the context-specific preference for parameter sets, the optimal intensity-based metric still exhibited superior performance than both Pearson- (p < 0.05) and Euclidean-based metrics (p < 1 × 10⁻⁴) and than some of the KS or GSEA metrics obtained with a fixed gene set size (p < 0.05 or 0.01; Figure 2C). For each context, the top five intensity-based clusterings had significantly higher F1 scores than all other common clusterings in general (Figure S4). However, we note that all intensity-based clusterings within each context produced a broader range of F1 scores than those using the KS, GSEA, or Pearson-based metric, but they still had significantly higher F1 scores than those using the Euclidean-based metric (Figure S4). In addition to the F1 score, we also used each metric with respect to the gold-standard clustering to obtain an area under the receiver operating characteristic (ROC) curve (AUROC) as another performance measure (here, representing the ability of a similarity metric to classify drugs into clusters according to their MoAs, reaching the best value at 1 and the worst at 0, with 0.5 generated from random prediction). Of 20 context-specific maximum AUROC scores, nine were achieved by the intensity-based metric, seven by the KS metric, three by the GSEA metric, one by the Euclidean-based metric, and none by the Pearson-based metric (Figure S5). Consistent with the F1 scores, the intensity-based metric exhibited superior AUROC performance than the GSEA (p < 0.05, Wilcoxon two-sided paired signed-rank test, n = 20), Pearson-based (p < 1 × 10⁻⁴), and Euclidean-based metrics (p < 1 × 10⁻⁴) but not the KS metric (p = 0.368), which was slightly compromised for the optimal intensity-based metric (Figures 2D and 2E). In addition, we emphasize that the similarity values themselves produced by a given metric do not correlate with the performance of the metric. For example, among the top metrics in Figure 2A, the KS or GSEA metrics (gene set size = 100 or 250) tended to yield overall higher similarity values than the intensity-based metrics (b = 50 or 100 and σ = 0.9, 0.99, or 0.995; Figure S6), but achieved relatively lower F1 scores than those intensity-based metrics (Figure 2A).
We also evaluated the robustness of the intensity-based, KS, and GSEA similarity metrics to the gene set size (i.e., the query gene set size b for the intensity-based metric with a fixed decay factor σ, or the set size for each of the top- and bottom-ranked genes for the KS or GSEA metric). In general, all of these three similarity metrics were insensitive to variation in the gene set size (Figures S7 and S8).
Given that “one-step clustering” of gene expression profiles is usually unstable (Li et al., 2010), we repeated the analysis for parameter tuning and performance evaluation with resampling of 75% of chemical perturbagens. We found that the selected optimal parameter set (b* = 100 and σ* = 0.99; Figure 2B) received the most votes in 27% rounds of the resampling analysis (Figure S9A), ascertaining the general suitability of this parameter set for clustering analysis. For F1 score performance, the intensity-based metric consistently performed better than the KS or GSEA metric with p < 0.05 (Wilcoxon two-sided paired signed-rank test, n = 20) in >80% rounds of the resampling analysis and also than the Pearson- and Euclidean-based metrics with p < 0.001 in 100% of the analysis (Figure S9B). Consistent with F1 score performance, the intensity-based metric exhibited superior AUROC performance than the KS metric with p < 0.05 in ∼40% of the analysis, the GSEA metric with p < 0.05 in >60% of the analysis, and the Pearson- and Euclidean-based metrics with p < 1 × 10⁻⁴ in ∼100% of the analysis (Figure S9C). Notably, the intensity-based metric was able to achieve significantly higher AUROC performance than the KS metric frequently in the resampling analysis (p < 0.05; Figure S9C), albeit failing to reach statistical significance in the one-step, gold-standard clustering analysis (p = 0.368; Figure 2E). These data corroborated the ability of intensity-based metric to consistently yield better performance than the KS, GSEA, Pearson-based, or Euclidean-based metric for the clustering analysis.
To streamline the systematic analysis, we used the optimal intensity-based metric to compute all pairwise similarities for three perturbation types in 10 cell types (Table S3). For each perturbation type, positive and negative heuristic similarity cutoffs were estimated from the empirical cumulative distribution function (CDF) of perturbation similarity values across cell types, corresponding to CDF values of 0.999 and 0.001, respectively (Figure 3A). We consider these heuristic similarity cutoffs to be very conservative, because the positive heuristic cutoffs were far beyond any matched cutoff defined by Youden's index (Youden, 1950) from the ROC generated by the optimal intensity-based similarity metric for each context (Figure S10). Notably, some perturbation pairs with similarity values above the positive heuristic cutoffs were observed in up to 10 cell types, whereas most perturbation pairs with similarity values below the negative heuristic cutoffs were exclusive to one cell type (Figure 3B). This gives us an impression about the nature of the perturbations that similar responses to perturbations are often observed irrespective of the cell identity, whereas opposite effects between perturbations exhibit cell type specificity. Consistent with this observation, the expected small-molecule connections were recovered by intensity-based similarities when we queried the LINCS dataset using independently derived perturbation intensities of corresponding small molecules (Figure S11).
Figure 3.

Distribution of Intensity-Based Similarity Measures
(A) Empirical cumulative distribution function (CDF) plots of intensity-based similarities for each perturbation type.
(B) The number of cell types in which a perturbation pair was qualified for each perturbation type.
Recurrent Perturbation Pairs across Multiple Cell Types
We next sought to identify perturbation pairs that showed recurrent positive or negative similarities across many cell types and could share mechanistically related actions independent of the cell of origin. To this end, we developed a strategy that combines the intensity-based similarities and a rank-based statistical approach (Jacobsen et al., 2013) modified ad hoc to evaluate the recurrence of similarities across multiple cell types, generating a recurrent similarity score (RSS) for each perturbation pair considered (see Transparent Methods; Figure S12). Using these RSS scores (false discovery rate < 0.001), together with the heuristic similarity cutoffs (by considering perturbation pairs that were qualified in at least three cell types, Figure 3B), we identified 698 recurrent relationships among 203 d6 perturbagens, 399 recurrent relationships among 197 d24 perturbagens, and 575 recurrent relationships among 346 sh96 perturbagens (Figures S13–S15 and Tables S4, S5, and S6). Most of these recurrent relationships were recovered in the analysis with resampling of 60% of cell types (Figure S16). Owing to the scarcity of perturbation pairs qualified with the negative similarities in more than one cell type, no recurrent relationship with negative association was found for any perturbation type.
To explore the recurrent connections between chemical perturbagens, we combined the d6 and d24 recurrent relationships (i.e., “d6 + d24”) as a recurrent drug network (Figure 4). We observed that many widely used compounds and approved drugs were recapitulated as discrete groups according to their MoAs. For example, the histone deacetylase inhibitors vorinostat, panobinostat, and dacinostat were all placed in a single group, as were the cardiac glycosides (digoxin, digitoxin, and ouabain), antimicrotubules (vinblastine, vincristine, and vinorelbine), heat shock protein 90 (HSP90) inhibitors (geldanamycin, tanespimycin, and NVP-AUY922), and lipid-lowering statins (lovastatin, simvastatin, and atorvastatin). Topoisomerase inhibitors were, nevertheless, found in two separate groups (amsacrine, etoposide, and irinotecan in one group, and doxorubicin, daunorubicin, and mitoxantrone in the other). We also note some temporal differences in the drug-drug associations. For some drug classes, recurrent connections did not appear at 6 hr until 24 hr, suggesting delayed drug responses (e.g., statins and antimicrotubules; Figures S17A and S17B). In contrast, associations between protein synthesis inhibitors and cardiac glycosides were recurrent at 6 hr but not at 24 hr, indicative of initially similar pathways diverging later, consistent with the ability of cardiac glycosides to inhibit general protein synthesis (Perne et al., 2009) (Figure S17C). However, most connections (73%, 806 of 1,097) were between drugs of different MoAs, opening up many possibilities for drug repositioning. For example, a subnetwork of the potent protein kinase C (PKC) inhibitor staurosporine comprised substantial associations with other kinase inhibitors (e.g., cyclin-dependent kinase inhibitors, c-Jun N-terminal kinase inhibitors, topoisomerase inhibitors; Figure S17D), consistent with its well-reported polypharmacology profile (Collins and Workman, 2006, Reddy and Zhang, 2013). By contrast, pyrvinium pamoate, a US Food and Drug Administration-approved anthelmintic, was part of a connected component overrepresented by topoisomerase inhibitors (Figure S17E), suggesting a repurposing opportunity for cancer therapy. Functionally related genes might also be reflected on the recurring pairs of genetic perturbations; for example, AURKA (aurora kinase A) knockdown was recurrently similar to knockdown of other genes involving AURKB (Figure S17F), consistent with their coordinated role in mitosis (Goldenson and Crispino, 2015) and reported functional similarity (Fu et al., 2009, Hans et al., 2009).
Figure 4.

Recurrent Similarity Score (RSS) Analysis
Chemical perturbation pairs recurrently similar across cell types are shown as a drug RSS network (merging d6 and d24 perturbations; see Table S10 for network communities and their enrichment analyses). A primary MoA was assigned to each chemical perturbagen, as represented by color coding on the darker side of each icon and the associated text inset. The box below summarizes the total number of occurrences for each primary MoA in the network.
For each recurrent network (d6, d24, sh96, or d6 + d24), we applied unsupervised Markov clustering (Enright et al., 2002) to identify perturbation communities, and determined their enrichments for each of the Molecular Signature Database (Subramanian et al., 2005) gene set collections (Tables S7, S8, S9, and S10). From analyses using hallmark gene sets, several drug communities were statistically enriched for the tumor necrosis factor α-dependent nuclear factor-kappa B (NF-κB) signaling, hypoxia, p53 pathway, apoptosis, mammalian target of rapamycin complex 1 signaling, and unfolded protein response, whereas most genetic perturbation clusters impinged on the KRAS and NF-κB pathways (Figure S18; hypergeometric p < 0.001). Remarkably, drug communities composed of miscellaneous MoAs also displayed functional enrichments. For example, a cluster of 27 drugs containing the PKC inhibitor staurosporine (cl2) was specifically enriched for a KRAS signaling hallmark (p = 1.01 × 10⁻⁶; Figure S18A). By contrast, another cluster of 31 drugs (cl1) showed multiple hallmark enrichments (Figure S18A) and might engage in cytosolic tRNA aminoacylation (p = 9.85 × 10⁻⁹; Figure S19A). The drug cluster consisting not only of topoisomerase inhibitors but also of the anthelmintic pyrvinium pamoate (cl10) was particularly enriched for p53 direct effectors (p = 7.03 × 10⁻¹⁶ for PID_P53_DOWNSTREAM_PATHWAY; Figure S19A). Interestingly, three genetic perturbation clusters (cl5, cl27, and cl28) revealed the enrichments for ATP-binding cassette (ABC) transporters that efflux various small molecules and metabolites from cells (Fletcher et al., 2010) (p = 4.34 × 10−64 for KEGG_ABC_TRANSPORTERS; Figure S19B), of which one cluster (cl27) contained a knockdown of TIMP4 (TIMP metallopeptidase inhibitor 4), the overexpression of which has been shown to increase ABCB1 and ABCG2 transcripts (Lizarraga et al., 2016). Of the drug communities, 76% were significantly enriched for at least one of the immunologic signatures (Figure S20; p < 0.0001), consistent with the profound influence of chemical perturbations on the immune system (Kidd et al., 2016).
Perturbation Pairs with Cell Type Specificity
We also explored the cell type specificity of perturbation similarities using an analogous definition of a metric based on information entropy (Schug et al., 2005) (see Transparent Methods). For each perturbation type (d6, d24, or sh96), we calculated the similarity specificities for all available perturbation pairs. We found that most perturbation pairs exhibited low specificity for a particular cell type (Figure S21), consistent with the nature of perturbations to induce similar effects across many cell types (Figure 3B). Using the corresponding CDFs of the similarity specificities, we identified 1,148 highly specific similarity (HSS) pairs for d6, 204 HSS pairs for d24, and 269 HSS pairs for sh96 (Tables S11, S12, and S13; a network for d24 is shown in Figure 5). A substantial proportion of HSS pairs was associated with negative similarity scores (32%, 51%, and 83% for d6, d24, and sh96, respectively), consistent with their cell type-exclusive distributions (Figure 3B). For chemical perturbagens, the HSS relationships included almost entirely different MoAs (99% and 96% for d6 and d24, respectively), suggesting that certain molecular contexts, rather than solely MoAs, dominated cellular responses and consequences following these perturbations.
Figure 5.

Highly Specific Similarity (HSS) Analysis
Chemical pairs of d24 perturbation with cell type specificity are displayed as a d24 HSS network. A primary MoA is assigned to each chemical perturbagen and color coded on the darker side of each icon and the associated text inset. The box below summarizes the total number of occurrences for each primary MoA in the network.
Validation of Discoveries with Repurposing Potential
We performed in vitro experiments to validate one recurrent (from RSS) and one cell type-specific (from HSS) relationship with great promise for repurposing in oncology: pyrvinium pamoate (Thorne et al., 2010, Chen et al., 2017) and etacrynic acid (Lu et al., 2009). From the recurrent drug network, pyrvinium pamoate was recurrently similar to a cluster of topoisomerase inhibitors, suggesting a likely antineoplastic activity against a broad spectrum of cancers. In contrast, the loop diuretic etacrynic acid was exclusively connected to the topoisomerase inhibitor irinotecan in MCF7 cells (similarity = 0.48), but not in the other cell lines screened (similarities ≈0; Table S12), indicating cell type-specific toxicity. Using proliferation and clonogenic assays, we confirmed the widespread cytotoxic effects of pyrvinium pamoate in MCF7 and A549 cells (two human cancer cell lines included in this study) as well as in H1299 and H1975 (two other human non-small-cell lung cancer cell lines not included in this study), and also confirmed the selective killing of etacrynic acid in MCF7 but not in A549 cells (Figures 6A and 6B). Western blot analysis further demonstrated that pyrvinium pamoate and etacrynic acid induced DNA damage responses, such as increased γH2AX (i.e., phosphorylated histone variant H2AX on serine 139) and p53 induction (Figure 6C), in the drug-sensitive cell lines. The levels of TOP2A (DNA topoisomerase II alpha) and its major phosphorylation site in the catalytic domain on serine 1106 (TOP2A Ser1106) (Chikamori et al., 2003) were slightly elevated by these agents to various extents (Figure 6C), consistent with trapping of TOP2A-DNA covalent complexes by known TOP2 poisons (Nitiss, 2009).
Figure 6.

Experimental Validation
We verified that the US Food and Drug Administration-approved anthelmintic drug pyrvinium pamoate and the loop diuretic etacrynic acid showed RSS and HSS connections to topoisomerase inhibitors, respectively.
(A) Cell viability assays using MTS dye for pyrvinium pamoate in MCF7 and A549 cells (in this study) as well as H1299 and H1975 cells (not in this study) and etacrynic acid in MCF7 cells (effective) and A549 cells (ineffective) at indicated dosage and time duration. Error bars, SEM. Three technical replicates were performed for each of the three independent biological replicates.
(B) Clonogenic assays for pyrvinium pamoate (10 μM) or etacrynic acid (100 μM) in cell lines as indicated for 14 days. Error bars, SEM. Three technical replicates were performed for each of the three independent biological replicates (two-sided unpaired Student's t test p values).
(C) Western blot analyses revealed that pyrvinium pamoate (10 μM) and etacrynic acid (100 μM) induced DNA damage responses in drug-sensitive cell lines. H1299 cells harbor homozygous partial deletion of TP53 and therefore do not express p53 protein. Shown are representative results from one of three independent experiments.
Discussion
We developed an intensity-based similarity metric using the genes exhibiting the greatest changes in expression in response to perturbation. This new metric surpassed the state-of-the-art KS metric and other commonly used metrics in a clustering task of given known drugs, suggesting that expression intensity is a reliable proxy to represent a perturbation. In contrast to those studies that apply the KS metric to an aggregate ranked list across multiple cell types or tissues (Lamb et al., 2006, Iorio et al., 2010, Sirota et al., 2011, Kidd et al., 2016), our framework considers the intensity-based metric at the single-condition level, which enables cell type-specific discoveries and the identification of recurring relationships through a bottom-up approach. In lieu of a heuristic search from a narrow window of possible gene set sizes used for their matching algorithms (Iorio et al., 2010, Kidd et al., 2016), our framework provides a strategy using a predefined ground truth clustering to interrogate the optimal parameters for the intensity-based similarity metric (b and σ) across a broad range of parameter space.
The intensity-based similarity metric, similar to the KS and GSEA metrics, offers an advantage over the Pearson-based or Euclidean-based metric when it is only possible to use a small number of the most influential genes in a given unknown condition, even though there seems to be a minimum number of genes to adequately distinguish between chemical perturbations (≥50; Figure S3). Owing to the lack of a way to define a gold standard for genetic perturbations, we did not explicitly tune the intensity-based similarity metric for the genetic perturbation. Despite this, some of the known functionally related genes can still be revealed by using the optimal intensity-based similarity metric derived for the chemical perturbation.
The superior clustering performance achieved by the intensity-based similarity metric indicates that the way we created this metric is more compatible with the pervasive robustness to perturbation in biological systems (Felix and Barkoulas, 2015) and the dimensionality reduction scheme for exploring gene expression data (Clarke et al., 2008). However, compared with KS and GSEA metrics, the intensity-based similarity metric produced a broader range of F1 scores and seemed to be more sensitive to the choice of clustering method (Figure S4). This, together with the poor performance for the intensity-based similarity metric with minimal genetic information (∼10 genes; Figure S3) suggests that the KS or GSEA metric might be more appropriate in the cases when only tens of genes are available for a condition.
The temporal differences observed in some drug connections pose a potential limitation to the gene expression similarity. Cellular responses to specific chemical perturbagens might only become apparent (for antimicrotubules and statins) or may be unambiguous (between cardiac glycosides and protein synthesis inhibitors) after prolonged treatment. In these cases, attempts to capture drug MoAs by using the phenotypic effects on gene expression at early time points might be frustrating. Nonetheless, this can be seen as an added benefit of the gene expression similarity for improving our knowledge of the molecular events behind chemical perturbations.
A substantial fraction of the recurrent connections spanned promiscuous small-molecule kinase inhibitors, consistent with the polypharmacology interactions for this drug family (Paolini et al., 2006, Knight et al., 2010). Enrichment analysis further indicated that such polypharmacological communities were significantly enriched for functionally distinct pathways and processes. These findings have potential clinical significance in that even some marketed drugs sharing the same MoAs were associated with disparate biological clusters, which in turn might correlate with therapeutic responses. For example, the majority of drugs that target topoisomerase II (TOP2) were found in two drug communities: one includes most anthracyclines as a promiscuous cluster, whereas the other contains the epipodophyllotoxins such as etoposide and other TOP1 inhibitors (Figure 4). This discrepancy may support the hypothesis that anthracyclines mainly act against targets other than TOP2 (Gewirtz, 1999), which is consistent with the clinical rationale for combining etoposide and an anthracycline through its “beneficial” polypharmacological interactions (Nitiss, 2009), but probably the anthracycline-induced cardiotoxicity is a consequence of “harmful” off-target activities (Gewirtz, 1999, Nitiss, 2009). However, the extensive use of these current TOP2-targeting drugs is limited due to the increased risk of developing secondary malignancies (Nitiss, 2009); there is an urgent need to identify novel TOP2-targeting drugs with greater potency, but fewer undesirable effects, and a new way to incorporate them into clinical regimens.
Previous studies have shown that pyrvinium pamoate (Thorne et al., 2010, Chen et al., 2017) and etacrynic acid (Lu et al., 2009) exert anticancer activity by targeting the Wnt signaling pathway. Through systematically analyzing gene expression similarities, we emphasize that these drugs show their capabilities to induce DNA damage responses via topoisomerase inhibition. A careful evaluation of the polypharmacology and toxicity profiles of these compounds is required to address the opportunities for clinical development as improved TOP2-targeting agents.
Overall, we believe that our intensity-based similarity framework and the new similarity metric represent a significant step forward in the field of gene expression similarity. We have suggested a generally applicable parameter set for the intensity-based similarity metric for analyzing chemical perturbations, although it can even be fine-tuned in many relevant tasks for context-specific purpose. Moreover, data from our unbiased analysis are a useful resource for many repurposing opportunities that could potentially lead to some fast-track approvals for clinical use in the future.
Limitations of the Study
Although we have demonstrated that the intensity-based, KS, and GSEA similarity metrics are generally robust to variations in the gene set size (Figures S7 and S8), the intensity-based metric was found to achieve relatively poor performance when an insufficiently small amount of genetic information was used (b = 10 or σ = 0.9, among all parameter sets considered; Figure S3). This suggests that the KS or GSEA metric might be more appropriate than the intensity-based metric in cases in which only about 10 genes are allowed. Nevertheless, the use of gene expression similarity for drug repurposing relies on the cellular phenotypic responses to chemical perturbations; therefore, a potential caveat could be that some of the compound mechanisms are not able to be faithfully translated into the transcriptional changes in cells assayed at given time points.
Methods
All methods can be found in the accompanying Transparent Methods supplemental file.
Acknowledgments
This work was supported by the Ministry of Science and Technology (NSC 102-2628-B-002-041-MY3, MOST 103-2320-B-010-031-MY3, MOST 104-2628-E-010-001-MY3, and MOST 105-2320-B-002-057-MY3) and the National Health Research Institutes (NHRI-EX106-10530PI) in Taiwan.
Author Contributions
H.-C.H. and H.-F.J. defined the research theme and supervised the work. C.-T.H. analyzed all data. C.-H.H. performed the validation experiments. Y.-J.O. helped with data analysis. C.-T.H., H.-C.H., and H.-F.J. conceived the research, interpreted the results, and wrote the paper.
Declaration of Interests
The authors declare no competing interests.
Published: September 28, 2018
Footnotes
Supplemental Information includes Transparent Methods, 21 figures, and 13 tables and can be found with this article online at https://doi.org/10.1016/j.isci.2018.08.017.
Contributor Information
Hsuan-Cheng Huang, Email: hsuancheng@ym.edu.tw.
Hsueh-Fen Juan, Email: yukijuan@ntu.edu.tw.
Supplemental Information
References
- Beyer, K., Goldstein, J., Ramakrishnan, R., and Shaft, U. (1999). When is "nearest neighbor" meaningful? Proc. 7th Int. Conf. Database Theory 1540, 217–235.
- Caldarelli G., Pastor-Satorras R., Vespignani A. Structure of cycles and local ordering in complex networks. Eur. Phys. J. B. 2004;38:183–186. [Google Scholar]
- Campillos M., Kuhn M., Gavin A.C., Jensen L.J., Bork P. Drug target identification using side-effect similarity. Science. 2008;321:263–266. doi: 10.1126/science.1158140. [DOI] [PubMed] [Google Scholar]
- Chen B., Ma L., Paik H., Sirota M., Wei W., Chua M.S., So S., Butte A.J. Reversal of cancer gene expression correlates with drug efficacy and reveals therapeutic targets. Nat. Commun. 2017;8:16022. doi: 10.1038/ncomms16022. [DOI] [PMC free article] [PubMed] [Google Scholar]
- Chikamori K., Grabowski D.R., Kinter M., Willard B.B., Yadav S., Aebersold R.H., Bukowski R.M., Hickson I.D., Andersen A.H., Ganapathi R. Phosphorylation of serine 1106 in the catalytic domain of topoisomerase II alpha regulates enzymatic activity and drug sensitivity. J. Biol. Chem. 2003;278:12696–12702. doi: 10.1074/jbc.M300837200. [DOI] [PubMed] [Google Scholar]
- Clarke R., Ressom H.W., Wang A., Xuan J., Liu M.C., Gehan E.A., Wang Y. The properties of high-dimensional data spaces: implications for exploring gene and protein expression data. Nat. Rev. Cancer. 2008;8:37–49. doi: 10.1038/nrc2294. [DOI] [PMC free article] [PubMed] [Google Scholar]
- Collins I., Workman P. New approaches to molecular cancer therapeutics. Nat. Chem. Biol. 2006;2:689–700. doi: 10.1038/nchembio840. [DOI] [PubMed] [Google Scholar]
- D'Haeseleer P. How does gene expression clustering work? Nat. Biotechnol. 2005;23:1499–1501. doi: 10.1038/nbt1205-1499. [DOI] [PubMed] [Google Scholar]
- Enright A.J., Van Dongen S., Ouzounis C.A. An efficient algorithm for large-scale detection of protein families. Nucleic Acids Res. 2002;30:1575–1584. doi: 10.1093/nar/30.7.1575. [DOI] [PMC free article] [PubMed] [Google Scholar]
- Felix M.A., Barkoulas M. Pervasive robustness in biological systems. Nat. Rev. Genet. 2015;16:483–496. doi: 10.1038/nrg3949. [DOI] [PubMed] [Google Scholar]
- Feng Y., Mitchison T.J., Bender A., Young D.W., Tallarico J.A. Multi-parameter phenotypic profiling: using cellular effects to characterize small-molecule compounds. Nat. Rev. Drug Discov. 2009;8:567–578. doi: 10.1038/nrd2876. [DOI] [PubMed] [Google Scholar]
- Fletcher J.I., Haber M., Henderson M.J., Norris M.D. ABC transporters in cancer: more than just drug efflux pumps. Nat. Rev. Cancer. 2010;10:147–156. doi: 10.1038/nrc2789. [DOI] [PubMed] [Google Scholar]
- Fu J., Bian M., Liu J., Jiang Q., Zhang C. A single amino acid change converts Aurora-A into Aurora-B-like kinase in terms of partner specificity and cellular function. Proc. Natl. Acad. Sci. USA. 2009;106:6939–6944. doi: 10.1073/pnas.0900833106. [DOI] [PMC free article] [PubMed] [Google Scholar]
- Gewirtz D.A. A critical evaluation of the mechanisms of action proposed for the antitumor effects of the anthracycline antibiotics adriamycin and daunorubicin. Biochem. Pharmacol. 1999;57:727–741. doi: 10.1016/s0006-2952(98)00307-4. [DOI] [PubMed] [Google Scholar]
- Goldenson B., Crispino J.D. The aurora kinases in cell cycle and leukemia. Oncogene. 2015;34:537–545. doi: 10.1038/onc.2014.14. [DOI] [PMC free article] [PubMed] [Google Scholar]
- Hans F., Skoufias D.A., Dimitrov S., Margolis R.L. Molecular distinctions between Aurora A and B: a single residue change transforms Aurora A into correctly localized and functional Aurora B. Mol. Biol. Cell. 2009;20:3491–3502. doi: 10.1091/mbc.E09-05-0370. [DOI] [PMC free article] [PubMed] [Google Scholar]
- Hopkins A.L. Network pharmacology. Nat. Biotechnol. 2007;25:1110–1111. doi: 10.1038/nbt1007-1110. [DOI] [PubMed] [Google Scholar]
- Hopkins A.L. Network pharmacology: the next paradigm in drug discovery. Nat. Chem. Biol. 2008;4:682–690. doi: 10.1038/nchembio.118. [DOI] [PubMed] [Google Scholar]
- Hughes T.R., Marton M.J., Jones A.R., Roberts C.J., Stoughton R., Armour C.D., Bennett H.A., Coffey E., Dai H., He Y.D. Functional discovery via a compendium of expression profiles. Cell. 2000;102:109–126. doi: 10.1016/s0092-8674(00)00015-5. [DOI] [PubMed] [Google Scholar]
- Iorio F., Bosotti R., Scacheri E., Belcastro V., Mithbaokar P., Ferriero R., Murino L., Tagliaferri R., Brunetti-Pierri N., Isacchi A. Discovery of drug mode of action and drug repositioning from transcriptional responses. Proc. Natl. Acad. Sci. USA. 2010;107:14621–14626. doi: 10.1073/pnas.1000138107. [DOI] [PMC free article] [PubMed] [Google Scholar]
- Jacobsen A., Silber J., Harinath G., Huse J.T., Schultz N., Sander C. Analysis of microRNA-target interactions across diverse cancer types. Nat. Struct. Mol. Biol. 2013;20:1325–1332. doi: 10.1038/nsmb.2678. [DOI] [PMC free article] [PubMed] [Google Scholar]
- Keiser M.J., Setola V., Irwin J.J., Laggner C., Abbas A.I., Hufeisen S.J., Jensen N.H., Kuijer M.B., Matos R.C., Tran T.B. Predicting new molecular targets for known drugs. Nature. 2009;462:175–181. doi: 10.1038/nature08506. [DOI] [PMC free article] [PubMed] [Google Scholar]
- Kidd B.A., Wroblewska A., Boland M.R., Agudo J., Merad M., Tatonetti N.P., Brown B.D., Dudley J.T. Mapping the effects of drugs on the immune system. Nat. Biotechnol. 2016;34:47–54. doi: 10.1038/nbt.3367. [DOI] [PMC free article] [PubMed] [Google Scholar]
- Knight Z.A., Lin H., Shokat K.M. Targeting the cancer kinome through polypharmacology. Nat. Rev. Cancer. 2010;10:130–137. doi: 10.1038/nrc2787. [DOI] [PMC free article] [PubMed] [Google Scholar]
- Lamb J., Crawford E.D., Peck D., Modell J.W., Blat I.C., Wrobel M.J., Lerner J., Brunet J.P., Subramanian A., Ross K.N. The Connectivity map: using gene-expression signatures to connect small molecules, genes, and disease. Science. 2006;313:1929–1935. doi: 10.1126/science.1132939. [DOI] [PubMed] [Google Scholar]
- Li J., Lenferink A.E., Deng Y., Collins C., Cui Q., Purisima E.O., O'Connor-McCourt M.D., Wang E. Identification of high-quality cancer prognostic markers and metastasis network modules. Nat. Commun. 2010;1:34. doi: 10.1038/ncomms1033. [DOI] [PMC free article] [PubMed] [Google Scholar]
- Lizarraga F., Espinosa M., Ceballos-Cancino G., Vazquez-Santillan K., Bahena-Ocampo I., Schwarz-Cruz Y.C.A., Vega-Gordillo M., Garcia Lopez P., Maldonado V., Melendez-Zajgla J. Tissue inhibitor of metalloproteinases-4 (TIMP-4) regulates stemness in cervical cancer cells. Mol. Carcinog. 2016;55:1952–1961. doi: 10.1002/mc.22442. [DOI] [PubMed] [Google Scholar]
- Lu D., Liu J.X., Endo T., Zhou H., Yao S., Willert K., Schmidt-Wolf I.G., Kipps T.J., Carson D.A. Ethacrynic acid exhibits selective toxicity to chronic lymphocytic leukemia cells by inhibition of the Wnt/beta-catenin pathway. PLoS One. 2009;4:e8294. doi: 10.1371/journal.pone.0008294. [DOI] [PMC free article] [PubMed] [Google Scholar]
- Massey F.J. The Kolmogorov-Smirnov test for goodness of fit. J. Am. Stat. Assoc. 1951;46:68–78. [Google Scholar]
- Moffat J.G., Rudolph J., Bailey D. Phenotypic screening in cancer drug discovery - past, present and future. Nat. Rev. Drug Discov. 2014;13:588–602. doi: 10.1038/nrd4366. [DOI] [PubMed] [Google Scholar]
- Nitiss J.L. Targeting DNA topoisomerase II in cancer chemotherapy. Nat. Rev. Cancer. 2009;9:338–350. doi: 10.1038/nrc2607. [DOI] [PMC free article] [PubMed] [Google Scholar]
- Paolini G.V., Shapland R.H., van Hoorn W.P., Mason J.S., Hopkins A.L. Global mapping of pharmacological space. Nat. Biotechnol. 2006;24:805–815. doi: 10.1038/nbt1228. [DOI] [PubMed] [Google Scholar]
- Perne A., Muellner M.K., Steinrueck M., Craig-Mueller N., Mayerhofer J., Schwarzinger I., Sloane M., Uras I.Z., Hoermann G., Nijman S.M. Cardiac glycosides induce cell death in human cells by inhibiting general protein synthesis. PLoS One. 2009;4:e8292. doi: 10.1371/journal.pone.0008292. [DOI] [PMC free article] [PubMed] [Google Scholar]
- Reddy A.S., Zhang S. Polypharmacology: drug discovery for the future. Expert Rev. Clin. Pharmacol. 2013;6:41–47. doi: 10.1586/ecp.12.74. [DOI] [PMC free article] [PubMed] [Google Scholar]
- Schug J., Schuller W.P., Kappen C., Salbaum J.M., Bucan M., Stoeckert C.J., Jr. Promoter features related to tissue specificity as measured by Shannon entropy. Genome Biol. 2005;6:R33. doi: 10.1186/gb-2005-6-4-r33. [DOI] [PMC free article] [PubMed] [Google Scholar]
- Sirota M., Dudley J.T., Kim J., Chiang A.P., Morgan A.A., Sweet-Cordero A., Sage J., Butte A.J. Discovery and preclinical validation of drug indications using compendia of public gene expression data. Sci. Transl. Med. 2011;3:96ra77. doi: 10.1126/scitranslmed.3001318. [DOI] [PMC free article] [PubMed] [Google Scholar]
- Subramanian A., Narayan R., Corsello S.M., Peck D.D., Natoli T.E., Lu X., Gould J., Davis J.F., Tubelli A.A., Asiedu J.K. A next generation connectivity map: L1000 platform and the first 1,000,000 profiles. Cell. 2017;171:1437–1452.e17. doi: 10.1016/j.cell.2017.10.049. [DOI] [PMC free article] [PubMed] [Google Scholar]
- Subramanian A., Tamayo P., Mootha V.K., Mukherjee S., Ebert B.L., Gillette M.A., Paulovich A., Pomeroy S.L., Golub T.R., Lander E.S. Gene set enrichment analysis: a knowledge-based approach for interpreting genome-wide expression profiles. Proc. Natl. Acad. Sci. USA. 2005;102:15545–15550. doi: 10.1073/pnas.0506580102. [DOI] [PMC free article] [PubMed] [Google Scholar]
- Thorne C.A., Hanson A.J., Schneider J., Tahinci E., Orton D., Cselenyi C.S., Jernigan K.K., Meyers K.C., Hang B.I., Waterson A.G. Small-molecule inhibition of Wnt signaling through activation of casein kinase 1alpha. Nat. Chem. Biol. 2010;6:829–836. doi: 10.1038/nchembio.453. [DOI] [PMC free article] [PubMed] [Google Scholar]
- Wiwie C., Baumbach J., Rottger R. Comparing the performance of biomedical clustering methods. Nat. Methods. 2015;12:1033–1038. doi: 10.1038/nmeth.3583. [DOI] [PubMed] [Google Scholar]
- Youden W.J. Index for rating diagnostic tests. Cancer. 1950;3:32–35. doi: 10.1002/1097-0142(1950)3:1<32::aid-cncr2820030106>3.0.co;2-3. [DOI] [PubMed] [Google Scholar]
Associated Data
This section collects any data citations, data availability statements, or supplementary materials included in this article.