Short abstract
Objectives
This study aimed to examine the change and significance of immune parameters in patients with sputum smear-positive pulmonary tuberculosis (TB) after 2 months of intensive phase anti-TB treatment.
Methods
The immune parameters of 232 cases of sputum smear-positive pulmonary TB were detected before and after 2 months of intensive phase anti-TB treatment and compared with 50 cases from healthy volunteers (controls). The T lymphocyte cell population in peripheral blood was detected using flow cytometry. Serum levels of interleukin (IL)-1β, soluble interleukin-2 receptor, IL-6, and tumour necrosis factor-α were measured by ELISA.
Results
After 2 months of intensive phase anti-TB treatment, a reduction in the percentage of CD4+ T cells showed a significant restoration similar to that of controls. Moreover, after intensive anti-TB treatment, serum levels of IL-1β, soluble interleukin-2 receptor, IL-6, and tumour necrosis factor-α were significantly decreased compared with before treatment. Additionally, serum levels of IL-1β and IL-6 showed a diminished recovery compared with controls.
Conclusions
Our findings suggest immunological recovery in patients with pulmonary TB after intensive phase treatment. Therefore, serum cytokine levels are considered potential host biomarkers for monitoring the response of treatment for pulmonary TB.
Keywords: Pulmonary tuberculosis, cytokine, CD4+ T cells, anti-tuberculosis treatment, interleukin, lymphocyte
Introduction
Tuberculosis (TB) is a public health problem worldwide, especially in developing countries, such as China and India. According to report from the World Health Organization, there were an estimated 10.4 million people who were newly diagnosed with active TB and 1.4 million TB deaths in 2015.1 China is one of 30 high TB burden countries, but although the prevalence of TB is gradually decreasing, TB remains a critical threat to public health. Transmission of Mycobacterium tuberculosis (Mtb) occurs by inhalation of droplets containing these bacilli in sputum of patients with active TB. Advancing the ability of monitoring the chemotherapy response and examining molecular markers to confirm adequate treatment are important for control and management of TB globally.2,3
Previous studies have shown that the outcome of TB partly depends on the host immunity by activating immune cells and inducing a spectrum of elaborate cytokines.4,5 Detection of lymphocyte populations and related cytokines in the circulation in patients with TB can characterize these responses. We hypothesize that an immune molecule or the immune response is a useful biomarker for monitor the response of treatment for pulmonary TB. The low reversion rate of interferon-γ (IFN-γ) release assays indicates that IFN-γ is unlikely to be a promising biomarker for monitoring treatment. Previous researchers have reported various candidate biomarkers for monitoring treatment of TB, including interleukin (IL)-1β, soluble interleukin-2 receptor (SIL-2R), tumour necrosis factor (TNF)-α, IL-6, and IL-10.6,7 However, these studies have reported different results.
In this study, we investigated changes in the serum cytokines IL-1β, sIL-2R, IL-6, and TNF-α, and the lymphocyte subpopulation (CD4+ T cells, CD8+ T cells, CD4+/CD8+ ratio) in patients who were newly diagnosed with sputum smear-positive pulmonary TB before and after 2 months of intensive phase chemotherapy.8 Our research focussed on patients with smear-positive pulmonary TB because they are highly contagious and can be monitored for the speed of bacteriological conversion after anti-TB treatment. Our findings on immune response changes in patients with smear-positive TB who underwent intensive phase anti-TB treatment may further clarify the importance of these responses as a biomarker of hosts with TB.
Methods
Study participants
We reviewed all patients who were diagnosed with active TB in Shanghai Pulmonary Hospital during January 2015 to December 2015. The diagnosis of pulmonary TB was according to clinical manifestations and radiological features of thoracic computed tomography. A definite diagnosis was obtained through Mtb-positive sputum culture. Inclusion criteria were as follows: (1) patients newly diagnosed with sputum smear-positive pulmonary TB; (2) aged from 18 to 60 years; (3) no previous history of anti-TB chemotherapy; (4) seronegative for human immunodeficiency virus (HIV); and (5) no systemic autoimmune diseases or immune suppressive therapy history. The criterion for positive sputum smears was positivity for acid-fast bacilli in the initial sputum smear. Sputum smear grades were divided into 1+, 2+, and 3+, and these grades were used to assess the burden of bacteria.
Healthy volunteers were enrolled from a population who attended a health check-up in our hospital. The criteria for health volunteers were as follows: (1) seronegative for HIV; (2) no systemic autoimmune diseases; and (3) no history of immune suppressive therapy.
This investigation was approved by Shanghai Pulmonary Hospital Ethics Committee. Each participant understood and signed written informed consent.
All of the patients received directly observed treatment short-course according to international guidelines.8 The intensive phase anti-TB treatment was the standard four-drug regimen, which consisted of isoniazid, rifampicin, pyrazinamide, and ethambutol (HREZ), and was administered for 2 months. The dosages of the four drugs were 300 mg isoniazid, 450 to 600 mg rifampicin, 750 mg ethambutol, and 1500 mg pyrazinamide per day. Patients who weighed less than 50 kg received 450 mg rifampicin per day, while those who weighed more than 50 kg received 600 mg rifampicin per day according to international guidelines.
Specimen collection and processing
Samples of peripheral blood and serum were obtained through venous puncture from patients before and after 2 months of intensive phase treatment. The serum cytokines IL-1β, sIL-2R, IL-6, and TNF-α were measured by commercially available ELISA kits (Siemens Healthcare Diagnostics Products Ltd., Llanberis, Gwynedd, UK) according to the manufacturer’s instructions. Each sample was detected in duplicate and cytokine concentrations were calculated using standard curves. T lymphocyte subpopulations were quantitatively detected by flow cytometry (FC500; Beckman Coulter, Brea, CA, USA). Whole blood lymphocyte subsets were identified using Cyto-STAT tetraCHROME CD45-FITC/CD4-RD1/CD8-ECD/CD3-PC5 (Beckman Coulter). Data were analysed using CXP analysis software (Beckman Coulter).
Acid-fast bacilli smears and culture assays
Morning sputum specimens were obtained before anti-TB treatment. Sputum samples were routinely tested by smear fluorescence microscopy and by culture strain identification on Lowenstein–Jensen medium, according to World Health Organization guidelines.9 All tests were performed at the TB laboratory in Shanghai Pulmonary Hospital, and quality control was routinely performed.
INF-γ release assays
All participants’ blood samples were collected in sodium heparin tubes for QuantiFERON-TB Gold in Tube (Cellestis Limited, Carnegie, Victoria, Australia) assays. All assays were performed following the manufacturer’s instructions.
Statistical analysis
Statistical analyses were carried out using GraphPad PRISM Version 6.0 (GraphPad Software, Inc., La Jolla, CA, USA). The immune parameters of three groups (TB before treatment, after intensive treatment, and healthy individuals) were compared by the nonparametric Kruskal–Wallis test. The Mann–Whitney U test was used to determine significance between two unpaired groups. The Wilcoxon test was used to compare T cell subpopulations and cytokine levels before and after treatment. A difference was considered significant when the P value was less than 0.05.
Results
Patients
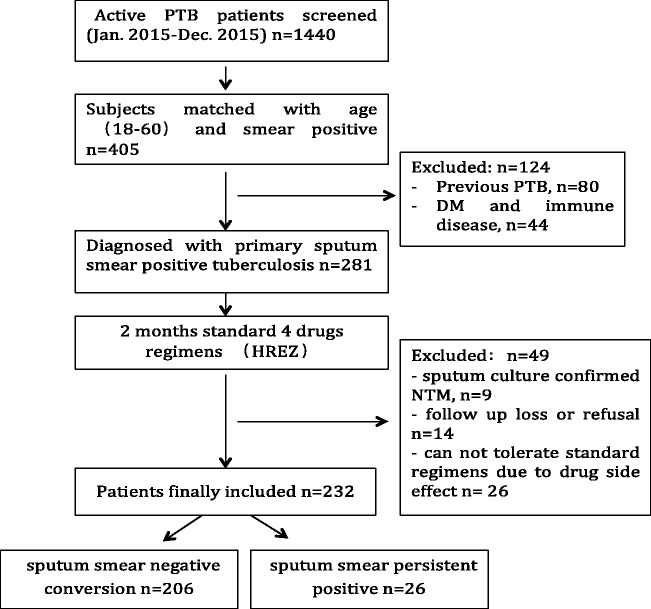
A total of 1440 hospitalized patients who were diagnosed with active pulmonary TB were screened in the study. A total of 405 patients were diagnosed with sputum smear-positive pulmonary TB, and were aged from 18 to 60 years. After exclusion of 80 patients who had previous exposure to antibiotic therapy for TB and 44 patients with diabetes mellitus, HIV, or autoimmune diseases, a total of 281 patients underwent standard four-drug regimen (HREZ) treatment. During 2 months of intensive anti-TB treatment, 49 patients were excluded because sputum culture confirmed non-TB mycobacteria, they refused to complete treatment or were lost to follow-up, or they could not tolerate the standard procedure. Finally, a total of 232 patients were enrolled in the analysis. After 2 months of intensive anti-TB treatment, 206 patients showed sputum smear-negative conversion. The sputum smear was determined as negative only when three consecutive sputum samples, which were collected on different days, were negative for acid-fast bacilli. Figure 1 shows a flow chart of this study. Table 1 shows demographic details of the study groups.
Figure 1.
Flow chart of enrolment of patients.
Table 1.
Demographic characteristics of the study groups
| Tuberculosis group (n = 232) | Control group (n = 50) | |
|---|---|---|
| Age (y) | 37.6 (13.9) | 34.9 (8.5) |
| Male | 125 (53.9%) | 29 (58.0%) |
| Female | 107 (46.1%) | 21 (42.0%) |
| Smoking | ||
| Never smoker | 89 (38.4%) | 31 (62.0%) |
| Former smoker | 102 (44.0%) | 11 (22.0%) |
| Current smoker | 41 (17.6%) | 8 (16.0%) |
| With comorbidity | ||
| Cardiac disease | 11 (4.7%) | 2 (4.0%) |
| Liver disease | 15 (6.5%) | 3 (6.0%) |
| Smear grade | ||
| 1+ | 85 (36.6%) | N/A |
| 2+ | 82 (35.3%) | N/A |
| 3+ | 65 (28.1%) | N/A |
| QFT positive | 211 (90.9%) | 0 (0) |
Data are presented as number of patients (percent) or mean (standard deviation). QFT, QuantiFERON-TB; N/A, not applicable.
Dynamic changes in CD4+ T cells, CD8+ T cells, and the CD4+/CD8+ ratio among individuals with TB before and after 2 months of treatment, and in controls
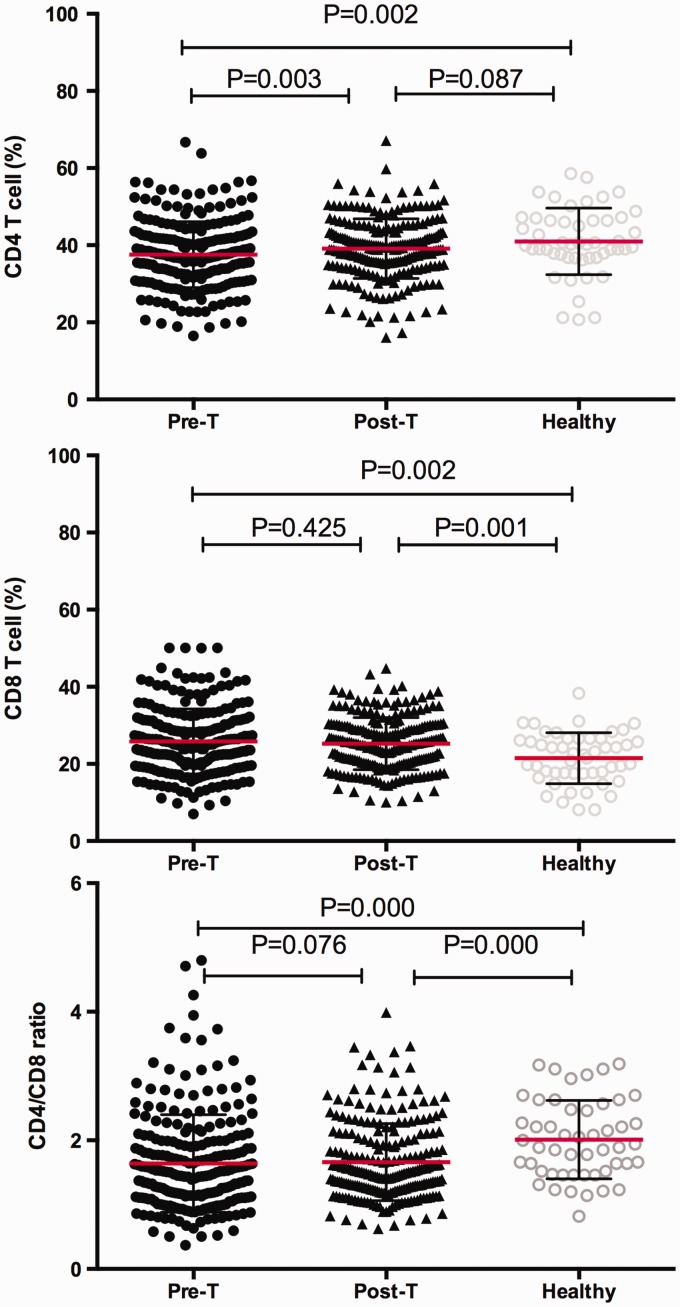
The changes in CD4+ T cells, CD8+T cells, and the CD4+/CD8+ ratio of patients with TB before and after treatment were compared with controls (Figure 2). The proportion of peripheral blood CD4+T cells and the CD4+/CD8+ ratio in patients with TB before treatment were significantly lower than those in controls (P = 0.002, P < 0.001, respectively). The proportion of CD8+T cells in TB patients before treatment was significantly higher than that in controls (P = 0.002). After 2 months of intensive phase treatment, the reduction in CD4+T cells and the CD4+/CD8+ ratio was reversed compared with before treatment (P = 0.003, P = 0.076, respectively), but no significant change in the percentage of peripheral blood CD8+ T lymphocytes were found after 2 months of intensive phase treatment. However, after 2 months of intensive phase treatment, an elevated CD4/CD8 ratio was observed compared with controls (P < 0.001). In contrast, diminished peripheral blood CD8+ T cells were found after 2 months of intensive phase treatment compared with controls (P = 0.001). The proportion of CD4+ T cells after 2 months of intensive phase treatment was not significantly different compared with controls (P = 0.087).
Figure 2.
Plots showing the peripheral blood percentages of CD4+ T cells and CD8+ T cells, and the CD4+/CD8+ ratio. CD4+ T and CD8+ T cells were measured in individuals with pulmonary tuberculosis before (pre-T) and after (post-T) intensive phase anti-tuberculosis chemotherapy and in healthy volunteers. Horizontal lines indicate mean with SD.
Comparison of serum cytokine levels in individuals with TB before and after treatment, and in controls
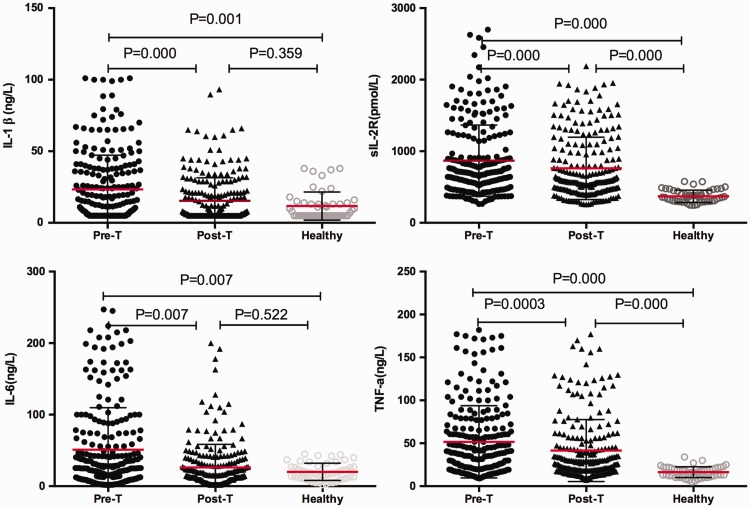
Serum levels of the four cytokines IL-1β, sIL-2R, IL-6, and TNF-α in patients with TB before and after treatment and those in controls are shown in Figure 3. Serum IL-1β, sIL-2R, IL-6, and TNF-α levels before treatment were significantly higher than those in controls (P = 0.001, P < 0.001, P = 0.007, P < 0.001, respectively). IL-1β, sIL-2R, IL-6, and TNF-α levels were significantly lower after 2 months of intensive phase treatment compared with before treatment (P < 0.001, P < 0.001, P = 0.007, P < 0.001, respectively). Elevated levels of sIL-2R and TNF-α were still detected at 2 months of anti-TB therapy compared with controls (both P < 0.001). In contrast, after 2 months of anti-TB therapy, serum IL-1β and IL-6 levels were not significantly different compared with controls.
Figure 3.
Plots showing serum levels of interleukin-1β, soluble interleukin-2 receptor, interleukin-6, and tumour necrosis factor-α. These cytokines were measured in individuals with pulmonary tuberculosis before (pre-T) and after (post-T) the intensive phase anti-tuberculosis chemotherapy and in healthy volunteers. Horizontal lines indicate mean with SD.
Association of immune parameters with bacterial burden in pulmonary TB
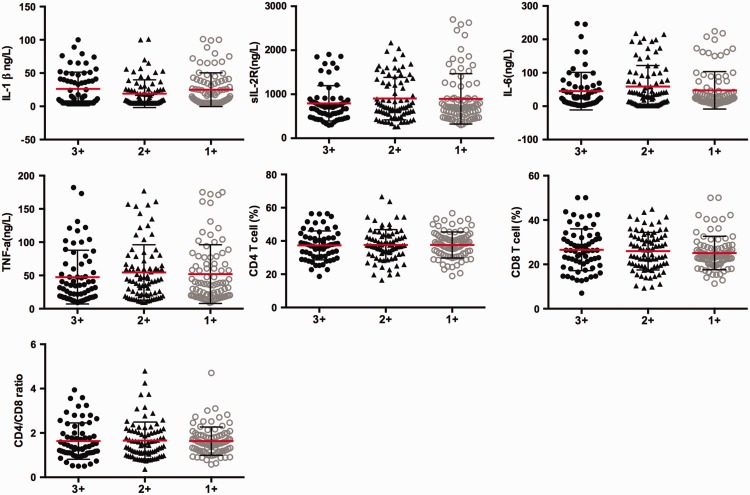
To evaluate the association between systemic levels of immune parameters and different bacterial burdens in pulmonary TB, we analysed the correlations between serum levels of IL-1β, sIL-2R, IL-6, and TNF-α, the percentage of peripheral blood CD4+ T cells and CD8+T cells, and the CD4+/CD8+ ratio in patients with pulmonary TB with smear grades classified as 1+, 2+, and 3+ (Figure 4). There were no significant associations of these variables with smear grades.
Figure 4.
Plots showing serum levels of interleukin-1β, soluble interleukin-2 receptor, interleukin-6, and tumour necrosis factor-α, the peripheral blood percentage of CD4+ T cells and CD8+T cells, and the CD4+/CD8+ ratio in individuals with pulmonary tuberculosis according to smear grade. Smear grades were classified as 1+, 2+ and 3+. Horizontal lines indicate mean with SD.
Comparison of serum cytokines between the sputum smear conversion group and the non-conversion group
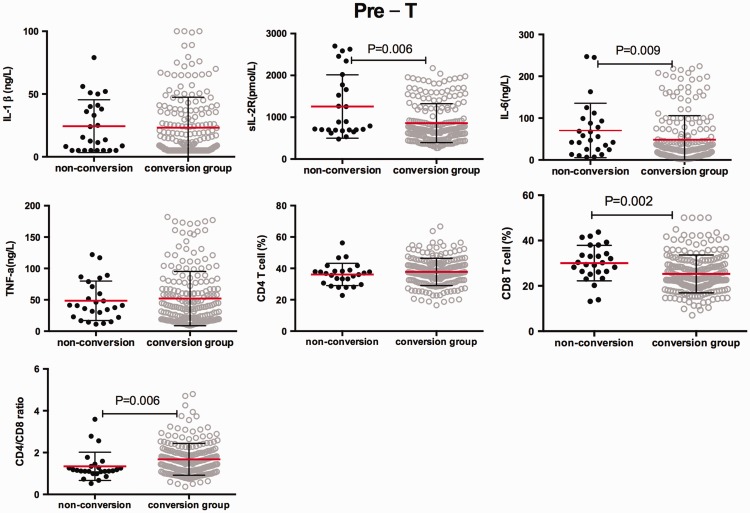
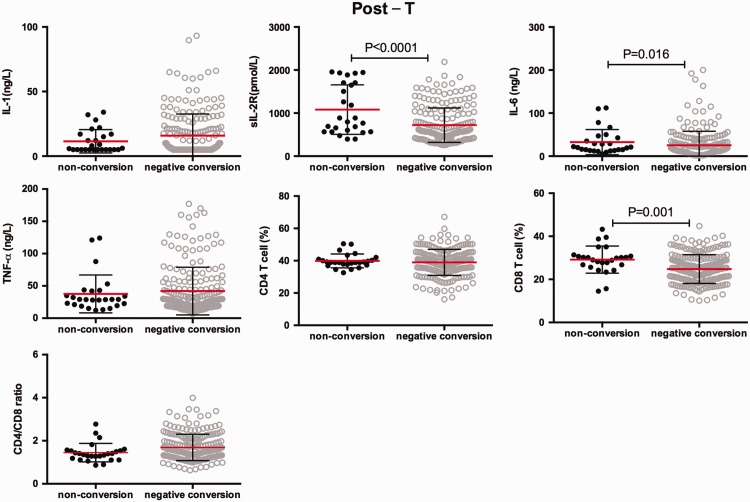
According to sputum smear conversion after 2 months of intensive phase treatment, we divided the patients into two groups: the conversion group and the non-conversion group. We conducted a survey to determine whether there is a difference in immune response between the two groups. Serum sIL-2R and IL-6 levels and the percentage of peripheral blood CD8+T cells were significantly higher in the non-conversion group than in the conversion group at pre-treatment and post-treatment (all P < 0.05, Figures 5 and 6). Additionally, the CD4+/CD8+ ratio was significantly lower in the non-conversion group than in the conversion group at pre-treatment (P = 0.006). However, there were no significant differences in serum IL-1β and TNF-α levels between the non-conversion and conversion groups before and after anti-TB chemotherapy.
Figure 5.
Initial serum levels of interleukin-1β, soluble interleukin-2 receptor, interleukin-6, and tumour necrosis factor-α, the peripheral blood percentage of CD4+ T cells and CD8+T cells, and the CD4+/CD8+ ratio in individuals with pulmonary tuberculosis in the non-conversion and conversion groups. Horizontal lines indicate mean with SD.
Figure 6.
Plots showing serum levels of interleukin-1β, soluble interleukin-2 receptor, interleukin-6, and tumour necrosis factor-α, the peripheral blood percentage of CD4+ T cells and CD8+T cells, and the CD4+/CD8+ ratio in individuals with pulmonary tuberculosis in the non-conversion and conversion groups at post-treatment. Horizontal lines indicate mean with SD.
Discussion
At present, the HREZ four-drug chemotherapy regimen is a compelling combination of drugs for primary TB chemotherapy. HREZ has the essential characteristics of high efficiency, low toxicity, and low cost. We finally included 232 cases of sputum smear-positive pulmonary TB in this study. After 2 months of intensive phase treatment, sputum smear conversion was found in 206 cases and non-conversion in 26 cases, and the bacilli-negative conversion rate was 88.8%, which is consistent with other reports.10
Immune activation and inflammatory reactions are essential for host protection against Mtb. Overall, the interplay between immune activation, inflammation, and TB pathogenesis is complex and not completely understood. If some of these mechanisms can be determined, new treatment strategies could be used.11 In spite of this complexity, associations between Mtb infection activity and some parameters of immune reactions have recently been described, but there are conflicting results.12–15
After infection with Mtb, the host’s immune defence response is mainly mediated by T lymphocytes and mononuclear phagocytic cells, as well as their associated cytokine network. Among T lymphocyte subsets, CD4+ T lymphocytes are the main response cells against Mtb.11,16 In our study, we observed a lower percentage of CD4+ T cells in patients with active TB compared with controls before treatment, and this percentage was significantly restored after 2 months of intensive anti-TB treatment. In contrast, we found a higher percentage of CD8+ T cells compared with controls before treatment. The CD4+/CD8+ ratio was also lower levels in in patients with active TB before treatment compared with controls, and this reduction was reversed after intensive anti-TB treatment. Skogmar et al.17 reported that a high proportion of Ethiopian patients with TB have subnormal CD4+ T cells counts before initiating anti-TB chemotherapy, and low CD4+ T cell levels were associated with smear-positive disease. The continuous increase in CD4+ T cells counts during anti-TB treatment suggested a reversible effect of active TB on CD4+ T cell homeostasis, which is consistent with the current study. However, CD8+ T cells also play a necessary protective role in animal models, as well as in humans against Mtb infection.18–20 Lesnic et al.21 found that the CD8+ lymphocyte count was superior in patients with TB compared with the healthy group and anti-TB treatment increased the index. In the present study, patients with TB who underwent treatment for 2 months did not show a significant difference in the percentage of peripheral blood CD8+ T cells compared with that detected before beginning therapy. However, the CD4+/CD8+ ratio at post-treatment showed an increased trend compared with pre-treatment. These results indicated that patients recovered some cellular immune function after 2 months of intensive phase treatment.
IL-1β is a member of the interleukin-1 cytokine family and a pleiotropic and immunoregulatory cytokine. IL-1β levels are increased in active TB and play some roles in the pathogenesis of TB.7,22 We also observed an increase in serum IL-1β levels before treatment of TB compared with controls. After 2 months of treatment, IL-1β levels were greatly decreased compared with those before treatment. There was no significant difference in serum IL-1β levels between post-2 months’ treatment and controls. This finding indicated that, at completion of 2 months of intensive phase therapy, serum IL-1β levels were similar to those of controls.
The sIL-2R is a type of crucial immunosuppressive factor, and is associated with the IL-2 mediated immune response. The sIL-2R is present on the cell membrane as a signal-transducing unit or in a soluble form in the extracellular fluid, and is discharged along with IL-2 from activated T cells. The primary effect of sIL-2R is through binding of IL-2 to regulate the immune response, which results in blocking of the biological effects of this cytokine.23,24 In our study, serum sIL-2R levels in patients with active pulmonary TB were significantly higher than those in controls before treatment, and were significantly decreased after 2 months of intensive phase anti-TB treatment, but they did not reach control levels. Serum sIL-2R levels in the sputum non-conversion group were considerably higher than those in the sputum conversion group before beginning therapy. This result indicates that serum sIL-2R levels are related to the host immune status and disease severity in patients with active TB. Therefore, sIL-2R levels might be a useful marker for monitoring TB outcome under chemotherapy.
IL-6 is a multiple functional proinflammatory cytokine and previous studies have shown that it is one of the most promising biomarkers in TB.25 IL-6 is involved in the primary cellular processes of differentiation, proliferation, and apoptosis, and its elevated production is a hallmark of many human chronic inflammatory diseases. Nolan et al.26 showed that IL-6 might reflect an efficient T-helper 1 immune response pathway for TB. Martinez et al.27 found that Mtb regulated host IL-6 production to inhibit type I interferon signalling, and consequently, disease progression. Djoba et al.28 reported elevated IL-6 levels in patients with active TB compared with those with latent TB infection. Chowdhury et al.29 showed that circulating IL-6 levels in patients with active pulmonary TB were higher than those in healthy individuals. Following anti-TB treatment, IL-6 levels rapidly decreased and stabilized by 4 months anti-TB therapy. Therefore, a subtle decrease in serum IL-6 levels of patients with active pulmonary TB who undergo anti-TB chemotherapy might play an essential part in immune protection of the host against Mtb infection. Our study showed that after 2 months of treatment, serum IL-6 levels were decreased and they were not different from control levels. Additionally, serum IL-6 levels were higher in the negative conversion group than in the non-conversion group at pre-treatment. Therefore, serum IL-6 levels appear to be a helpful marker to diagnose and predict the effectiveness of treatment in patients with TB.
TNF-α consists of 157 amino acids of the glycosylated protein and is secreted by a variety of cells, including macrophages, lymphocytes, mast cells, endothelial cells, and fibroblasts.30 TNF-α promotes formation of TB granuloma and induces TB bacterium infection of macrophages. This pleiotropic cytokine is associated with pathogenesis and protection in Mtb infection.26,31 Patil et al.32 investigated patients with spinal TB and found that a poor outcome was associated with higher proinflammatory serum IFN-γ and TNF-α levels and lower anti-inflammatory serum IL-10 levels. In the current study, higher serum TNF-α levels in patients who had active TB were observed compared with controls, and these levels were decreased after therapy. A previous study showed that patients undergoing therapy with TNF-α-blockers are prone to develop TB infection.33 Previous studies have shown that excessive TNF-α levels cause damage to the immune pathological response in cells and to protection of the body’s defense.34–36 TNF-α levels may be related to the severity of the disease process and may serve as a parameter for predicting the prognosis of pulmonary TB.
We observed significantly higher serum levels of IL-1β, sIL-2R, IL-6, and TNF-α before treatment compared with controls, and these levels appeared to be diminished after intensive phase anti-TB chemotherapy. However, no significant correlation was recorded between cytokine levels with different bacterial burdens.
There are several limitations in our study. First, further research or analysis is needed to determine the reason why sputum smear-positive patients were still positive for bacteriology while they finished 2 months of intensive chemotherapy. Second, the association of cytokine levels with the extent of disease and disease severity of TB requires further research.
In conclusion, the current study shows that there is a restorative increase in CD4+ T cells in peripheral blood and a reversal of decreased of serum IL-1β, sIL-2R, IL-6, and TNF-α levels in patients with pulmonary TB after 2 months of intensive phase anti-TB treatment. Serum sIL-2R and IL-6 levels show more pronounced elevated levels in sputum smears in the non-conversion group than in the conversion group. These findings suggest partial immunological recovery in patients with pulmonary TB after intensive phase treatment. Therefore, serum cytokine levels are considered potential host biomarkers for monitoring the response of treatment for pulmonary TB. Our findings can also provide insight into examining molecular markers of protective immunity against TB.
Acknowledgements
This work was conducted in Shanghai Pulmonary Hospital. The authors acknowledge the nursing staff and technicians for their important contributions. We also thank all of the patients who participated in this study.
Declaration of conflicting interest
The authors declare that there is no conflict of interest.
Funding
This work was supported by the National Great Research Program of China (2013ZX1003009).
References
- 1.WHO Global tuberculosis report 2016. http://www.who.int/tb/publications/global_report/en/
- 2.Ernest JD. The immunological life cycle of tuberculosis. Nat Rev Immunol 2012; 12; 581–591. [DOI] [PubMed] [Google Scholar]
- 3.O'Garra A, Redford PS, Mcnab FW, et al. The immune response in tuberculosis. Annu Rev Immunol 2013; 31: 475–527. [DOI] [PubMed] [Google Scholar]
- 4.Rajavelu P, Das SD. Th2-type immune response observed in healthy individuals to sonicate antigen prepared from the most prevalent Mycobacterium tuberculosis strain with single copy of IS6110. FEMS Immunol Med Microbiol 2005; 45: 95–102. [DOI] [PubMed] [Google Scholar]
- 5.Katti M K. Assessment of serum IL-1, IL-2 and IFN-γ levels in untreated pulmonary tuberculosis patients: role in pathogenesis. Arch Med Res 2011; 42: 199–201. [DOI] [PubMed] [Google Scholar]
- 6.Clifford V, Zufferey C, Street A, et al. Cytokines for monitoring anti-tuberculous therapy: A systematic review. Tuberculosis (Edinb) 2015; 95: 217–228. [DOI] [PubMed] [Google Scholar]
- 7.Anusiem CA, Okonkwo PO. The impact of treatment on the serum concentration of interleukin-1 Beta in pulmonary Tuberculosis. Am J Ther 2017; 24: e329–e332. doi: 10.1097/MJT.0000000000000360. [DOI] [PubMed] [Google Scholar]
- 8.Organization WH. The Treatment of Tuberculosis: Guidelines. 2010. http://apps .who .int/iris/bitstream/10665/44165/1/9789241547833_eng .pdf . [PubMed]
- 9.WHO. Guidelines for surveillance of drug resistance in tuberculosis. 4th ed Geneva, Switzerland: World Health Organization/HTM/TB; 2009: 422. [Google Scholar]
- 10.Lee HY, Chae KO, Lee CH, et al. Culture conversion rate at 2 months of treatment according to diagnostic methods among patients with culture-positive pulmonary tuberculosis. Plos One 2014; 9: e103768. [DOI] [PMC free article] [PubMed] [Google Scholar]
- 11.Tang S, Cui H, Lan Y, et al. Increased Cytokines Response in Patients with Tuberculosis Complicated with Chronic Obstructive Pulmonary Disease. Plos One 2013; 8: e62385. [DOI] [PMC free article] [PubMed] [Google Scholar]
- 12.Mcnab FW, Ewbank J, Howes A, et al. Type I IFN induces IL-10 production in an IL-27-independent manner and blocks responsiveness to IFN-γ for production of IL-12 and bacterial killing in Mycobacterium tuberculosis-infected macrophages. J Immunol 2014; 193: 3600–3612. [DOI] [PMC free article] [PubMed] [Google Scholar]
- 13.Shen H, Gu J, Xiao H, et al. Selective destruction of IL-23 induced expansion of major antigen-specific γδ T-cell subset in TB patients. J Infect Dis 2017; 215: 420–430. doi: 10.1093/infdis/jiw511. [DOI] [PMC free article] [PubMed] [Google Scholar]
- 14.Li M, Wang H, Wang X, et al. Diagnostic accuracy of tumor necrosis factor-alpha, interferon-gamma, interlukine-10 and adenosine deaminase 2 in differential diagnosis between tuberculous pleural effusion and malignant pleural effusion. J Cardiothorac Surg 2014; 9: 118. [DOI] [PMC free article] [PubMed] [Google Scholar]
- 15.Rai D, Garg RK, Mahdi AA, et al. Cerebrospinal fluid cytokines and matrix metalloproteinases in human immunodeficiency seropositive and seronegative patients of tuberculous meningitis. Ann Indian Acad Neurol 2014; 17: 171–178. [DOI] [PMC free article] [PubMed] [Google Scholar]
- 16.Kellar KL, Gehrke J, Weis SE, et al. Multiple cytokines are released when blood from patients with tuberculosis is stimulated with Mycobacterium tuberculosis antigens. PLoS One 2011; 6: e26545. [DOI] [PMC free article] [PubMed] [Google Scholar]
- 17.Skogmar S, Schön T, Balcha TT, et al. CD4 cell levels during treatment for tuberculosis (TB) in Ethiopian adults and clinical makers associated with CD4 lymphocytopenia. PLoS One 2013; 8: e83270. [DOI] [PMC free article] [PubMed] [Google Scholar]
- 18.Ottenhoff THM, Kaufmann SHE. Vaccines against Tuberculosis: Where Are We and Where Do We Need to Go? PLoS Pathog 2012; 8: e1002607. [DOI] [PMC free article] [PubMed] [Google Scholar]
- 19.Shen L, Gao Y, Liu Y, et al. PD-1/PD-L pathway inhibits M.tb-specific CD4(+) T-cell functions and phagocytosis of macrophages in active tuberculosis. Sci Rep 2016; 6: 38362. doi: 10.1038/srep38362. [DOI] [PMC free article] [PubMed] [Google Scholar]
- 20.Portal-Celhay C, Tufariello JM, Srivastava S, et al. Mycobacterium tuberculosis EsxH inhibits ESCRT-dependent CD4(+) T-cell activation. Nat Microbiol 2016; 2: 16232. [DOI] [PMC free article] [PubMed] [Google Scholar]
- 21.Lesnic E, Ghinda S, Pop CM. The impact of immune disturbances on the failure of antituberculosis treatment. Clujul Medical 2016; 89: 493–498. doi: 10.15386/cjmed-609. [DOI] [PMC free article] [PubMed] [Google Scholar]
- 22.Krishnan N, Robertson BD, Thwaites G. Pathways of IL-1β secretion by macrophages infected with clinical Mycobacterium tuberculosis strains. Tuberculosis 2013; 93: 538–547. [DOI] [PMC free article] [PubMed] [Google Scholar]
- 23.Cava F, González C, Pascual MJ, et al. Biological variation of interleukin 6 (IL-6) and soluble interleukin 2 receptor (sIL2R) in serum of healthy individuals. Cytokine 2000; 12: 1423–1425. [DOI] [PubMed] [Google Scholar]
- 24.Shitrit D, Izbicki G, Bar-Gil Shitrit A, et al. Role of soluble interleukin-2 receptor levels in patients with latent tuberculosis. Lung 2006; 184: 21–24. [DOI] [PubMed] [Google Scholar]
- 25.Mattos AM, Almeida Cde S, Franken KL, et al. Increased IgG1, IFN-gamma, TNF-alpha and IL-6 responses to Mycobacterium tuberculosis antigens in patients with tuberculosis are lower after chemotherapy. Int Immunol 2010; 22: 775–782. [DOI] [PubMed] [Google Scholar]
- 26.Nolan A, Condos R, Huie ML, et al. Elevated IP-10 and IL-6 from bronchoalveolar lavage cells are biomarkers of non-cavitary tuberculosis. Int J Tuberc Lung Dis 2013; 17: 922–927. doi: 10.5588/ijtld.12.0610 [DOI] [PMC free article] [PubMed] [Google Scholar]
- 27.Martinez AN, Mehra S, Kaushal D. Role of Interleukin 6 in Innate Immunity to Mycobacterium tuberculosis Infection. J Infect Dis 2013; 207: 1253–1261. [DOI] [PMC free article] [PubMed] [Google Scholar]
- 28.Djoba Siawaya JF, Beyers N, van Helden P, et al. Differential cytokine secretion and early treatment response in patients with pulmonary tuberculosis. Clin Exp Immunol 2009; 156: 69–77. [DOI] [PMC free article] [PubMed] [Google Scholar]
- 29.Chowdhury IH, Choudhuri S, Sen A, et al. Serum interleukin 6 (IL-6) as a potential biomarker of disease progression in active pulmonary tuberculosis following anti-tuberculosis drug therapy. Mol Immunol 2015; 63: 601–602. [DOI] [PubMed] [Google Scholar]
- 30.Kaufmann SHE. How can immunology contribute to the control of tuberculosis? Nat Rev Immunol 2001; 1: 20–30 [DOI] [PubMed] [Google Scholar]
- 31.Nemeth J, Winkler HM, Boeck L, et al. Specific cytokine patterns of pulmonary tuberculosis in Central Africa. Clin Immunol 2011; 138: 50–59. [DOI] [PubMed] [Google Scholar]
- 32.Patil T, Garg RK, Jain A, et al. Serum and CSF cytokines and matrix metalloproteinases in spinal tuberculosis. Inflamm Res 2015; 64: 97–106. [DOI] [PubMed] [Google Scholar]
- 33.Falkenstern-Ge RF, Husemann K, Kohlhäufl M. Prolonged paradoxical reaction to anti-tuberculous treatment after discontinuation of TNF-alpha- blocker therapy with adalimumab. Rare clinical documentation. Open Med (Wars) 2014; 10: 39–43. [DOI] [PMC free article] [PubMed] [Google Scholar]
- 34.Richmond JM, Duffy ER, Lee J, et al. Mannose-capped Lipoarabinomannan from Mycobacterium tuberculosis induces soluble tumor necrosis factor receptor production through tumor necrosis factor alpha-converting enzyme activation. Infect Immun 2012; 80: 3858–3868. [DOI] [PMC free article] [PubMed] [Google Scholar]
- 35.Cilfone NA, Perry CR, Kirschner DE, et al. Multi-Scale Modeling Predicts a Balance of Tumor Necrosis Factor-α and Interleukin-10 Controls the Granuloma Environment during Mycobacterium tuberculosis Infection. PLoS One 2013; 8: e68680. doi: 10.1371/journal.pone.0068680 [DOI] [PMC free article] [PubMed] [Google Scholar]
- 36.Elkebir M, van der Kuip M, van Furth AM. Computational modeling of tuberculous meningitis reveals an important role for tumor necrosis factor-α. J Theor Biol 2013; 328: 43–53. doi: 10.1016/j.jtbi.2013.03.008. [DOI] [PMC free article] [PubMed] [Google Scholar]


