Abstract
Tinnitus can have serious impact on a person’s life and is a common auditory symptom that is especially comorbid with hearing loss. This study investigated processing effort required for speech recognition in a group of hearing-impaired people with tinnitus and a control group (CG) of hearing-impaired people without tinnitus by means of pupillary response. Furthermore, the relationship between the pupillary response, self-rating measures of tinnitus severity, and fatigue was examined. Participants performed a speech-in-noise task with a competing four-talker babble at two speech intelligibility levels (50% and 95%) with either an active or inactive noise-reduction scheme while the pupillary response was recorded. Tinnitus participants showed significantly smaller time-dependent pupil dilations and significantly higher fatigue ratings. No correlation was found for the tinnitus severity and pupillary response, but a significant correlation was found between the tinnitus severity and fatigue. As participants with tinnitus generally reported higher fatigue and showed smaller task-evoked pupil dilations, it was speculated that this may suggest an increased activity of the parasympathetic nervous system, which governs the bodily response during rest. The finding that tinnitus participants showed higher fatigue has clinical implications, highlighting the importance of taking steps to decrease the risk of developing long-term fatigue. Finally, the tinnitus participants showed reduced pupillary responses when noise reduction was activated, suggesting a reduced effort from hearing aid signal processing.
Keywords: tinnitus, pupillometry, pupil dilation, effort, hearing impairment, noise reduction, hearing aids, fatigue, need for recovery
Introduction
Tinnitus is a common auditory symptom that can affect all people with or without hearing loss (Langguth, Kreuzer, Kleinjung, & De Ridder, 2013). Tinnitus is defined as the perception of meaningless sound that occurs without any external sound stimuli (Langguth et al., 2013). The literature estimates that 5% to 15% of the global adult population have chronic tinnitus (Axelsson & Ringdahl, 1989; Hoffmann & Reed, 2004; Khedr et al., 2010; Lasisi, Abiona, & Gureje, 2010; Michikawa et al., 2010; Nondahl et al., 2002; Ries, 1994; Shargorosky, Curhan, & Farwell, 2010; Xu et al., 2011). The effect and impact of tinnitus vary from nonexistent to profound (Baguley, Andersson, McFerran, & McKenna, 2013), and the majority of people are relatively unaffected by their tinnitus. For approximately 10% to 20% of tinnitus sufferers, tinnitus can affect sleep, mood, and daily life activities (Davis & Rafaie, 2000). It is generally estimated that approximately 2% of the tinnitus population is so severely affected by their tinnitus that quality of life is severely impaired (Langguth et al., 2013; Rossiter, Stevens, & Walker, 2006). Although it is well established that tinnitus patients subjectively report that tinnitus disturbs the cognitive mechanisms of concentration (Andersson, Lyttkens, & Larsen, 1999; Tyler & Baker, 1983), evidence for the involvement of tinnitus in other cognitive mechanisms is weak. Whether tinnitus affects performance on cognitive tasks is under debate, especially regarding its effects on behavioral and objective measures, and further research within the field is warranted (Andersson & McKenna, 2006; Mohamad, Hoare, & Hall, 2016; Tegg-Quinn, Bennet, Eikelboom, & Baguley, 2016). For the cognitive component of working memory (WM), results vary. Rossiter et al. (2006) found that tinnitus participants performed worse on a reading span test, suggesting a poorer WM capacity. Similarly, Stevens, Walker, Boyer, and Gallagher (2007) found significantly slower reaction times on a dual-task paradigm for tinnitus patients, suggesting a poorer WM performance in high-demand tasks. However, neither study controlled for hearing loss, which may have been the main factor contributing to the group effects (Tegg-Quinn et al., 2016). Hallam, McKenna, and Shurlock (2004) compared tinnitus and nontinnitus patients with similar hearing status on performance with a dual task and found poorer performance in the tinnitus patients. For the component of attention, Cuny, Norena, El Massioui, and Chéry-Croze (2004) investigated auditory attention in individuals with unilateral tinnitus. They found that participants with unilateral tinnitus had more difficulty shifting attention to the nontinnitus ear, and that the participants had a biased attention toward the tinnitus ear. They also found tinnitus severity to be associated with less efficient attention capability. Stevens et al. (2007) found similar results in their study in which they investigated reaction times using the Stroop color–word test, where words for colors are written in alternating corresponding and noncorresponding colors. The tinnitus group (TG) had slower reaction times, and the authors interpreted that to mean tinnitus causes an impairment in attention . In contrast, Heeren et al. (2014) found no significant difference between tinnitus and control participants in an attention test. The support behind tinnitus affecting cognitive mechanisms is mixed, and it is deemed necessary to explore the degree to which factors such as hearing loss may be involved. The literature has suggested that only few differences in objective measures are found when individuals with hearing loss are used as controls, perhaps because hearing loss and tinnitus may have similar cognitive consequences (Andersson & McKenna, 2006; McKenna & Hallam, 1999; Tegg-Quinn et al., 2016).
Research on possible effects of tinnitus on the cognitive mechanism of effort is unexplored. Effort can be defined as the intentional allocation of resources that are applied to overcome obstacles when pursuing a goal in a task (Pichora-Fuller et al., 2016). For processing effort, the applied resources are mental resources, and two factors are involved in processing effort. One factor is the processing demand, which is created by the task or the environment in which the processing occurs. The other factor is related to the listener and can be dependent on hearing loss (Mattys, David, Bradlow, & Scott, 2012; Wendt, Koelewijn, Ksiazek, Kramer, & Lunner, 2017), cognitive abilities such as WM (Koelewijn, Zekveld, Festen, & Kramer, 2014), or individual motivation to expend mental effort (Pichora-Fuller et al., 2016). Based on the aforementioned research, it is probable that tinnitus affects processing effort, as tinnitus may affect factors related to the listener, for example, cognitive abilities.
Effort (as the umbrella term for processing effort, listening effort, and cognitive effort) can be assessed with behavioral, subjective, and physiological methods (Ohlenforst et al., 2017; Pichora-Fuller et al., 2016). Within the physiological methods, the pupillary response is considered to reflect processing load (Beatty, 1982; Pichora-Fuller et al., 2016; Zekveld & Kramer, 2014). The task-evoked pupil dilation response can be associated with both the sympathetic nervous system (SNS) and parasympathetic nervous system (PNS) branches of the autonomic nervous system. These branches are in the control of different responses, where the SNS controls the “fight or flight” response necessary in stressful situations, and the PNS controls the “rest or digest” response, which is active in situations that do not require the body to prepare for fighting or fleeing. Although both branches are active during pupil dilation, it is mainly governed by the SNS system (Kahneman, 1973), but the balance of the branches may be askew in certain populations (Wang et al., 2018). Pupillometry has been applied to obtain measures of cognitive processing load (Beatty, 1982; Kahneman, 1973). Furthermore, it has been used successfully as an index of effortful listening during speech recognition to investigate the effect of hearing status, hearing aid (HA) signal processing, or task difficulty on effort, within the field of hearing-related research (e.g., Wendt et al., 2017; Zekveld, Kramer, & Festen, 2010).Those studies measured pupil dilation, while participants recognized everyday sentences in background noise. Commonly, three different parameters of pupil dilation are assessed with pupillometry in those studies: the peak of the pupil dilation (PPD), the latency of the peak dilation, and the mean pupil dilation within a given time frame (Zekveld, Kramer, & Festen, 2011). It has been suggested that the PPD reflects momentary, task-induced effort, and it has been demonstrated that the pupil dilation can change according to hearing status and task demands. For example, Ohlenforst et al. (2017) showed that PPD changed depending on the listener’s hearing abilities and that individuals with hearing loss had large PPDs over a wider range of signal-to-noise ratios (SNRs) compared with normal hearing (NH) controls, whose PPD was at its maximum in a narrower range of SNRs.
Although the PPD has traditionally been used as a measure in pupillometry studies, some recent studies show that other ways of analyzing pupillary response can be more sensitive (Kuchinsky et al., 2013; Wendt et al., 2018; Winn, Edwards, & Litovsky, 2015). For instance, growth curve analysis (GCA) has been applied in recent studies to model the change of the pupillary response over time, rather than analyzing static effects at a particular point in the pupil dilation (Mirman, Dixon, & Magnuson, 2008). With GCA, parameters of the pupillary response, such as steepness of the dilation, the overall shape, and the overall slope, can be investigated. As the GCA may reveal the impact of tinnitus on the time course of the pupillary response, which may not be reflected in the PPD, it was included in this study.
Many persons with hearing loss report tinnitus. However, to the best of the authors’ knowledge, the impact of tinnitus on processing effort, as indicated by the pupillary response, has not yet been studied. As previous studies have suggested that several listener-related factors may influence the pupil response evoked by a task, such as the hearing status (Ohlenforst et al., 2017; Zekveld et al., 2011), cognitive abilities such as WM capacity (Zekveld & Kramer, 2014), and the age of the participant (Zekveld et al., 2011), it seems pertinent to investigate whether tinnitus is another listener-related factor that may impact processing effort.
In this study, it was hypothesized (H1) that individuals with tinnitus and hearing loss (TG) will display an increased task-evoked processing effort as assessed by the pupillary response compared with those with hearing loss who do not have tinnitus (CG). As it has already been shown, listener-dependent factors such as hearing loss can increase processing effort; thus, it seems reasonable to suspect that tinnitus further adds to effort.
In addition to listener-dependent factors, it has also been shown that signal-related factors influence processing effort (Koelewijn, Zekveld, Festen, & Kramer, 2012; Ohlenforst et al., 2017; Wendt et al., 2017). It has previously been seen that HA processing can reduce listening effort for people with hearing loss. Wendt et al. (2017) investigated the benefit of HA signal processing by measuring the PPD during a speech-in-noise test (hearing in noise test [HINT], Nilsson, Soli, & Sullivan, 1994) in participants with aided hearing loss. Pupillary response was measured at two different intelligibility levels, and two different settings of the HAs, that is, with an active and inactive noise reduction (NR) scheme. They found that the PPD decreased, indicating a reduced processing effort, as a function of the intelligibility (from 50% to 95%) and as a function of the NR scheme. Interestingly, they demonstrated a reduced processing effort even at ceiling performance levels.
Based on the aforementioned rationale, it was hypothesized (H2) that applying an NR scheme would significantly reduce processing effort as assessed by pupillary response. Furthermore, based on previous research showing that tinnitus severity was related to less efficient attention capability (Cuny et al., 2004), it was hypothesized (H3) that subjective tinnitus severity would correlate with objective PPD, such that the worse you perceive your tinnitus, the more effort you expend in the task.
Being required to spend more effort in order to meet demands (such as understanding speech with a hearing loss) may accumulate, with the consequence of fatigue over time. Fatigue is a complex phenomenon that can occur in the short term as a consequence of spending extra mental effort during, for example, a challenging task or a shorter period of increased demands at work. It can also be a continuous state as a consequence of a persistent disease or lack of possible recovery after longer periods of stress (Hornsby, Naylor, & Bess, 2016)—and perhaps tinnitus. Implications suggest that people with hearing loss are more fatigued than normal-hearing individuals (Kramer, Kapteyn, & Houtgast, 2006; Nachtegaal, Festen, & Kramer, 2012). To the best of our knowledge, no study has investigated the presence of fatigue in individuals with tinnitus. However, research suggests that tinnitus is associated with emotional exhaustion (Hébert, Canlon, & Hasson, 2012), sleep disturbance (Alster, Shemesh, Ornan, & Attias, 1993), and insomnia (Crönlein, Langguth, Geisler, & Hajak, 2007; Folmer & Griest, 2000). In line with the hypothesis that people with tinnitus expend more effort and the suggestion that consequences of effort accumulate over time, this study also investigated self-reported daily life fatigue. Consequently, it was hypothesized (H4) that people with tinnitus and hearing loss show increased ratings of self-reported daily life fatigue than people with hearing loss and no tinnitus and that self-rated tinnitus severity will correlate with self-rated fatigue, meaning the worse you perceive your tinnitus, the more fatigued you are likely to feel.
Materials and Methods
Participants
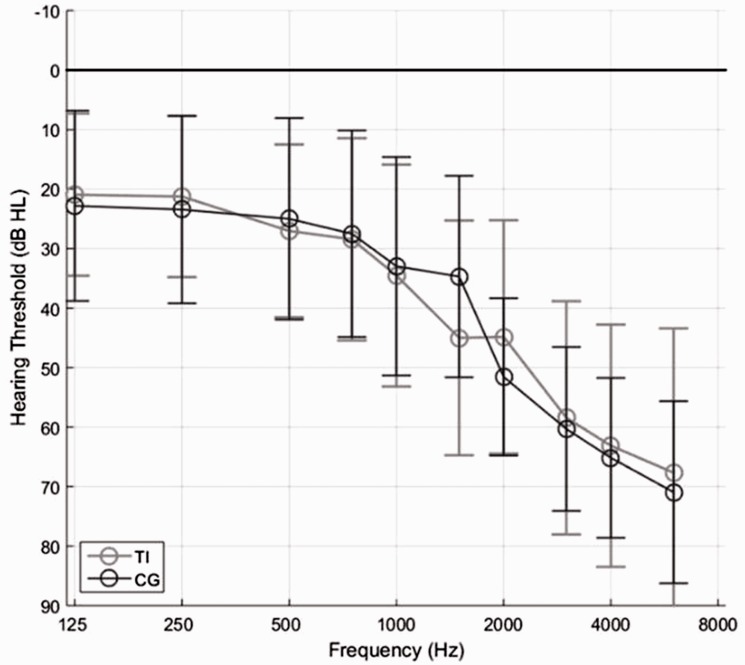
Sixteen participants with chronic tinnitus lasting at least 6 months with an average age of 62 years, ranging from 45 to 79 years, were included in the TG, and 16 participants with an average age of 67 years, ranging from 47 to 84 years, were included in the CG. All participants were native Danish speakers and had bilateral sensorineural hearing loss (Figure 1). The pure-tone average from 500 to 4000 Hz ranged from 18 to 75 dB HL with an average of 42 dB HL for the TG and from 36 to 66 dB HL with an average of 49 dB HL for the CG. The participants were all experienced and bilaterally fitted HA users, having used HAs for the majority of the day for at least 3 months, and had no history of eye disease or eye operations. Independent samples t-tests were performed to compare the groups. No significant differences were found on age and gender nor between the 4-point averages on the right and left ear (cf. Table 1). Participants were given both verbal and written instructions prior to giving written consent. The ethics of this project were approved by the Research Ethics Committees of the Capital Region of Denmark.
Figure 1.
Average (between left and right ears) hearing curve for groups. TI = tinnitus group, CG = control group.
Table 1.
Results of Independent Samples Test on Participants.
| F(df) | Significance | t | |
|---|---|---|---|
| Age | 2.8 (30) | .107 | −1.45 |
| Gender | 0.2 (30) | .629 | 0.34 |
| PTA4 Right | 1.4 (30) | .254 | −0.49 |
| PTA4 Left | 0.8 (30) | .375 | 0.14 |
p < .05.
Speech Material and Noise Conditions
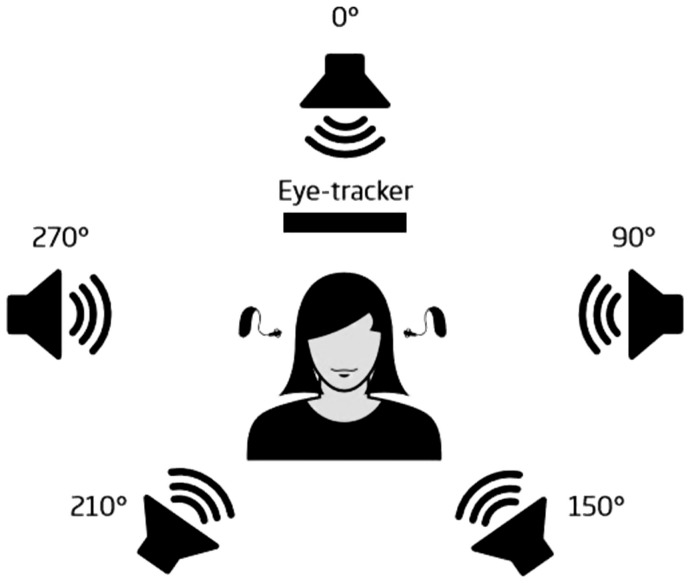
Sentences from the Danish HINT (Nielsen & Dau, 2011) were presented in a four-talker babble consisting of four overlapping talkers. The masker was constructed with four single audio files of two male and two female speakers. All of them were nonprofessional speakers reading text from a newspaper. All audio files had an equivalent long-term average frequency spectrum to the Danish HINT sentences, and speech pauses longer than 0.05 s were removed from the recordings. A spatial setup (Figure 2) of five loudspeakers was used in which the target HINT sentences were presented from the front of the speaker (at 0°) and the four-talker babble masker was presented from the sides and back of the participant. Each competing talker of the babble masker was presented spatially from one of the four loudspeakers. One male and one female speaker were always presented from the 90° and 270° azimuth position, ensuring that the effect of competing talkers was balanced across all conditions.
Figure 2.
Spatial set-up, with participant in the center, stimulus presented at 0°, noise at 90°, 270°, 210°, and 150°, and the eye tracking camera placed in front of the participant.
A single trial consisted of the duration of the masker presentation that started 3 s prior to the HINT sentence onset and terminated 3 s after sentence offset. Thus, each trial length varied according to the length of the HINT sentence, with a mean duration of 7.5 s. Subsequent to the offset of noise, participants were asked to repeat back the sentence to the best of their ability. Each participant performed three training lists of 20 sentences each at the beginning of the session, where the first list was performed in order to familiarize themselves with the procedure, and the second and third lists were performed to estimate the 50% and 95% speech reception threshold (SRT50 and SRT95). SRT50 and SRT95 were defined as the individual levels of SNRs where the participant recognized 50% and 95%, respectively.
NR Scheme
The participants were tested in two different conditions while wearing HAs. In Condition 1 (NoNR), no NR scheme was applied, and amplification was provided with only the proprietary rationale, Voice Aligned Compression (VAC; Le Goff, 2015). The VAC rationale is a curvilinear wide dynamic range compression and is characterized by providing less compression at high input levels and more at low input levels, with a compression knee point between 30 and 40 dB SPL, depending on the frequency region and magnitude of hearing loss.
In the other HA condition (NR), an NR scheme was applied in addition to the VAC rationale prescribed amplification. This scheme consisted of different blocks of processing. First, three fixed beamformers combined two microphone signals in order to enhance omnidirectional and rear cardioid signals. Next, a two-channel minimum variance distortion-less response beamformer (Kjems & Jensen, 2012) was applied to attenuate interfering signals using spatial filtering when the signals did not come from the front of the listener where the target was located. Then, a single-channel postfilter (Jensen & Pedersen, 2015) removed interfering noise in postprocessing of the signal.
Estimation of L50 and L95
To have comparable speech intelligibility levels, each participant’s Level 50 (L50, corresponding to SRT50) and Level 95 (L95, corresponding to SRT95) were identified. The individual L50s and L95s were estimated with a word-correct scoring for sentences presented in four-talker babble. The estimations were obtained with HAs set in the NoNR condition. An adaptive procedure was applied to both levels. An adaptive procedure (Levitt, 1971) was used to estimate L95. In this procedure, the L95 was estimated from the SRT80 by fitting a psychometric function to the data. The average L50 for the TG was 0.4 dB SNR (2.5) and for the CG was 0.4 dB SNR (2.7), with no significant difference between groups, F(1, 31) = 0.00, p = .97. The average L95 for the TG was 6.3 dB SNR (3.8) and for the CG was 6.8 dB SNR (3.6), with no significant difference between groups, F(1, 31) = 1.8, p = .29. Participants completed four test lists after training: two in NoNR (at L50 and L95) and two in NR (at L50 and L95). Each test list consisted of 25 sentences, and the order of list presentation was randomized using the random number function in Excel (Microsoft® Office Proofing Tools, © 2012 Microsoft Corporation). This function returns a random number evenly distributed between 0 and 1, which changes on calculation. Participants wore HAs during the entire test (including training), and while they were performing the speech recognition task, an eye-tracking camera recorded their pupil dilation online.
Tinnitus Handicap Inventory
The Tinnitus Handicap Inventory (THI; originally developed by Newman, Jacobsen, & Spitzer, 1996) assesses the degree of severity of tinnitus in terms of quality of life. The Danish version of the THI (Zachariae et al., 2000) was used in this study. The participants in the TG were asked to fill out the THI at the beginning of the session. The THI consists of 25 questions (e.g., “Because of your tinnitus, is it difficult for you to concentrate?”) where answer options are either yes (4 points), sometimes (2 points), or no (0 points). The THI scores range from 0 to 100 points, which correspond to a range of tinnitus categorizations (very mild, mild, moderate, severe, or catastrophic). The average THI score was 38, corresponding to moderate tinnitus, ranging from 20 (mild tinnitus) to 70 (severe tinnitus). One participant was excluded due to a THI score of 12 (very mild tinnitus).
Thermometer
The Tinnitus Thermometer (IDA Institute) is a tool that gauges how the person feels about their tinnitus at that very moment. It is a smiley face scale with corresponding numbers from 0 to 10, where 0 represents no tinnitus, and 10 represents worst tinnitus Some patients with tinnitus have varied experiences in how their tinnitus affects them (e.g., Stouffer & Tyler, 1990), and the tool can be used to assess how a patient feels about their tinnitus at a given moment. The thermometer was not used for statistical analysis, but it was applied to ensure that the participant was actually experiencing tinnitus on the day of the experiment.
Need for Recovery scale
The Need for Recovery (NFR; developed by van Veldhoven & Broersen, 2003) is intended as a surveillance approach to discover early signs of fatigue and prevent them from developing into long-term fatigue that could require a leave of absence. The NFR is an 11-item scale that measures symptoms of daily-life fatigue where the subject must answer either “yes or “no”. Yes indicates the unfavorable situations, except for one question, whereas No indicates the unfavorable situation. To calculate the score, the number of yes answers (and the single item where no is unfavorable) are divided by the total number of items (11) and then multiplied by a 100 to get the score as percentage. The greater the score, the greater the NFR, indicating a greater level of fatigue. A Danish translation was used in this study.
Apparatus and Spatial Setup
Pupillary response was measured using an eye-tracker system (iView X RED System; Sensor-Motoric Instruments, Teltow, Germany) that recorded pupil dilation with a sampling rate of 60 Hz. The infrared camera with an automatic eye and head tracker was placed in front of the participant with a distance of approximately 60 cm to measure both eyes remotely. Stimuli presentation was controlled using MATLAB-based programming (MathWorks, Natick, MA). Auditory signals were routed through a sound card (RME Hammerfall DSB multiface II; Audio AG, Haimhausen, Germany) and played back via five Genelec 8040A loudspeakers (Genelec Oy, Iisalmi, Finland). The experiment was performed in an acoustics-treated, double-walled IAC-NORDIC (IAC Acoustics, Hvidovre, Denmark) sound booth. Participants’ pupil x and y traces of both eyes were recorded to detect horizontal and vertical eye movements, respectively. For the analysis, only data from the left eye were used.
Pupil Data Analysis
Peak pupil dilation
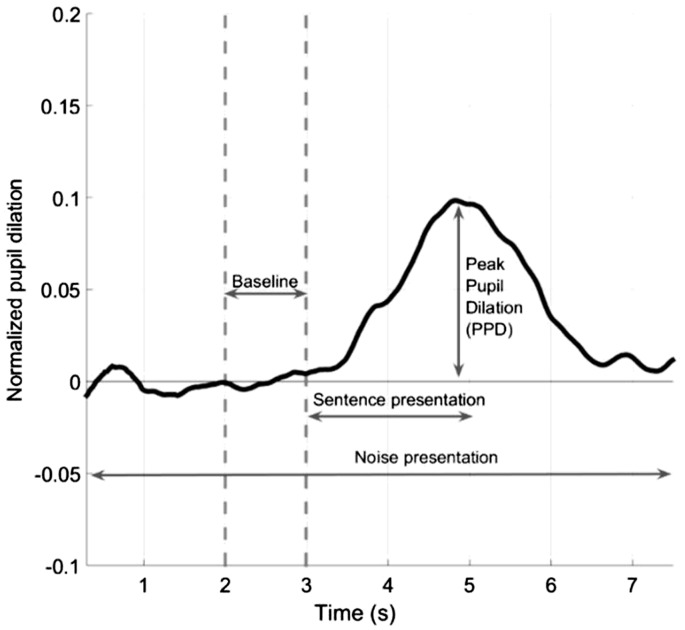
To avoid any potential effects of training, excitement, or arousal, the pupil traces from the first five trials were excluded from the data analysis. The recordings from the pupillary response of the remaining 20 trials were analyzed as follows: In the first step, eye blinks, eye movements, and other artifacts were removed from the recordings. This was achieved by removing pupil diameter values that exceeded the mean diameter by more than three standard deviations (SDs). Trials that contained more than 20% eye-blinks, eye movements, or missing data, and eye-movements larger than 10° from the fixation target, were excluded from the analysis. The detected eye blinks and movements were removed using a linear interpolation. The interpolation was applied 5 samples before and ended 10 samples after the blinks or movements. In a second step, high-frequency artifacts were removed by passing a 5-point moving average smoothing filter over individual trials. The third step included a baseline correction for all remaining traces. A baseline value was estimated using the mean pupil size approximately 1 s before sentence onset (where the participant listened to only noise; Figure 3). This baseline value was then subtracted from the whole pupil curve within each trial. The baseline-corrected pupil responses were then averaged across all remaining trials for each condition. Finally, the PPD was calculated for each participant and each condition (NoNR L50, NR L50, NoNR L95, and NR L95), which was defined as the maximum pupil dilation within the time interval between the sentence onset and noise offset.
Figure 3.
Normalized pupil dilation over time as a function of sentence in noise presentation.
Growth curve analysis
In addition to the PPD, GCA (Mirman, 2014) was used to model change in pupillary response over time, as it has been applied in previous studies on pupillometry (Kuchinsky et al., 2013; Wendt et al., 2018; Winn et al., 2015). The GCA is a multilevel regression technique that fits orthogonal polynomials to the time course pupil data in order to examine morphology of the pupillary response. By applying this statistical model, the hypothetical effect of tinnitus on processing effort can be investigated over time.
In this study, a third-order (cubic) orthogonal polynomial was applied with fixed effects of SNR, NR, and group. In addition, the linear term was included in the model as a random term in order to represent the distributed variance at the individual level and compensate for the overall slope. The model was applied to the overall time course of pupil dilation within a time window from 2 to 7 s of stimulus presentation. A third-order (cubic) orthogonal polynomial was applied which used a linear combination of three orthogonal time terms (linear, quadratic, and cubic). The intercept is interpreted as an indicator of the overall height or mean of the pupillary response. The linear term indicates the overall slope of the pupil curve, the quadratic term represents the shape, and thus the symmetric rise and fall rate around a primary inflection point of the primary reflection. The cubic term supposedly reflects the differences in the rise and fall, thus reflecting the steepness of the curve around the inflection point (see Mirman et al., 2008). An analysis of variance (ANOVA) was performed in order to compare model fit in each condition. The ANOVA showed that the cubic term had an effect when comparing the two groups and improved the model fit. Thus, the following formula was used for the GCA.
The lme4 package (Bates, Mächler, Bolker, & Walker, 2015) was employed in R-studio (Version 1.1.383, © 2009–2017 RStudio, Inc.) for the GCA computations. For more detailed information about the GCA methods, principles, and applications, see Mirman et al. (2008). Individual coefficients were extracted from the GCA for the tinnitus participant, meaning each individual has a coefficient for the intercept, linear, and quadratic term for each condition; the average of these per individual was later used for statistical analysis.
Statistical Analyses
Before investigating the hypotheses, an ANOVA was conducted on the speech recognition performance. This was to confirm that the groups did not differ on performance, meaning that performance would not be speculated to cause any pupil differences between groups. To test whether the TG group showed increased task-evoked processing effort as assessed by the pupillary response (H1), an ANOVA was conducted on the PPD and on the GCA. The above analyses were also conducted to test H2, that is, applying an NR scheme would significantly reduce processing effort. To test whether the worse you perceive your tinnitus, the more effort you expend in a task (H3), a Pearson correlation and Spearman’s rho analyses were carried out to investigate correlations between subjective measures of tinnitus and objective pupil data. Finally, to test H4, that is, the TG would show increased self-reported daily life fatigue and that tinnitus severity would correlate with fatigue severity, a t-test was conducted on the groups’ subjective measures of fatigue, and correlation analyses were conducted between the subjective tinnitus and fatigue measures. In addition, to investigate an effect of the experiment over time, a t-test was conducted on the individual pupil baselines for participants’ first and last condition of the experiment.
Results
Speech Recognition Performance
Primarily, a t-test was conducted to investigate differences in the individually adapted SNRs. There were no significant differences in the SNRs in the 50% intelligibility level between groups, F(1, 30) = 0.0, p = .99 nor the 95% level, F(1, 30) = 1.8, p = .29. For the performance, Figure 4 shows the mean response accuracy across participants for the speech recognition task. The highest accuracy was measured for the L95 conditions (between 92.7% and 97.9% for TG and 94.8% and 98.1% for CG). For the L50, the recognition performance was between 61.8% for the NoNR and 89.6% for the NR for the TG, and 61.9% for the NoNR and 89.3% for the NR for CG. For both groups, speech recognition performance during the NoNR L50 condition was quite high. The performance on the speech recognition task was analyzed using an ANOVA with intelligibility level (L50 and L95) and NR scheme (NoNR, NR) as the within-subject factors and group as the between-subject factor. The ANOVA revealed a main effect of intelligibility, F(1, 30) = 247.6, p < .001, indicating a significant improvement in speech recognition at L95, but no significant effect of the group, F(1, 30) = 0.582, p = .45. In addition, a main effect of NR was measured, F(1, 30) = 265.6, p < .001, indicating significantly increased speech recognition when NR was applied but no significant effect of the group, F(1, 30) = 0.679, p = .42. Finally, an interaction effect between intelligibility and NR was found, F(1, 30) = 132.3, p < .001. Most importantly, the lack of significant group differences in the aforementioned factors makes the groups adequate for comparisons on pupil dilation.
Figure 4.
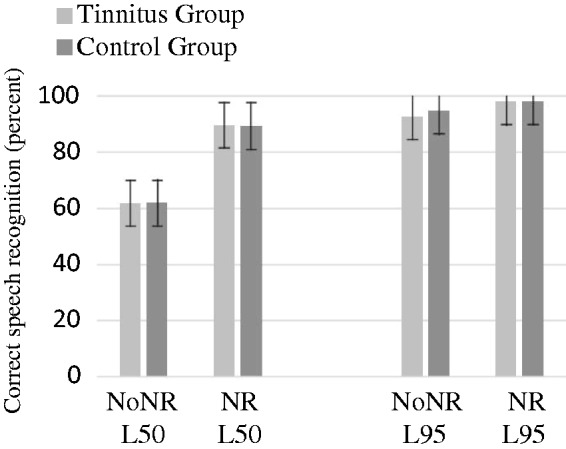
Speech intelligibility performance in four conditions.
Does Tinnitus Affect Pupillary Response?
Peak pupil dilation
The PPD was calculated based on the remaining trials for each condition. The PPDs are plotted in Figure 5 for all four test conditions. The effect of intelligibility level, NR, and group on PPD was analyzed by ANOVA with intelligibility level (L50 and L95) and NR scheme (NoNR and NR) as the within-subject factors and with group as the between-subject factor. The ANOVA revealed a main effect of intelligibility, F(1, 31) = 10.1, p < .005, indicating a significantly increased PPD at L50. An effect of the NR on PPD was found, F(1, 31) = 10.4, p < .005, indicating a significantly reduced PPD for the NR conditions. However, no significant differences between groups on level, F(1, 30) = 0.3, p = .59, or on NR, F(1, 30) = 1.8, p = .19, were found. These results may indicate that tinnitus does not further add to the PPD in a speech recognition in noise task. No significant differences in the pupil baseline values were found between the four conditions nor between groups.
Figure 5.
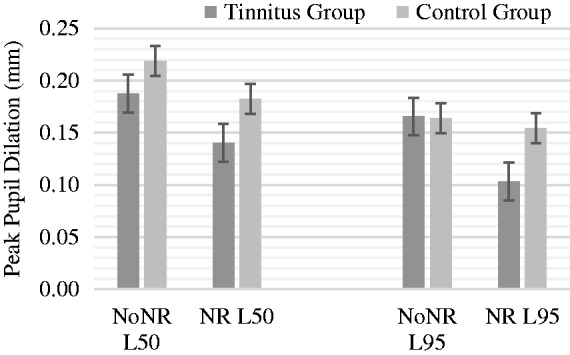
Peak pupil dilation (mm) for groups in four conditions.
Pupil GCA
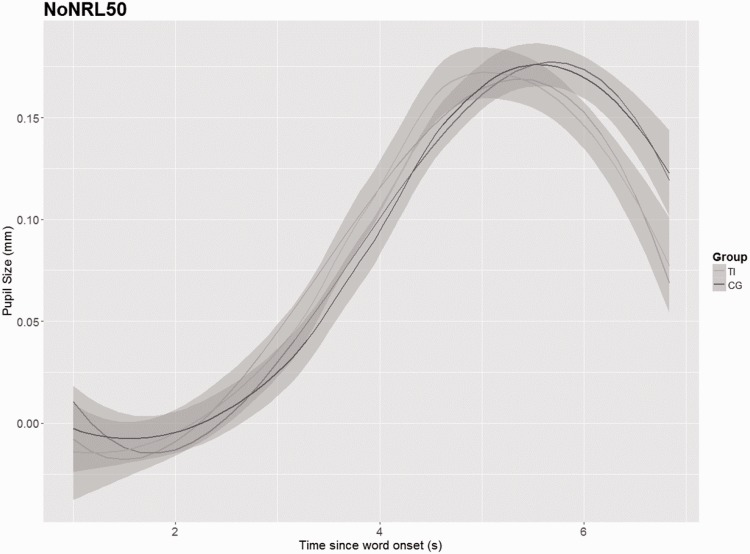
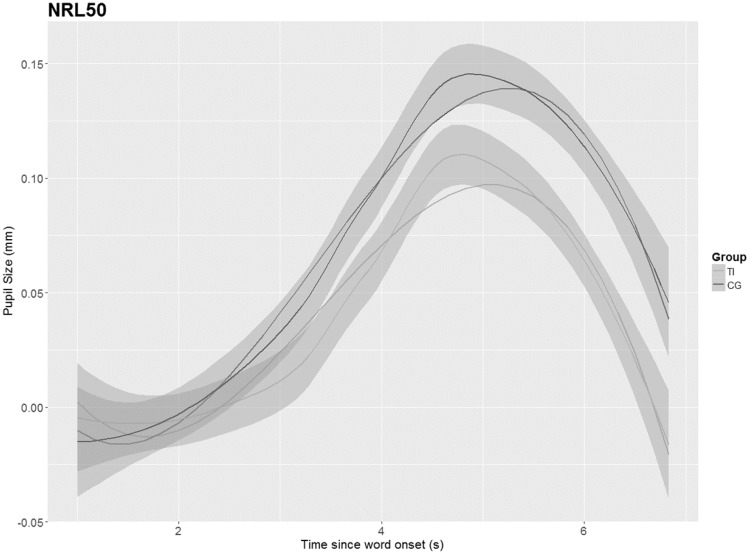
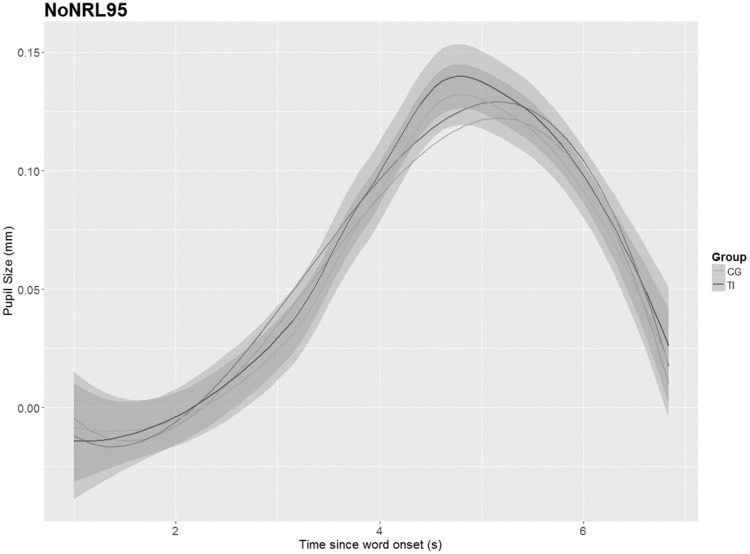
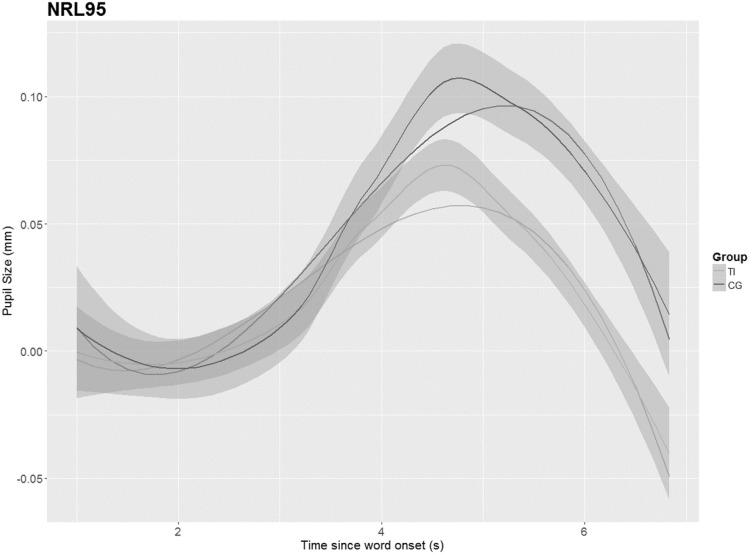
As no differences were identified between the groups in the PPD, the GCA was applied to model further changes of the pupillary response over time between both groups. The results (shown in Figures 6–9) depict the pupil dilation data relative to the baseline and fitted model responses as a function of time. An ANOVA Type III with a p value criterion of <.05 was conducted on the individual coefficients to examine any significant differences in the coefficients between groups related to the condition (NoNRL50, NR L50, NoNRL95, and NRL95). Type III was chosen because it ensures consistency in comparison. Table 2 provides the results in which beta values associated with each polynomial term are presented. The GCA demonstrated that TG showed significantly smaller pupil dilations in the intercept, linear, and quadratic terms in condition NoNRL50 (β = 0.05; p = .001, β = 0.11; p = .001, and β = 0.07; p = .001), the intercept and linear terms for condition NoNRL95 (β = 0.10; p = .001 and β = 0.06; p = .001), and for condition NRL95 (β = 0.17; p = .001 and β = 0.15; p = .001).
Figure 6.
GCA for groups in condition NoNRL50. TI = tinnitus group, CG = control group.
Figure 7.
GCA for groups in condition NRL50. TI = tinnitus group, CG = control group.
Figure 8.
GCA for groups in condition NoNRL95. TI = tinnitus group, CG = control group.
Figure 9.
GCA for groups in condition NRL95. TI = tinnitus group, CG = control group.
Table 2.
Linear Mixed Model Fit by Maximum Likelihood Formula and Output of the Analysis of Variance Type iii on the GCA for the Pupillary Responses Recorded in Conditions for Two Groups.
| Formula code: PupilDilation ∼
(1 + Linear + Quadratic + Cubic) ×
Group + (1 + Linear|Subject) | ||||||||||||
|---|---|---|---|---|---|---|---|---|---|---|---|---|
| NoNR L50 TG > CG |
NR L50 TG > CG |
NoNR L95 TG > CG |
NR L95 TG > CG |
|||||||||
| Term | β | F(df) | p | β | F(df) | p | β | F(df) | p | β | F(df) | p |
| Intercept | 0.05 | 14.1 (1, 1094) | *** | 0.00 | 0.38 (1, 1134) | 1 | 0.03 | 29.4 (1, 1135) | *** | 0.17 | 46.61 (1, 1098) | *** |
| Linear | 0.11 | 25.8 (1, 1092) | *** | 0.00 | 0.07 (1, 1133) | 1 | 0.08 | 16.9 (1, 1135) | *** | 0.15 | 39.2 (1, 1094) | *** |
| Quadratic | 0.07 | 18.4 (1, 1098) | *** | 0.00 | 0.40 (1, 1135) | 1 | −0.02 | 0.21 (1, 1135) | 1 | 0.01 | 2.1 (1, 1098) | 1 |
| Cubic | 0.00 | 0.0 (1, 1098) | 1 | 0.00 | 0.09 (1, 1135) | 1 | −0.01 | 0.01 (1, 1135) | 1 | 0.01 | 3.1 (1, 1098) | 1 |
Note. F(df) = F value with (degrees of freedom). Beta values represent a contrast estimate, such that they signify how much greater the effect was for the TG compared with the CG. TG = tinnitus group; CG = control group.
p < .001. **p < .01.
Does Tinnitus Severity Affect Pupillary Response?
Tinnitus Handicap Inventory
The THI was applied to assess the TG participants’ self-perceived tinnitus severity. The average THI score was 38 (SD 15.5), ranging from 20 to 70, with N = 9 in the mild category, N = 6 in the moderate category, and N = 1 in the severe category. To investigate relationships between tinnitus self-ratings and processing effort (H3), a Pearson correlation analysis was conducted. No significant correlation was found between any measures, except for the THI and the self-rating of daily life fatigue (NFR), where a significant, moderate correlation was found (r = .57, p < .05; cf. next section). No significant correlations were found between the THI and the PPD in any conditions. In addition, a Spearman’s rho analysis was conducted between the THI and the individual coefficients for the intercept and linear terms of the growth curve. This was performed in order to investigate whether there were correlations between the severity of the tinnitus (assessed by THI) and the average temporal changes of the pupil dilation. No significant correlations were found between the THI and any of the pupil variables (r = .24, p = .36 for NoNR50; r = − .08, p = .77 for NR50; r = −.08, p = .76 for NoNR95; and r = −.04, p = .88 for NR95).
Does Tinnitus and Tinnitus Severity Affect Fatigue?
NFR, pupil baselines
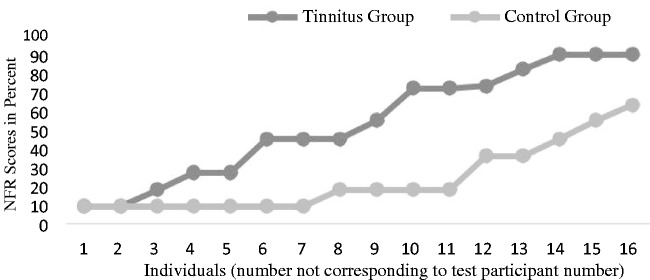
The NFR was performed to measure participants’ level of self-reported daily life fatigue. The average test result of the TG was 51.5% (SD 28.9%), ranging from 9% to 90%, and for the CG, the average was 23.1% (SD 18.1%), ranging from 9% to 63%. An independent samples t test showed a significant difference in the fatigue scores, F(1, 30) = 6.1, p = < .005, indicating a greater level of fatigue for the TG. Figure 10 shows the individual NFR scores for each group, where the scores have been sorted from smallest to largest scores in each group.
Figure 10.
Individual NFR scores on groups, sorted from smallest to largest.
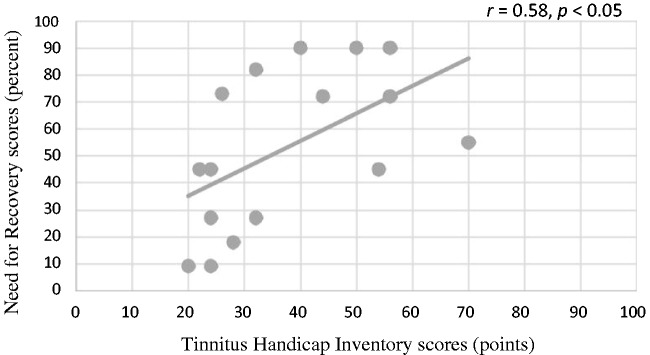
A significant, moderate correlation was found between the THI and the NFR scores, (r = .58, p < .05), indicating that the greater the degree of tinnitus severity, the greater the level of fatigue. Figure 11 displays a scatterplot of the THI scores as a function of NFR scores.
Figure 11.
Scatterplot of THI as a function of NFR.
Ultimately, because group differences on NFR were identified, it was investigated whether the course of the experiment had an effect on pupil baseline. A paired samples t test showed a significant reduction in the pupil baseline from the first to the last condition of the experiment, F(1, 30) = 3.6, p = .001, with a mean difference of 0.22 mm, but no significant difference between groups (p = .12 for the first condition and p = .08 for the last condition).
Discussion
This study investigated the effect of tinnitus on processing effort as indicated by the pupillary response while recognizing sentences in noise in a group of hearing-impaired (HI) people with tinnitus. Pupillary response was measured while participants were performing the Danish speech-in-noise test at two different speech intelligibility levels (L50 and L95) with an NR scheme either inactive or active (NoNR and NR). To the best of our knowledge, this is the first study that has examined the effect of tinnitus on effort by means of pupillometry during speech recognition in noise.
Generally, the pupil data analysis revealed a main effect of speech intelligibility and NR on pupil dilation, which corroborates previous pupillometry studies (Ohlenforst et al., 2017; Wendt et al., 2017; Zekveld et al., 2010, 2011). With regard to the effect of tinnitus on effort, it was hypothesized (H1) that the TG would show greater pupillary responses, indicating a greater task-induced effort; furthermore, it was hypothesized (H2) that an NR scheme would reduce the pupillary responses. It was also hypothesized (H3) that the subjective measure of the perceived severity of the tinnitus would correlate with the pupillary response parameters, such that the worse the tinnitus was experienced, the greater the effort that was employed in the recognition task. Furthermore, that the subjective measure of tinnitus would correlate with subjective measure of self-reported daily life fatigue and NFR, indicating that the last would be greater in tinnitus patients with greater tinnitus severity. Finally, it was hypothesized (H4) that the TG would show significantly increased NFR than the CG. It was also investigated if the pupil baselines were affected over time from the beginning to the end of the experiment. In the following section, the results will be discussed with regard the above hypotheses.
Effect of Tinnitus on Processing Effort
The results indicated that tinnitus does not seem to have a significant effect on either the recognition performance or the PPD in any of the four conditions. A GCA was employed to quantify the influence of tinnitus on pupil dilation across time. The analyses revealed significant differences between the TG and CGs in the overall mean and the overall slope of the pupillary response in three out four conditions, as well as the shape of the primary inflection point of the curve in one condition. Interestingly, the CG showed pupil dilations with greater overall mean and overall slope. This is contradictory to the hypothesis.
It is possible that tinnitus affects processing effort but that PPD is not a sufficiently sensitive measure for detecting it. This lack of sensitivity is supported by the GCA analysis, which demonstrated significantly smaller overall level and slope of the curves in the TG in three of four conditions. Because the groups were performing equally on speech recognition and have no significantly different SNRs, age, or hearing loss, it may seem counterintuitive that individuals with tinnitus and hearing loss should have smaller dilations, in the light of the research that has shown that larger peaks of dilations are associated with greater effort (e.g., Wendt et al., 2017; Zekveld & Kramer, 2014). However, previous studies that compared HI to NH people found that HI actually shows smaller PPDs than NH (Kramer et al., 2006; Wang et al., 2017; Zekveld et al., 2011) in some situations. Although this study did not find the TG to have smaller PPDs than the CG, the GCA showed that on temporal changes, the TG in general had smaller dilations while performing the task. Furthermore, this study found significantly increased NFR scores in the TG, indicating a group effect of (chronic) fatigue. Previous research (Wang et al., 2017) found that increased levels of NFR were associated with reduced task-evoked pupil dilation. In this study, the TG showed significantly smaller dilations on the GCA and significantly increased levels of NFR, a self-assessment of daily life fatigue. It is not clear whether it is the tinnitus or the higher level of NFR that caused differences in the pupillary response, and likewise whether it is the tinnitus that causes a greater NFR, or an increased daily life fatigue that worsens tinnitus symptoms. Nevertheless, it is speculated that the tinnitus patients may have greater inhibition of the PNS, which could have caused the relatively smaller temporal changes in pupillary responses. Wang et al. (2018) applied pupillometry to investigate processing effort required for speech recognition in noise. Interestingly, they tested this in both light and dark, as the SNS and PNS have different amounts of contribution to the pupil response according to the amount of light. By testing pupil dilation in both light and dark, the authors were able to disentangle the contribution to the pupil response for those two branches of the autonomic nervous system. They found that individuals with greater needs for recovery (independent of hearing status) showed smaller PPDs when tested in light, and they speculated that a smaller dilation indicated a higher PNS activity. They reason that the PNS is essential during recovery from stress, such that individuals who on a daily basis experience a greater NFR (i.e., a greater level of fatigue) may have an excessively activated PNS in stress situations, when the SNS should be in charge. Likely, tinnitus affects the ability to “wind down,” as tinnitus is often most disturbing in otherwise calm situations, such as reading in quiet or attempting to fall asleep. It may be possible that persons with tinnitus experience a greater PNS activity as a result of this, thus disturbing the “rest and digest” response. Wang et al. (2017) did not find significant differences in NFR between HI and NH and speculated whether other factors such as anxiety and personality may be better predictors of daily life fatigue. This study showed that tinnitus may be a predictor of NFR, highlighting the need for research to control for tinnitus when investigating topics such as fatigue as well as task-evoked pupil dilation. Furthermore, previous research (e.g., Jiang et al., 2003) found increased levels of fatigue in individuals with anxiety, and anxiety has previously been found to be comorbid with tinnitus (Guitton 2006; Landgrebe & Langguth, 2011; Pattyn et al., 2016), emphasizing the need to consider tinnitus in patients when conducting research. The pupil baseline was analyzed for changes from the beginning to the end of the experiment, to investigate any acute fatigue influence on pupillary responses. A significant reduction in the pupil baseline was found, but no significant differences were found between groups. This suggests an effect of acute fatigue of the experiment on all participants, regardless of the presence of tinnitus or higher NFR. This effect has previously been reported (e.g., Klingner, 2010). It is interesting that this effect does not seem to differ between groups, as the TG showed signs of greater long-term fatigue. An effect of the experiment was found despite having included two breaks during the experiment, and the freedom of taking more breaks for the participants.
This study further investigated the benefit of an NR scheme for the two groups. Wendt et al. (2017) showed that participants with hearing loss show a benefit of an NR scheme that is applied in modern HAs on effort. We hypothesized that this effect is also found in the current study, and found no significant difference between groups in PPD as a function of the active NR scheme. Interestingly, even though the TG showed smaller dilations, there was a tendency that the reduction in PPD was larger for the TG than the CG. Thus, even though the TG may have smaller dilations (possibly due to an increased PNS activity), they still show a benefit of the signal processing on processing effort that is similar to the CG. These results have clinical implications, providing evidence to clinicians that difficult-to-fit patients, such as those with tinnitus, can benefit equally from having a program in their HAs with advanced signal processing, giving them the benefit of reduced effort.
Correlations Between Pupillary Response, Tinnitus Severity, and NFR
This study found no significant correlations between tinnitus self-report measurements and PPDs, nor the average individual coefficients of the GCA model. There was evidence to support a hypothetical relationship between degree of tinnitus and pupillary responses (e.g., Stevens et al., 2007, who found slower reaction times in tinnitus patients; Cuny et al., 2004, who found tinnitus severity to be associated with attentional disturbances; Rossiter et al., 2006, who found poorer performance on WM tasks in tinnitus patients). However, it is noted that discrepancies between subjective measures and performance on behavioral tasks or objective measurements in tinnitus research are often found (Andersson & McKenna, 2006).
As mentioned earlier, the TG was significantly more fatigued based on NFR scores, and the THI significantly and moderately correlated with NFR. It is unclear whether fatigue causes tinnitus symptoms to worsen or if tinnitus causes fatigue, but a relationship between the two seems to exist. This is not unexpected and is consistent with previous studies. For example, tinnitus has been found to be connected with emotional exhaustion (Hébert et al., 2012), with sleep disturbance (Alster et al., 1993), and with insomnia (Crönlein et al., 2007; Folmer & Griest, 2000). The prevalence of fatigue in participants with tinnitus has clinical implications. In addition to personal costs, fatigue may have socioeconomic consequences, because it can result in longer leaves of absences from work. Persons in employment who suffer from the combination of hearing loss and tinnitus may be at a similar risk of developing chronic fatigue similar to other chronic health conditions (Hornsby et al., 2016). Treatments for tinnitus may benefit from including aspects of treatment that identify and prevent fatigue from developing, thus keeping the risk of personal and socioeconomic costs at bay. This is especially relevant as the correlation between the measure of tinnitus severity and fatigue level indicates that the worse your tinnitus affects you, the more fatigued you are likely to be.
Limitations
It is noted that there was a large variance in this study in general. The age span of all participants ranged from 45 to 84 years. The individual SNR necessary for 50% and 95% also ranged greatly, from −3.7 to 8.9 for the 50% level and from 1.4 to 12.8 for the 95% level. Although there were no significant differences between the groups on any of these parameters, some co-varying factors seem to exist, which could have influenced the individual amount of processing effort and pupillary response data. For example, increased age is accompanied by a greater vocabulary and linguistic expertise (Zekveld et al., 2011). This dynamic may influence the easiness of a speech recognition task such as the HINT, which was used in this study. However, Zekveld et al. (2011) found that an increased vocabulary ability was associated with greater processing effort as measured by pupillometry. They also found that older age was associated with greater processing effort. In this study, the effects of age and vocabulary were not assessed, which nonetheless may have contributed to the large variances seen in the results. Future studies could focus on including factors like age and vocabulary scores in pupil analysis models.
It would be especially useful to investigate the pupillary response for speech recognition in quiet. Here, it is speculated that there may be a difference between individuals with tinnitus and hearing loss and individuals with only hearing loss, as it will be an easy condition for the group with hearing loss, but a condition where the tinnitus may be audible and disturbing. In speech-in-noise situations such as the HINT, the sound pressure level is likely high enough to mask the audibility of the tinnitus. Perhaps the effects of the tinnitus would be found later (some hours after the experiment where aftermaths of acute fatigue may occur) and not actually during the task where the tinnitus may be masked.
Conclusions
This study demonstrated no significant group differences in terms of processing effort as measured by the PPD between participants with tinnitus and hearing loss and participants with only hearing loss. However, significant differences in the overall mean and slope of the pupillary response were measured in the TG, indicating overall decreased pupillary response in the TG. It was argued that smaller dilations may be due to greater levels of daily life fatigue and NFR.
Benefits of an NR scheme on effort that have previously been seen in research were found to apply equally well to individuals with tinnitus, as the reduction in PPDs due to an active NR scheme was similar for both groups.
No correlation was found between subjective measures of tinnitus and PPD nor individual coefficients of the GCA. However, participants with tinnitus reported significantly increased levels of self-reported daily life fatigue on the NFR, which may have clinical as well as research implications.
Acknowledgments
The authors would like to thank Oticon A/S for providing equipment and necessary resources to the study. The authors also thank Thomas Behrens sincerely for his ideas in relation to this research, as well as Renskje D. Hietkamp for her clinical support. Patrycja Książek also deserves deep gratitude for her support with the growth curve analysis. Finally, the authors thank the participants in this study, without whom the research would not have been possible.
Declaration of Conflicting Interests
The authors declared no potential conflicts of interest with respect to the research, authorship, and/or publication of this article.
Funding
The authors received no financial support for the research, authorship, and/or publication of this article.
References
- Alster J., Shemesh Z., Ornan M., Attias J. (1993) Sleep disturbance associated with chronic tinnitus. Biological Psychiatry 34(1–2): 84–90. 10.1016/0006-3223(93)90260-K. [DOI] [PubMed] [Google Scholar]
- Andersson G., Lyttkens L., Larsen H. C. (1999) Distinguishing levels of tinnitus distress. Clinical Otolaryngology 24(5): 404–410. 10.1046/j.1365-2273.1999.00278.x. [DOI] [PubMed] [Google Scholar]
- Andersson G., McKenna L. (2006) The role of cognition in tinnitus. Acta Oto-Laryngologica 126: 39–43. 10.1080/03655230600895226. [DOI] [PubMed] [Google Scholar]
- Aston-Jones G., Cohen J. D. (2005) An integrative theory of locus coerulus-norepineprhone function: Adaptive gain and optimal performance. Annual Review of Neuroscience 28: 403–450. [DOI] [PubMed] [Google Scholar]
- Axelsson A., Ringdahl A. (1989) Tinnitus—A study of its prevalence and characteristics. British Journal of Audiology 23: 1 10.3109/03005368909077819. [DOI] [PubMed] [Google Scholar]
- Baguley D., Andersson G., McFerran D., McKenna L. (2013) Consequences and moderating factors. In: Baguley D., Andersson G., McFerran D., McKenna L. (eds) Chapter 7 Tinnitus: A multidisciplinary approach, 2nd ed Oxford, England: Blackwell Publishing Ltd; 10.1002/9781118783009.ch7. [DOI] [Google Scholar]
- Bates B., Mächler M., Bolker B. M., Walker S. C. (2015) Fitting linear mixed-effects models using lme4. Journal of Statistical Software 67: 1–48. [Google Scholar]
- Beatty J. (1982) Task-evoked pupillary responses, processing load, and the structure of processing resources. Psychological Bulletin 91(2): 276–292. [PubMed] [Google Scholar]
- Crönlein T., Langguth B., Geisler P., Hajak G. (2007) Tinnitus and insomnia. Progress in Brain Research 166: 227–233. 10.1016/S0079-6123(07)66021-X. [DOI] [PubMed] [Google Scholar]
- Cuny C., Norena A., El Massioui F., Chéry-Croze S. (2004) Reduced attention shift in response to auditory changes in subjects with tinnitus. Audiology & Neuro-Otology 9(5): 294–302. 10.1159/000080267. [DOI] [PubMed] [Google Scholar]
- Davis A., Rafaie E. A. (2000) Medical and surgical evaluation and management of tinnitus. Tinnitus handbook, San Diego, CA: Singular Publishing. [Google Scholar]
- Folmer R. L., Griest S. E. (2000) Tinnitus and insomnia. American Journal of Otolaryngology 21(5): 287–293. 10.1053/ajot.2000.9871. [DOI] [PubMed] [Google Scholar]
- Guitton M. J. (2006) Tinnitus and anxiety: More than meets the ear. Current Psychiatry Reviews 2(3): 333–337. 10.2174/157340006778018139. [DOI] [Google Scholar]
- Hallam R. S., McKenna L., Shurlock L. (2004) Tinnitus impairs cognitive efficiency. International Journal of Audiology 43(4): 218–266. 10.1080/14992020400050030. [DOI] [PubMed] [Google Scholar]
- Hébert S., Canlon B., Hasson D. (2012) Emotional exhaustion as a predictor of tinnitus. Psychotherapy and Psychosomatics 81: 324–326. 10.1159/000335043. [DOI] [PubMed] [Google Scholar]
- Heeren A., Maurage P., Perrot H., De Volder A., Renier L., Araneda R., Phillippot P. (2014) Tinnitus specifically alters the top-down executive control sub-component of attention: Evidence from the attention network task. Behavioural Brain Research 269: 147–154. 10.1016/j.bbr.2014.04.043. [DOI] [PubMed] [Google Scholar]
- Hoffmann H. J., Reed G. W. (2004) Epidemiology of tinnitus. In: Snow J. B. (ed.) Tinnitus: Theory and management, Hamilton, Canada: BC Decker Inc. [Google Scholar]
- Horner K. C. (2003) The emotional ear in stress. Neuroscience and Biobehavioral Reviews 27: 437–446. [DOI] [PubMed] [Google Scholar]
- Hornsby B. W. Y., Naylor G., Bess F. H. (2016) A taxonomy of fatigue concepts and their relation to hearing loss. Ear and Hearing 37(1): 136–144. DOI: 10.1097/AUD.0000000000000289. [DOI] [PMC free article] [PubMed] [Google Scholar]
- Jensen, J., & Pedersen, M. S. (2015, April). Analysis of beamformer directed single-channel noise reduction system for hearing aid applications. Paper presented to the 2015 IEEE International Conference on Acoustics, Speech and Signal Processing (ICASSP), Brisbane, Australia. DOI: 10.1109/ICASSP.2015.7179069.
- Jiang N., Sato T., Hara T., Takedomi Y., Ozaki I., Yamada S. (2003) Correlations between trait anxiety, personality and fatigue: Study based on the Temperament and Character Inventory. Journal of Psychosomatic Research 55(6): 493–500. 10.1016/S0022-3999(03)00021-7. [DOI] [PubMed] [Google Scholar]
- Kahneman D. (1973) Attention and effort, Englewood Cliffs, NJ: Prentice-Hall. [Google Scholar]
- Khedr E. M., Ahmed M. A., Shawky O. A., Mohamed E. S., El Attar G. S., Mohammad K. A. (2010) Epidemiological study of chronic tinnitus in Assiut, Egypt. Neuroepidemiology 35(1): 45–52. 10.1159/000306630. [DOI] [PubMed] [Google Scholar]
- Kjems, U., & Jensen, J. (2012). Maximum likelihood based noise covariance matrix for multi-microphone speech enhancement. 2012 Proceedings of the 20th European signal processing conference (EUSIPCO), Bucharest, Romania (pp. 295–299). Piscataway, NJ: IEEE.
- Klingner, J. M. (2010). Measuring cognitive load during visual tasks by combining pupillometry and eye tracking (Doctoral dissertation). Stanford University, CA, USA.
- Koelewijn T., Zekveld A. A., Festen J. M., Kramer S. E. (2012) Pupil dilation uncovers extra listening effort in the presence of a single-talker masker. Ear and Hearing 33(2): 291–300. DOI: 10.1097/AUD.0b013e3182310019. [DOI] [PubMed] [Google Scholar]
- Koelewijn T., Zekveld A. A., Festen J. M., Kramer S. E. (2014) The influence of informational masking on speech perception and pupil response in adults with hearing impairment. Journal of the Acoustical Society of America 135(3): 1596–1606. 10.1121/1.4863198. [DOI] [PubMed] [Google Scholar]
- Kramer S. E., Kapteyn T. S., Houtgast T. (2006) Occupational performance: Comparing normally-hearing and hearing-impaired employees using the Amsterdam Checklist for hearing and work. International Journal of Audiology 45: 503–512. 10.1080/14992020600754583. [DOI] [PubMed] [Google Scholar]
- Kuchinsky S. E., Ahlstrom J. B., Vaden K. I., Cute S. L., Humes L. E., Dubno J. R., Eckert M. A. (2013) Pupil size varies with word listening and response selection difficulty in older adults with hearing loss. Psychophysiology 50: 23–34. 10.1111/j.1469-8986.2012.01477.x. [DOI] [PMC free article] [PubMed] [Google Scholar]
- Landgrebe M., Langguth B. (2011) Tinnitus and anxiety. In: Møller A. R., Langguth B., De Ridder D., Kleinjung T. (eds) Textbook of tinnitus, New York, NY: Springer; 10.3109/15622975.2011.575178. [DOI] [Google Scholar]
- Langguth B., Kreuzer P. M., Kleinjung T., De Ridder D. (2013) Tinnitus: Causes and clinical management. The Lancet Neurology 12(9): 920–930. 10.1016/S1474-4422(13)70160-1. [DOI] [PubMed] [Google Scholar]
- Lasisi A. O., Abiona T., Gureje O. (2010) Tinnitus in the elderly: Profile, correlates, and impact in the Nigerian Study of Ageing. Otolaryngology—Head and Neck Surgery 143(4): 510–515. 10.1016/j.otohns.2010.06.817. [DOI] [PubMed] [Google Scholar]
- Le Goff, N. (2015). Amplifying soft sounds—A personal matter. Oticon Whitepaper. Retrieved from http://www.oticon.global/evidence.
- Levitt H. (1971) Transformed up-down methods in psychoacoustics. Journal of the Acoustical Society of America 49(2B): 467 10.1121/1.1912375. [DOI] [PubMed] [Google Scholar]
- Mattys S. L., David M. H., Bradlow A. R., Scott S. K. (2012) Speech recognition in adverse conditions: A review. Language and Cognitive Processes 27: 953–978. 10.1080/01690965.2012.705006. [DOI] [Google Scholar]
- McKenna L., Hallam R. (1999) A neuropsychological study of concentration problems in tinnitus patients. In: Hazel J. (ed.) Proceedings of the sixth international tinnitus seminar, London, England: The Tinnitus and Hyperacusis Centre, pp. 108–113. [Google Scholar]
- Michikawa T., Nishiwaki Y., Kikuchi Y., Saito H., Micutari L., Okamoto M., Takebayashi T. (2010) Prevalence and factors associated with tinnitus: A community-based study of Japanese elders. Journal of Epidemiology 20(4): 271–276. 10.2188/jea.JE20090121. [DOI] [PMC free article] [PubMed] [Google Scholar]
- Mirman, D. (2014). Growth curve analysis. Retrieved from http://www.danmirman.org/gca.
- Mirman D., Dixon J. A., Magnuson J. S. (2008) Statistical and computational models of the visual world paradigm: Growth curves and individual differences. Journal of Memory and Language 59: 475–494. 10.1016/j.jml.2007.11.006. [DOI] [PMC free article] [PubMed] [Google Scholar]
- Mohamad J., Hoare D. J., Hall D. A. (2016) The consequences of tinnitus and tinnitus severity on cognition: A review of the behavioural evidence. Hearing Research 332: 199–209. 10.1016/j.heares.2015.10.001. [DOI] [PubMed] [Google Scholar]
- Nachtegaal J., Festen J. M., Kramer S. E. (2012) Hearing ability in working life and its relationship with sick leave and self-reported work productivity. Ear and Hearing 33: 94–103. DOI: 10.1097/AUD.0b013e318228033e. [DOI] [PubMed] [Google Scholar]
- Newman C. W., Jacobsen G. P., Spitzer J. B. (1996) Development of the Tinnitus Handicap Inventory. JAMA Otolaryngology—Head & Neck Surgery 122(2): 143–148. DOI: 10.1001/archotol.1996.01890140029007. [DOI] [PubMed] [Google Scholar]
- Newman C. W., Sandridge S. A., Bolek L. (2008) Development and psychometric adequacy of the screening version of the Tinnitus Handicap Inventory. Otology & Neurotology 29: 276–281. [DOI] [PubMed] [Google Scholar]
- Nielsen J. B., Dau T. (2011) The Danish hearing in noise test. International Journal of Audiology 50(3): 202–208. 10.3109/14992027.2010.524254. [DOI] [PubMed] [Google Scholar]
- Nilsson M., Soli S. D., Sullivan J. A. (1994) Development of the Hearing In Noise Test for the measurement of speech reception thresholds in quiet and in noise. The Journal of the Acoustical Society of America 95(2): 1085–1099. 10.1121/1.408469. [DOI] [PubMed] [Google Scholar]
- Nondahl D. M., Cruickshanks K. J., Wiley T. L., Klein R., Klein B. E. K., Tweedm T. S. (2002) Prevalence and 5-year incidence of tinnitus among older adults: The epidemiology of hearing loss study. Journal of the American Academy of Audiology 13(6): 323–331(9). DOI: 10.1001/archotol.129.10.1041. [PubMed] [Google Scholar]
- Ohlenforst B., Zekveld A. A., Jansma E. P., Wang Y., Naylor G., Lorens A., Kramer S. E. (2017) Effects of hearing impairment and hearing aid amplification on listening effort: A systematic review. Ear and Hearing 38(3): 267–281. DOI: 10.1097/AUD.0000000000000396. [DOI] [PMC free article] [PubMed] [Google Scholar]
- Pattyn T., Eede V. D., Vanneste S., Cassiers L., Veltman D. J., Van De Heyning P., Sabbe B. C. G. (2016) Tinnitus and anxiety disorders: A review. Hearing Research 333: 255–265. 10.1016/j.heares.2015.08.014. [DOI] [PubMed] [Google Scholar]
- Pichora-Fuller M. K., Kramer S. E., Eckert M., Edwards B., Hornsby B. W. Y., Humes L. E., Wingfield A. (2016) Hearing impairment and cognitive energy: The framework for understanding effortful listening (FUEL). Ear and Hearing 37: 5–27. DOI: 10.1097/AUD.0000000000000312. [DOI] [PubMed] [Google Scholar]
- Ries P. W. (1994) Prevalence and characteristics of persons with hearing trouble: United States, 1990–91. Vital and Health Statistics. Series 10, Data for National Health Survey ▪▪(188): 1–75. [PubMed] [Google Scholar]
- Rossiter S., Stevens C., Walker G. (2006) Tinnitus and its effect on working memory and attention. Journal of Speech. Language and Hearing Research 49(1): 150–160. DOI: 10.1044/1092-4388(2006/012). [DOI] [PubMed] [Google Scholar]
- Shargorosky J., Curhan G. C., Farwell W. R. (2010) Prevalence and characteristics of tinnitus among US adults. The American Journal of Medicine 123: 711–718. 10.1016/j.amjmed.2010.02.015. [DOI] [PubMed] [Google Scholar]
- Stevens C., Walker G., Boyer M., Gallagher M. (2007) Severe tinnitus and its effect on selective and divided attention. International Journal of Audiology 46(5): 208–216. 10.1080/14992020601102329. [DOI] [PubMed] [Google Scholar]
- Stouffer J. L., Tyler R. S. (1990) Characterization of tinnitus by tinnitus patients. Journal of Speech and Hearing Disorders 55: 439–453. DOI: 10.1044/jshd.5503.439. [DOI] [PubMed] [Google Scholar]
- Tegg-Quinn S., Bennet R. J., Eikelboom R. H., Baguley D. M. (2016) The impact of tinnitus upon cognition in adults: A systematic review. International Journal of Audiology 55: 533–540. 10.1080/14992027.2016.1185168. [DOI] [PubMed] [Google Scholar]
- Tyler R. S., Baker L. J. (1983) Difficulties experiences by tinnitus sufferers. Journal of Speech and Hearing Disorders 48: 150–154. DOI: 10.1044/jshd.4802.150. [DOI] [PubMed] [Google Scholar]
- Van Veldhoven M. J. P. M., Broersen S. (2003) Measurement quality and validity of the “need for recovery scale”. Occupational and Environmental Medicine 60(suppl 1): i3–i9. 10.1136/oem.60.suppl_1.i3. [DOI] [PMC free article] [PubMed] [Google Scholar]
- Wang, Y., Kramer, S. E., Wendt, D., Naylor, G., Lunner, T., & Zekveld., A. A. (2018). The pupil dilation response during speech perception in dark and light: The involvement of the parasympathetic nervous system in listening effort. Manuscript submitted for publication.
- Wang Y., Naylor G., Kramer S. E., Zekveld A. A., Wendt D., Ohlenforst B., Lunner T. (2017) Relations between self-reported daily-life fatigue, hearing status, and pupil dilation during a speech perception in noise task. Ear and Hearing 39: 573–582. DOI: 10.1097/AUD.0000000000000512. [DOI] [PMC free article] [PubMed] [Google Scholar]
- Wendt D., Hietkamp R. K., Lunner T. (2017) Impact of noise and noise reduction on processing effort: A pupillometry study. Ear and Hearing 38: 690–700(11). 10.1097/AUD.0000000000000454. [DOI] [PubMed] [Google Scholar]
- Wendt, D., Koelewijn, T., Ksiazek, P., Kramer, S. E., & Lunner, T. (2018). Toward a more comprehensive understanding of the impact of masker type and signal-to-noise ratio on the pupillary response while performing a speech-in-noise test. Hearing Research. Advance online publication. doi:10.1016/j.heares.2018.05.006. [DOI] [PubMed]
- Winn M. B., Edwards J. R., Litovsky R. Y. (2015) The impact of auditory spectral resolution on listening effort revealed by pupil dilation. Ear and Hearing 36(4): e153–e165. DOI: 10.1097/AUD.0000000000000145. [DOI] [PMC free article] [PubMed] [Google Scholar]
- Xu X., Bu X., Zhou L., Xing G., Liu C., Wang D. (2011) An epidemiologic study of tinnitus in a population in Jiangsu Province, China. Journal of the American Academy of Audiology 22(9): 578–585. 10.3766/jaaa.22.9.3. [DOI] [PubMed] [Google Scholar]
- Zachariae R., Mirz F., Vendelbo Johansen L., Andersen S. E., Bjerring P., Brahe Pedersen C. (2000) Reliability and validity if a Danish adaptation of the Tinnitus Handicap Inventory. Scandinavian Audiology 29(1): 37–43. 10.1080/010503900424589. [DOI] [PubMed] [Google Scholar]
- Zekveld A. A., Kramer S. E. (2014) Cognitive processing load across a wide range of listening conditions: Insights from pupillometry. Psychophysiology 51(3): 277–284. 10.1111/psyp.12151. [DOI] [PubMed] [Google Scholar]
- Zekveld A. A., Kramer S. E., Festen J. M. (2010) Pupil response as an indication of effortful listening: The influence of sentence intelligibility. Ear and Hearing 31: 480–490. DOI: 10.1097/AUD.0b013e3181d4f251. [DOI] [PubMed] [Google Scholar]
- Zekveld A. A., Kramer S. E., Festen J. M. (2011) Cognitive load during speech perception in noise: The influence of age, hearing loss, and cognition on the pupil response. Ear and Hearing 32(4): 4978–510. DOI: 10.1097/AUD.0b013e31820512bb. [DOI] [PubMed] [Google Scholar]


