Abstract
Brain imaging technology provides a powerful tool to visualize the living human brain, provide insights into disease mechanisms, and potentially provide a tool to assist clinical decision-making. The brain has a very specific structural substrate providing a foundation for functional information; however, most studies ignore the very interesting and complex relationships between brain structure and brain function. While a variety of approaches have been used to study how brain structure informs function, the study of such relationships in living humans in most cases is limited to noninvasive approaches at the macroscopic scale. The use of data-driven approaches to link structure and function provides a tool which is especially important at the macroscopic scale at which we can study the human brain. This paper reviews data-driven approaches, with a focus on independent component analysis approaches, which leverage higher order statistics to link together macroscopic structural and functional MRI data. Such approaches provide the benefit of allowing us to identify links which do not necessarily correspond spatially (eg, structural changes in one region related to functional changes in other regions). They also provide a “network level” perspective on the data, by enabling us to identify sets of brain regions that covary together. This also opens up the ability to evaluate both within and between network relationships. A variety of examples are presented, including several showing the potential of such approaches to inform us about mental illness, particularly about schizophrenia.
Keywords: brain function, brain structure, data driven, mental illness
Abstract
La tecnología de las imágenes cerebrales provee una herramienta poderosa para visualizar el cerebro humano en vivo, aporta información sobre los mecanismos de la enfermedad y potencialmente entrega una herramienta para apoyar la toma de decisiones clínicas. El cerebro tiene un sustrato estructural muy específico que sirve de base para la información funcional; sin embargo, la mayoría de los estudios ignora las relaciones muy complejas e interesantes entre la estructura y la función del cerebro. Si bien se ha empleado una variedad de enfoques para estudiar cómo la estructura cerebral da cuenta de su función, el estudio de estas relaciones en humanos vivos en la mayoría de los casos se limita a enfoques no invasivos a escala macroscópica. El empleo de propuestas en base a datos para relacionar estructura y función entrega una herramienta que es especialmente importante a escala macroscópica, con la cual podemos estudiar el cerebro humano. Este artículo revisa las propuestas en base a datos, focalizándose en las propuestas de análisis de componente independiente, que aprovechan las estadísticas de orden superior para relacionar los datos macroscópicos estructurales y la información de la RNM funcional. Dichas propuestas nos permiten identificar vinculationes que no necesariamente tienen una correspondencia espacial (por ej. cambios estructurales en una región relacionados con cambios funcionales en otras regiones). Además aportan una perspectiva de “nivel de red” de los datos, lo que permite identificar grupos de regiones cerebrales correlationados entre ellos. Esto también abre la capacidad de evaluar tanto dentro como entre las relaciones de la red. Se presenta una variedad de ejemplos, incluyendo algunos que muestran el potencial de tales propuestas para conocer acerca de la enfermedad mental, especialmente sobre la esquizofrenia.
Abstract
L'imagerie cérébrale est un outil puissant de visualisation du cerveau humain vivant, elle offre un aperçu des mécanismes pathologiques et apporte potentiellement un moyen d'assistance à la prise de décision clinique. Le cerveau présente un substrat structurel très spécifique permettant de fonder les informations fonctionnelles ; cependant, la plupart des études ignorent les relations très intéressantes et complexes existant entre la structure et la fonction cérébrales. Bien qu'une multitude d'approches ont été utilisées pour étudier comment la structure cérébrale informe la fonction, l'étude de ces relations chez les humains vivants est dans la plupart des cas limitée aux approches non invasives à l'échelle macroscopique. L'approche guidée par les données pour lier la structure et la fonction fournit un outil particulièrement important à l'échelle macroscopique, qui permet d'étudier le cerveau humain. Cet article présente les approches guidées par les données, et insiste sur l'analyse en composantes indépendantes, qui exploite des statistiques d'ordre plus élevé pour lier entre elles des données d'IRM structurelles et fonctionnelles macroscopiques. Ces approches ont l'avantage de permettre d'identifier des liens qui ne correspondent pas nécessairement spatialement (par ex. des changements structuraux d'une région liés à des changements fonctionnels d'autres régions). Elles apportent aussi une perspective de « niveau de réseau » sur les données, et permettent d'identifier des groupes de régions cérébrales corrélés entre eux. Ceci ouvre aussi la possibilité d'évaluer les relations à la fois intra- et inter-réseau. Plusieurs exemples sont présentés, dont certains montrent le potentiel d'information de telles approches sur les maladies mentales, en particulier sur la schizophrénie.
Introduction
Magnetic resonance imaging (MRI) data is a powerful tool which can provide us with detailed information about both brain structure and brain function. The use of high-resolution T1-weighted scans provides comprehensive anatomic information about brain tissue which can be used to estimate the volume of specific regions,1 cortical thickness,2 and networks of regions that covary together across individuals.3 Diffusion MRI (dMRI) gives information about white matter structure, and can be used to assess structural connectivity by using approaches to estimate various diffusion parameters including anisotropy4 as well as probabilistic tractography using tensor-based models4,5 and higher-order connectivity through multi-shell imaging and modeling with orientation distribution functions.6 Finally, functional MRI (fMRI) provides information about brain function via blood oxygenation level-dependent (BOLD) imaging over time7 and has been used to perform exquisite mapping of intrinsic connectivity networks.8 All three of these techniques compile important information about brain function and structure and have been widely used in the study of mental illness.
The structure-function synergy
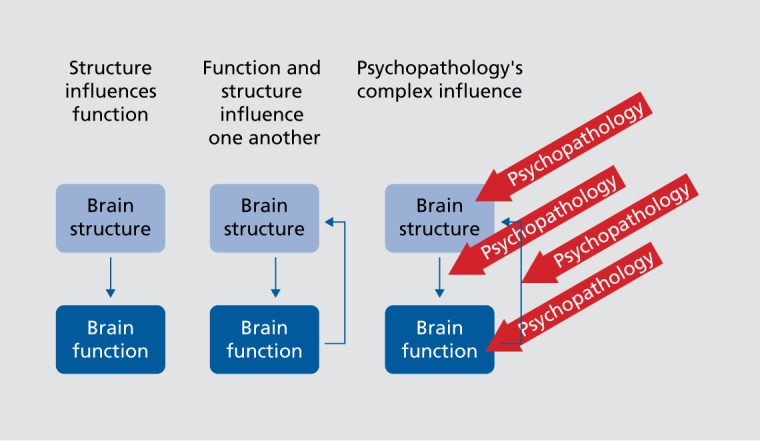
While the most obvious perspective is that structural information leads to subsequent functional changes, the plasticity of brain structure should also be kept in mind, as the functional activity may well reshape structure.9 It is also well known that structural sulcal/gyral boundaries definable at the macroscopic level do not necessarily correspond well to architectonic studies at the microscopic level.10 fMRI studies are improved if individualized functional boundaries are incorporated into the spatial normalization strategies.11 This complex synergy between structure and function increases the complexity of studying mental illnesses such as schizophrenia which are known to impact both structure and function. Figure 1 provides a simple illustration of these relationships; structure can be (and often is) claimed to be a fixed substrate onto which function operates. However, the reality is more complex as we know functional changes can also reshape brain structure, with such changes visible within days even at the macro level.9 This then highlights the complexity of studying psychopathology, as illness can impact structure or function direction, or the directional relationships between these two modalities.
Figure 1. Cartoon showing different relationships between brain structure and brain function and illustrating the complex relationship of these with psychopathology.
One of the challenges of complex mental illnesses such as schizophrenia is their highly intricate and diffuse presentation. That is, schizophrenia impacts much of the brain, and there are numerous examples of structural and functional deficits associated with the illness.12-14 The use of data-driven methods can be particularly useful in this regard, as one can analyze the whole brain with an unbiased lens allowing for weak contributions from many different brain regions. Likewise, the relationship between function and structure can be elucidated with flexible analysis approaches such as independent component analysis (ICA).15 ICA is a type of blind source separation16 which allows for the estimation of signals from complex data sets with minimal assumptions on their specific form. In particular, with ICA the goal is to extract maximally independent sources from the data, typically written X = AS where X is the data, A is an estimated mixing matrix, and S are the estimated maximally independent sources. In practice, the widely used ICA algorithms such as infomax17 and fastICA18 often include two complementary constraints, independence (ie, the maps are maximally independent of one another) and sparsity (ie, the maps have a small number of region with high values), which when combined provide for relatively well-behaved and interpretable results (eg, a component can be interpreted as a brain network19) as demonstrated by the extensive number of studies using this approach.20-25
Data-driven approaches like ICA can be used to extract brain networks from sMRI, dMRI, and fMRI data and also link together brain structure and brain function.26 Approaches that can capture all of the possible relationships illustrated in Figure 1 are needed as this is where data-driven approaches provide a distinct advantage. In addition, hybrid approaches that combine the flexibility of data-driven approaches with the ability to focus on specific networks and/or regions are also quite powerful in this context.27,28 There are a large number of studies to date which have used data-driven approaches such as ICA to study neuropsychiatry and neurological brain disorders.12,29,30 While the neuropsychiatry field is still very heterogeneous in findings, there is some evidence that the data-driven approaches are producing replicable and canonical results which reliably show differences in schizophrenia31 and show promise for the use of imaging to make diagnostic or treatment predictions.32
In this paper, we briefly introduce data-driven approaches to study brain structure and function with an emphasis on ICA-based approaches. Then we provide examples of several specific variations that have been used to analyze sMRI, dMRI, and fMRI data and also to link together these structural and functional modalities to study the healthy and diseased brain.
Data-driven approaches for analyzing brain structural and functional data
A data-driven approach includes minimizing the upfront assumptions and allowing the data to be the primary driver of the results. This includes approaches such as clustering,33 principle component analysis (PCA),34 ICA,35 and more. In the context of brain imaging data, ICA has proven to be highly versatile and is now a widely used approach.36 One of the likely reasons for this is that the resulting maps tend to be relatively well-behaved and interpretable due to the incorporation of both independence (which emphasizes non-systematically overlapping networks) and sparsity (which encourages more focal networks) in the estimation of the components.37
Source-based morphometry
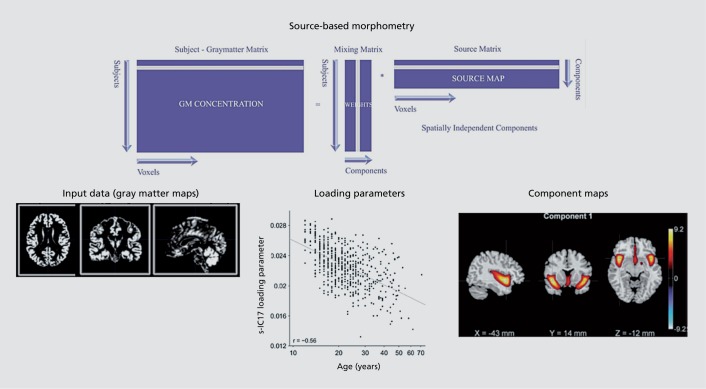
The use of ICA for sMRI analysis, called source-based morphometry (SBM),3 can be considered a multivariate extension of voxel-based morphometry.38 Essentially individual subject data are segmented, and gray-matter maps are organized into a matrix and entered into an ICA analysis that produces maximally spatially independent component maps. These maps include regions that show similar gray matter covariation across subjects. The degree to which they are “expressed” in the data is captured via their loading parameters (Figure 2). SBM has been studied with multi-site data and a number of the components have been found to be canonical, some consistently impacted by schizophrenia (such as the medial frontal/insular/temporal lobe component 1 in Figure 2).31
Figure 2. Source-based morphometry: input typically includes whole brain gray matter segmentation maps, output includes components (representing covarying gray matter regions) and their loading parameters (which can be tested for relationships with variables of interest such as age or group).
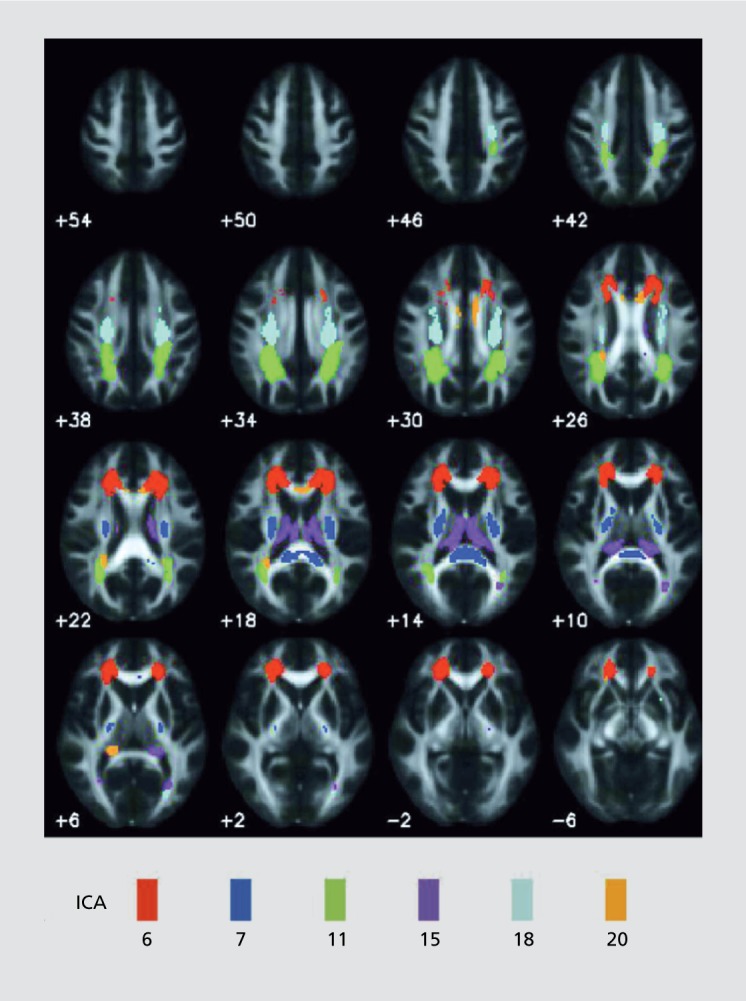
SBM can also be applied to dMRI data. For example, SBM can be used to analyze fractional anisotropy (FA) maps, which are essentially providing information about the directionality of the diffusion within each voxel. Figure 3 shows results from an SBM of FA study of patients with schizophrenia and healthy controls. A number of the SBM components showed group differences, with all of these showing reduced FA in schizophrenia. This included primarily frontal white matter (thalamic radiation, inferior fronto-occipital fasciculus, and the cingulum bundle) and temporal white matter (left inferior longitudinal fasciculus and the left inferior fronto-occipital fasciculus) in addition to forceps major, forceps minor, corticospinal tracts and the superior longitudinal fasciculus. A key advantage to this approach is that one does not have to make strong assumptions associated with the use of tract atlases. The results for ICA of SBM however do not inform us about the directionality of the diffusion data (an approach for this will be discussed later39); rather they identify regions that show similar between-subject covariation in FA values.
Figure 3. SBM on dMRI data identifies a number of white matter components (highlighted in different colors) all of which show reduced fractional anisotropy in schizophrenia compared with healthy controls. SBM, source-based morphometry; dMRI, diffusion magnetic resonance imaging.
Group ICA of fMRI data
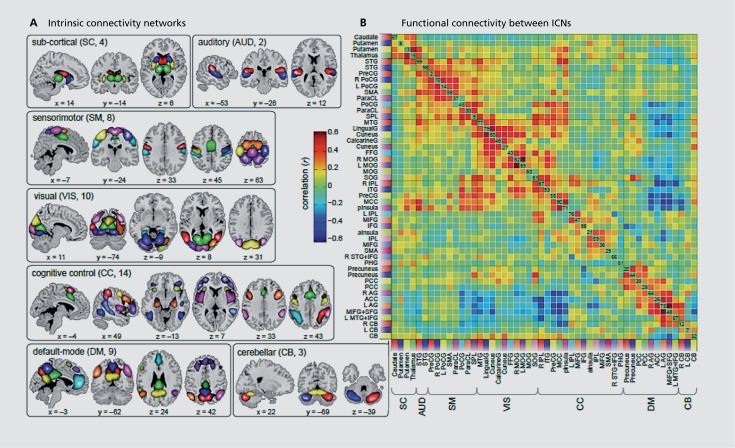
In the era of the connectome, which is essentially a structural map of brain connectivity,40 resting fMRI has entered, and enabled us to estimate a “functional” connectome. Both of these, as measured by MRI, provide a “macro” view of the connectome, a domain in which multiple spatial and temporal domains overlap with one another in a complex manner, nowhere near a microscopic map of neuronal connectivity, and difficult to predict. Using group ICA, one can extract networks that are functionally coherent, that is, identity networks that are showing correlated activity. The output from group ICA24,41 allows one to evaluate each network separately, essentially to evaluate the within-network connectivity, as well as to study the between-network connectivity, also called functional network connectivity (FNC; Figure 4). Importantly, one can also leverage single-subject spatial maps and timecourses that are estimated from the group ICA through a process called back-reconstruction.42 Group ICA thus allows estimation of changes in functional connectivity at the voxel level within specific networks, changes in the relationship between pairs of brain networks, as well as other information such as spectral response, and in the case of a task, modulation by task stimuli. One can then evaluate changes in the within and between network connectivity which are related to symptoms, cognitive scores, individual subject prediction of diagnosis or treatment response.
Figure 4. Examples of within and among network connectivity information. The left panel shows brain regions parcellated from resting fMRI data using group ICA and the right panel shows the functional network connectivity (FNC) matrix among these regions (cross-correlation).43 fMRI, functional magnetic resonance imaging; ICA, independent component analysis.
Time-varying connectivity
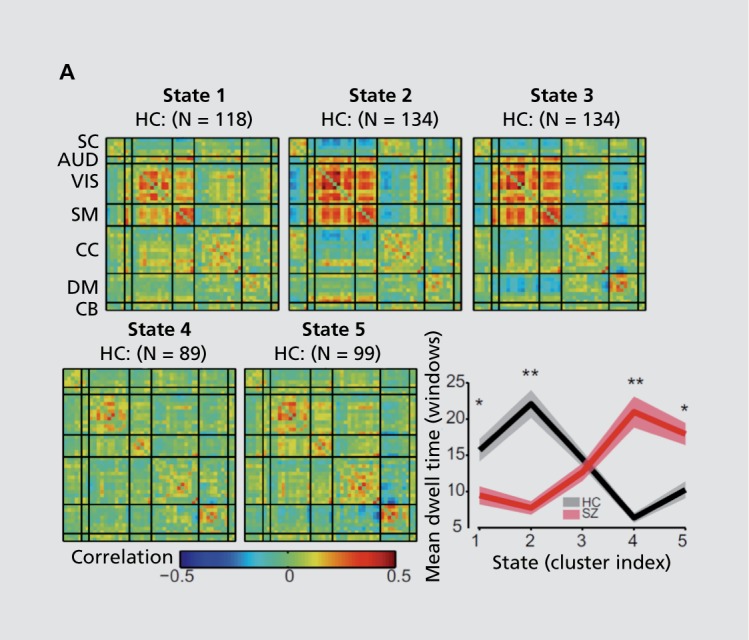
Recent years have seen a rapidly growing interest in the analysis of brain connectivity which can capture transient changes in connectivity within a given experiment.44,45 Such chronnectomic information provides a more natural way to analyze fMRI data, especially resting fMRI data which is unconstrained and likely contains many different unmeasured “tasks.” While the field continues to develop,46 recent work in this area has found high replicability,47 increased sensitivity to individual subject classification,48 and evidence of multiple sources of variation including sleep/arousal,49 emotion,50 and even mind wandering.51 In one study, a sliding-window approach was used, followed by clustering, to estimate patterns of connectivity from which individual subjects move into and out of over time. When evaluating the relationship of these “states” with schizophrenia, we found the patients tended to spend more time in the more weakly connected states and vice versa for the healthy controls43 (Figure 5). This expands our perspective on schizophrenia beyond the commonly observed weaker connectivity patterns. Additional relationships between cortical and subcortical structures (eg, putamen, thalamus) also showed strong state and group dependencies.43 Other work has identified the presence of “sticky states” whose presence is correlated with, eg, negative symptoms in the patients.52 Extensive ongoing work from many groups continues in this area and undoubtedly, such work will provide further insights into brain connectivity and hopefully schizophrenia. In a later section, we will discuss links between time-varying connectivity and brain structure.
Figure 5. Dynamic connectivity differences in schizophrenia can be studied by performing a time-varying analysis of the data. For the same data summarized in Figure 4, we show evidence of multiple transient connectivity patterns (left), which are differentially occupied by schizophrenia patients and controls as measured by the dwell-time, the average time spent in a given state until moving to a different state (right).43 .
Structural networks subserving functional networks
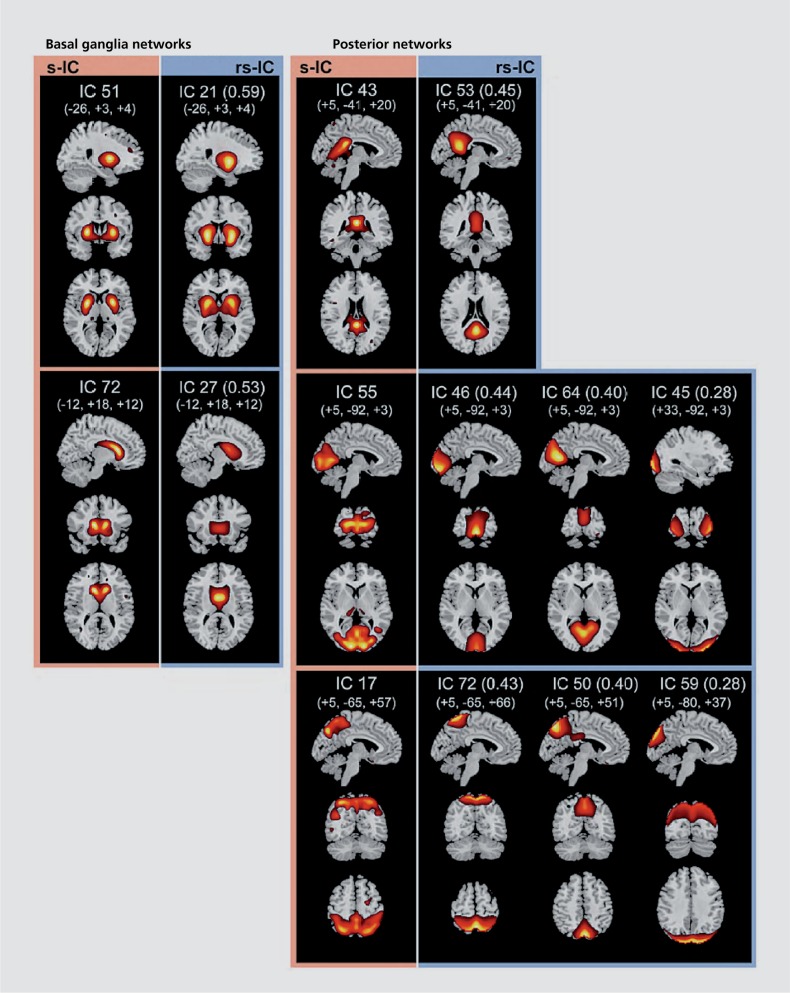
Interestingly, if one compares the results from SBM of sMRI data and group ICA of fMRI data, it is clear that some of the SBM components are quite similar to the resting fMRI networks that are widely studied. The sMRI maps resemble the fMRI maps, but with less specificity (that is typically multiple fMRI networks comprise a single sMRI network), as one might expect. Figure 6 shows an example of results from approximately 600 individuals comparing sMRI and fMRI networks.53
Figure 6. Comparison of resting fMRI brain networks (from group ICA, blue outline) and structural MRI brain networks (from SBM, pink outline) show striking similarities with the resting fMRI networks being subdivided more than the sMRI networks53 (ie, multiple resting networks often correspond to a single sMRI network). fMRI, functional magnetic resonance imaging; ICA, independent component analysis; SBM, source-based morphometry.
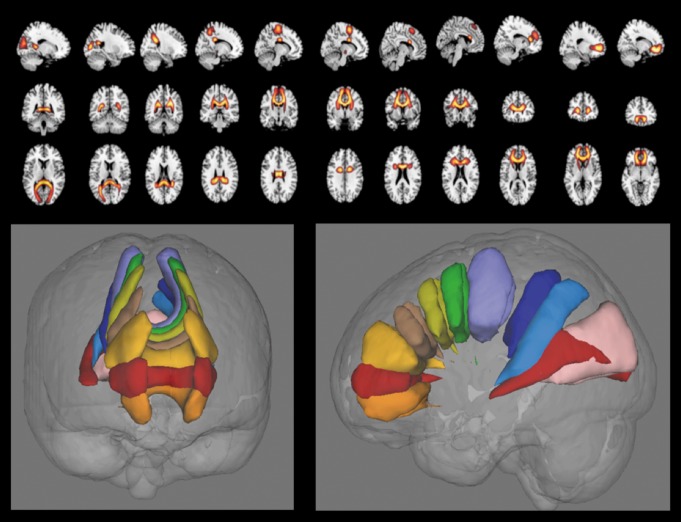
The group ICA model can also be used to analyze probabilistic dMRI data in a data-driven manner39 which, in contrast to SBM of FA, preserves the directional information contained in the dMRI data. In that case, one computes a region-by-region (or voxel-by-voxel) matrix for each individual which contains the diffusion probabilities for traversing the space and enters these matrices into group ICA. This is called connectivity matrix ICA (cmICA). The results from a subset of corpus callosum components output from a cmICA analysis of almost 600 individuals are shown in Figure 7. This model provides a powerful way to decompose such data which is not restricted to specific regions of interest or specific atlases of tracts, allowing the data to speak for itself. Importantly, it also enables us to directly relate seed-based connectivity to group ICA results, and provides a computationally much faster way to compute these measures.39 Using the single-subject output from the back-reconstruction step allows calculation of group differences in the identified components.39 One can also combine both functional and structural information within a single analysis using such a model.
Figure 7. cmICA components from an analysis of probabilistic diffusion captures regions that are showing similar orientation in their diffusion profiles. Both individual components (top) as well as a rendering for components that were traversing the corpus callosum (bottom) are shown. cmICA, connectivity matrix ICA.
Deep learning
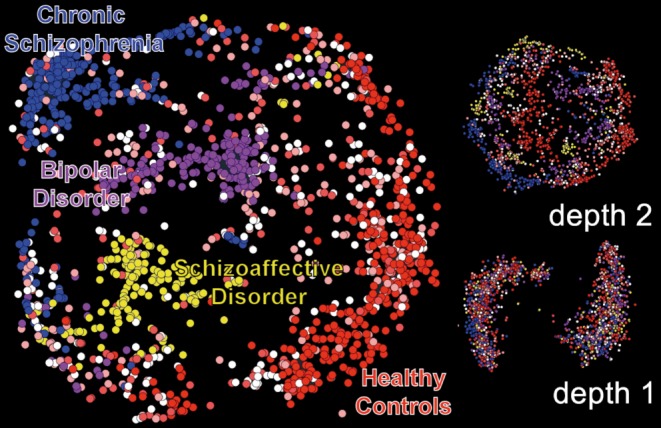
More recent models include the development of deep learning approaches which can be applied to neuroscience data.54 Deep learning refers to an approach in which multiple models are essentially combined together to create a more complex (deeper) model. Deep learning is typically implemented as a stacked neural network, and as such is closely related to ICA (ICA can be modeled as a single-layer neural network). This allows for the capture of more complex and nonlinear relationships within the data. Interestingly, the restricted Boltzmann machine (RBM), a building block of deep learning models, provides results that are highly similar to those of ICA.55 Figure 8 shows an example of the application of a deep belief network (essentially stacks of RBMs) to sMRI data from a range of patients including schizophrenia, schizoaffective disorder, and bipolar disorder, as well as healthy controls. Interestingly, as the depth of the model goes from one to two to three, the separation between the two groups increases. In addition, despite the more complex model, there continues to be overlap between some subjects, highlighting the complexity of categorizing these individuals who have disorders which share overlapping symptoms and for which we do not yet have an underlying cause. Such approaches can help us with potentially refining diagnostic criteria by characterizing the degree to which individuals are well separated using the biological data.56
Figure 8. Deep learning results from sMRI data from schizophrenia, schizoaffective, and bipolar patients as well as healthy controls. Each dot represents an individual subject. As the depth of the model increases, the separation between the groups increases, although there are still boundary cases, which may be useful to help refine the diagnostic categories.
Data fusion
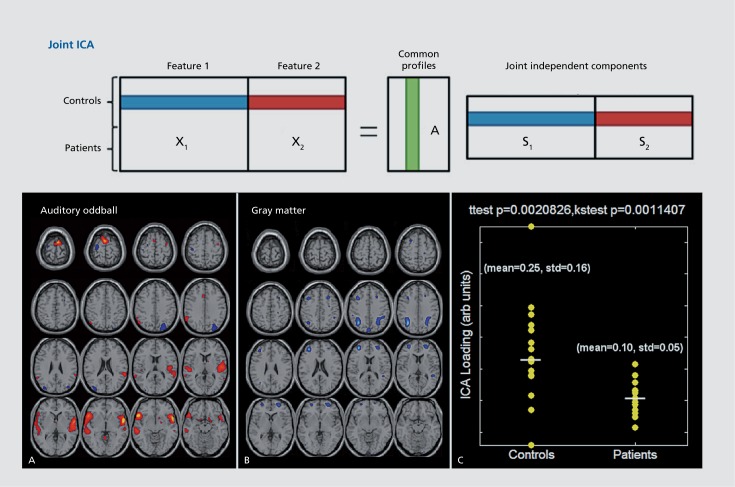
Importantly, one can also study the relationship between brain function and brain structure more directly, allowing the data from multiple modalities to interact with one another, called data fusion.15 An approach called joint ICA provides a way to do this, by jointly extracting from multiple modalities maximally independent components that share a common covariation among subjects. The joint components share a common loading parameter which quantifies the degree to which each subject expresses the joint component (Figure 9; top). An example of joint ICA analysis of brain connectivity during an auditory oddball task and gray matter concentration is shown in Figure 9 (bottom). In this case, the analysis included patients with schizophrenia and healthy controls and the loading parameter associated with one of the components showed a significant group difference. Interestingly, parietal regions showing reduced gray matter in controls were implicated as associated with increases in task activation. Importantly, the (apparent) gray matter reductions were due to decreases in the white matter,57 further emphasizing the importance of incorporating sMRI, dMRI, and fMRI together.
Figure 9. Joint ICA takes input features (eg, gray matter segmentation maps and fMRI activation maps) and estimates maximally independent components from both modalities which share common covariation among subjects. Example of linked regions associated with an auditory oddball task and gray matter concentration.57 ICA, independent component analysis.
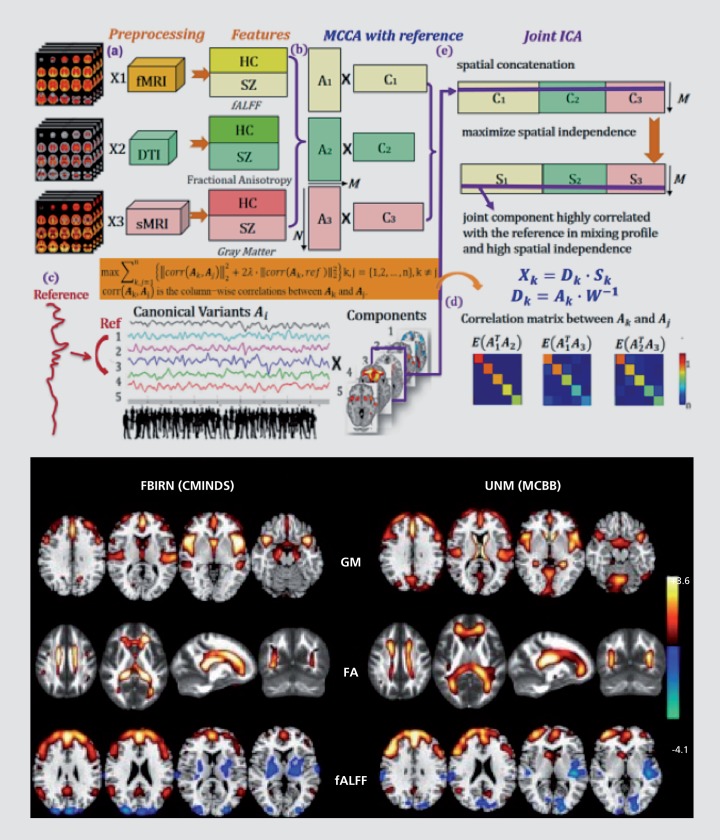
There are a few approaches capable of combining more than two modalities including linked ICA,58 independent vector analysis,59 PCA,30 parallel ICA, and an extension of joint ICA, called multiset canonical correlation analysis/joint ICA (mCCA+jICA).60,61 The mCCA+jICA model approach leverages the strength of mCCA, which identifies maximally correlated multimodal latent variables from the data, with joint ICA, which enables leveraging of the higher order statistical information in the data. These approaches provide a fully data-driven way to identify linked multimodal variables. An extension of this approach allows for the incorporation of prior knowledge to constrain the problem further by adding a reference function to the mCCA approach. This approach was used to identify multimodal patterns which are linked to a composite cognition score based on cognitive scores assessed with the MATRICS Consensus Cognitive Battery (MCCB).62 An extensive network of gray matter, white matter, and functional regions were identified and showed significant differences in schizophrenia patients versus healthy controls (Figure 10). The analysis and results replicated in a second cohort, underscoring the robustness of the resulting patterns. Interestingly, in addition to implicating specific structural and functional regions in the brain, one can also observe more similarity between individuals in the structural features and more variability in the functional features, reflective of the more state-like aspect of the fMRI measurement.
Figure 10. Advanced fusion approach (mCCAR+jICA) which allows one to identify multimodal features that are linked to an external variable (top). Example showing multimodal features (for both original analysis and replication) linked to cognition and also showing group differences in schizophrenia versus healthy controls. mCCAR, multiset canonical correlation analysis; jICA, joint independent component analysis.
Structural substrates for time-varying connectivity
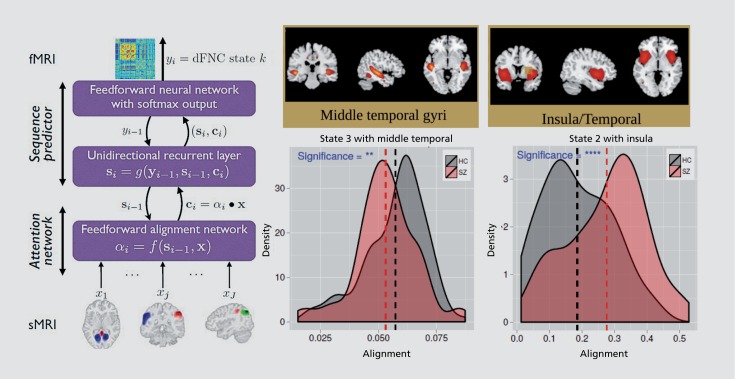
Another question of interest is to what degree, and in what ways, is the highly dynamic connectivity which has been observed in the past few years44,63 dependent on a structural substrate. This is especially important in the context of psychopathology, as there are known structural differences that have been observed.64-66 Further analyzing the same data set as summarized in Figure 5, we implemented a deep-learning model designed to capture nonlinear links between brain structure and dynamic state. For example, one can use a model that estimates both alignment between different sources of information (eg, the caption and figure in an image) and the sequential relationship between dynamic data (eg, translation of two text phrases).67 Using this model, we identified two covarying structural networks in temporal lobe, both showing significant differences in alignment between patients with schizophrenia and healthy controls. Interesting, the structural links parallel the amount of time each group spent in a given state. That is, state 3 was occupied more often by the healthy controls and also showed a stronger structure/function alignment with insula/temporal lobe, whereas state 2 was occupied more of the time by schizophrenia patients and showed a stronger structure/function alignment with medial temporal lobe. Such results highlight the highly synergistic relationship between brain structure and brain function and the need for more work in this area.
Conclusion
In conclusion, this paper discussed the synergistic relationship between brain structure and function, provided a selective review of data-driven approaches for capturing multivariate relationship both within and between brain structural and functional measure, and presented multiple analytic examples from prior studies. There are still only a small number of studies that directly evaluate the relationship between brain structure and brain function; without this information we will undoubtedly be ignoring important information that can inform us about the healthy brain and the ways in which it is impacted by psychopathology.
Figure 11. Nonlinear alignment of brain structure regions to dynamic connectivity patterns (left) reveal significant changes in the alignment of structure in the temporal lobe region in schizophrenia versus controls.67 .
Acknowledgments
This work was supported by National Institutes of Health grant numbers 2R01EB005846, R01REB020407 and P20GM103472 and National Science Foundation grants NSF grants 1539067/1631819 to V.D.C. The author declares that there were no other sources of financial support or compensation that could be perceived as constituting a potential conflict of interest.
REFERENCES
- 1.Kennedy DN., Lange N., Makris N., Bates J., Meyer J., Caviness VS, Jr. Gyri of the human neocortex: an MRI-based analysis of volume and variance. Cerebral Cortex. 1998;8(4):372–384. doi: 10.1093/cercor/8.4.372. [DOI] [PubMed] [Google Scholar]
- 2.Fischl B. FreeSurfer. Neuroimage. 2012;62(2):774–781. doi: 10.1016/j.neuroimage.2012.01.021. [DOI] [PMC free article] [PubMed] [Google Scholar]
- 3.Xu L., Groth K., Pearlson G., Schretlen D., Calhoun V. Source-based morphometry: the use of independent component analysis to identify gray matter differences with application to schizophrenia. Hum Brain Mapp. 2009;30(3):711–724. doi: 10.1002/hbm.20540. [DOI] [PMC free article] [PubMed] [Google Scholar]
- 4.Basser PJ., Pajevic S., Pierpaoli C., Duda J., Aldroubi A. In vivo fiber tractography using DT-MRI data. Magn Reson Med. 2000;44(4):625–632. doi: 10.1002/1522-2594(200010)44:4<625::aid-mrm17>3.0.co;2-o. [DOI] [PubMed] [Google Scholar]
- 5.Mori S., Kaufmann WE., Davatzikos C., et al. Imaging cortical association tracts in the human brain using diffusion-tensor-based axonal tracking. Magn Reson Med. 2002;47(2):215–223. doi: 10.1002/mrm.10074. [DOI] [PubMed] [Google Scholar]
- 6.Umezawa E., Yoshikawa M., Ohno K., Yoshikawa E., Yamaguchi K. Multi-shelled q-ball imaging: moment-based orientation distribution function. Magn Reson Med Sci. 2010;9(3):119–129. doi: 10.2463/mrms.9.119. [DOI] [PubMed] [Google Scholar]
- 7.Bandettini PA. Twenty years of functional MRI: the science and the stories. Neuroimage. 2012;62(2):575–588. doi: 10.1016/j.neuroimage.2012.04.026. [DOI] [PubMed] [Google Scholar]
- 8.Allen EA., Erhardt EB., Damaraju E., et al. A baseline for the multivariate comparison of resting-state networks. Front Syst Neurosci. 2011;5(2):2. doi: 10.3389/fnsys.2011.00002. [DOI] [PMC free article] [PubMed] [Google Scholar]
- 9.Draganski B., Gaser C., Busch V., Schuierer G., Bogdahn U., May A. Neuroplasticity: changes in grey matter induced by training. Nature. 2004;427(6972):311–312. doi: 10.1038/427311a. [DOI] [PubMed] [Google Scholar]
- 10.Amunts K., Schleicher A., Burgel U., Mohlberg H., Uylings HB., Zilles K. Broca's region revisited: cytoarchitecture and intersubject variability. J Comp Neurol. 1999;412(2):319–341. doi: 10.1002/(sici)1096-9861(19990920)412:2<319::aid-cne10>3.0.co;2-7. [DOI] [PubMed] [Google Scholar]
- 11.Passingham RE., Stephan KE., Kotter R. The anatomical basis of functional localization in the cortex. Nat Neurosci. 2002;3(8):606–616. doi: 10.1038/nrn893. [DOI] [PubMed] [Google Scholar]
- 12.Pearlson GD., Calhoun VD. Structural and functional magnetic resonance imaging in psychiatric disorders. Can J Psychiatry. 2007;52(3) doi: 10.1177/070674370705200304. [DOI] [PubMed] [Google Scholar]
- 13.Kubicki M., McCarley R., Westin CF., et al. A review of diffusion tensor imaging studies in schizophrenia. J Psychiatr Res. 2007;41(1-2):15–30. doi: 10.1016/j.jpsychires.2005.05.005. [DOI] [PMC free article] [PubMed] [Google Scholar]
- 14.Williamson P. Are anticorrelated networks in the brain relevant to schizophrenia? Schizophr Bull. 2007;33(4):994–1003. doi: 10.1093/schbul/sbm043. [DOI] [PMC free article] [PubMed] [Google Scholar]
- 15.Calhoun VD., Sui J. Multimodal fusion of brain imaging data: A key to finding the missing link(s) in complex mental illness. Biol Psychiatry Cogn Neurosci Neuroimaging. 2016;1(3):230–244. doi: 10.1016/j.bpsc.2015.12.005. [DOI] [PMC free article] [PubMed] [Google Scholar]
- 16.Jutten C., Herault J. Blind separation of sources, Part I: an adaptive algorithm based on meuromimetic architecture. Signal Proc. 1991;24:1–10. [Google Scholar]
- 17.Bell AJ., Sejnowski TJ. An information maximisation approach to blind separation and blind deconvolution. Neural Comput. 1995;7(6):1129–1159. doi: 10.1162/neco.1995.7.6.1129. [DOI] [PubMed] [Google Scholar]
- 18.Hyvarinen A., Oja E. A fast fixed-point algorithm for independent component analysis. Neural Comput. 1997;9(7):1483–1492. [Google Scholar]
- 19.Erhardt E., Allen E., Damaraju E., Calhoun VD. On network derivation, classification, and visualization: a response to Habeck and Moeller. Brain Connectivity. 2011;1(2):105–110. [PMC free article] [PubMed] [Google Scholar]
- 20.Greicius MD., Srivastava G., Reiss AL., Menon V. Default-mode network activity distinguishes Alzheimer's disease from healthy aging: evidence from functional MRI. Proc Natl Acad Sci U S A. 2004;101(13):4637–4642. doi: 10.1073/pnas.0308627101. [DOI] [PMC free article] [PubMed] [Google Scholar]
- 21.Uddin LQ., Mooshagian E., Zaidel E., et al. Residual functional connectivity in the split-brain revealed with resting-state functional MRI. Neuroreport. 2008;19(7):703–709. doi: 10.1097/WNR.0b013e3282fb8203. [DOI] [PMC free article] [PubMed] [Google Scholar]
- 22.Robinson S., Basso G., Soldati N., et al. A resting state network in the motor control circuit of the basal ganglia. BMC Neuroscience. 2009;10:137. doi: 10.1186/1471-2202-10-137. [DOI] [PMC free article] [PubMed] [Google Scholar]
- 23.Assaf M., Jagannathan K., Calhoun VD., et al. Abnormal functional connectivity of default mode sub-networks in autism spectrum disorder patients. Neuroimage. 2010;53(1):247–256. doi: 10.1016/j.neuroimage.2010.05.067. [DOI] [PMC free article] [PubMed] [Google Scholar]
- 24.Calhoun VD., Adali T. Multisubject independent component analysis of fMRI: a decade of intrinsic networks, default mode, and neurodiagnostic discovery. IEEE Rev Biomed Eng. 2012;5:60–73. doi: 10.1109/RBME.2012.2211076. [DOI] [PMC free article] [PubMed] [Google Scholar]
- 25.Anderson A., Cohen MS. Decreased small-world functional network connectivity and clustering across resting state networks in schizophrenia: an fMRI classification tutorial. Front Hum Neurosci. 2013;7:520. doi: 10.3389/fnhum.2013.00520. [DOI] [PMC free article] [PubMed] [Google Scholar]
- 26.Luo L., Xu L., Jung R., Pearlson GD., Adah T., Calhoun VD. Constrained source-based morphometry identifies structural networks associated with default mode network. Brain Connect. 2012;2(1):33–43. doi: 10.1089/brain.2011.0026. [DOI] [PMC free article] [PubMed] [Google Scholar]
- 27.Calhoun VD., Adali T., Stevens M., Kiehl KA., Pekar JJ. Semi-blind ICA of fMRI: A method for utilizing hypothesis-derived time courses in a spatial ICA analysis. NeuroImage. 2005;25(2):527–538. doi: 10.1016/j.neuroimage.2004.12.012. [DOI] [PubMed] [Google Scholar]
- 28.Liu Q., Liu J., Zheng YR., Liang H., Calhoun VD. Semiblind spatial ICA of fMRI using spatial constraints. Human Brain Mapp. 2010;31(7):1076–1088. doi: 10.1002/hbm.20919. [DOI] [PMC free article] [PubMed] [Google Scholar]
- 29.Calhoun VD., Eichele T., Pearlson G. Functional brain networks in schizophrenia: a review. Front Hum Neurosci. 2009;3:17. doi: 10.3389/neuro.09.017.2009. [DOI] [PMC free article] [PubMed] [Google Scholar]
- 30.Bansal R., Hao X., Peterson BS. Morphological covariance in anatomical MRI scans can identify discrete neural pathways in the brain and their disturbances in persons with neuropsychiatric disorders. Neuroimage. 2015;111:215–227. doi: 10.1016/j.neuroimage.2015.02.022. [DOI] [PubMed] [Google Scholar]
- 31.Cota N., Arias-Vasquez A., Liu J., et al. Canonicality of structural patterns using source-based morphometry. Paper presented at: Human Brain Mapping, 2016; Geneva, Switzerland. [Google Scholar]
- 32.Arbabshirani MR., Plis S., Sui J., Calhoun VD. Single subject prediction of brain disorders in neuroimaging: Promises and pitfalls. Neuroimage. 2017;145(PtB):137–165. doi: 10.1016/j.neuroimage.2016.02.079. [DOI] [PMC free article] [PubMed] [Google Scholar]
- 33.Craddock RC., James GA., Holtzheimer PE, 3rd., Hu XP., Mayberg HS. A whole brain fMRI atlas generated via spatially constrained spectral clustering. Hum Brain Mapp. 2012;33(8):1914–1928. doi: 10.1002/hbm.21333. [DOI] [PMC free article] [PubMed] [Google Scholar]
- 34.Liu J., Xu L., Caprihan A., Calhoun V. Extracting principle components for discriminant analysis of fMRI images. Paper presented at: Proc. ICASSP, 2008. doi: 10.1109/ICASSP.2008.4517643. [DOI] [PMC free article] [PubMed] [Google Scholar]
- 35.McKeown MJ., Makeig S., Brown GG., et al. Analysis of fMRI data by blind separation into independent spatial components. Human Brain Mapp. 1998;6:160–188. doi: 10.1002/(SICI)1097-0193(1998)6:3<160::AID-HBM5>3.0.CO;2-1. [DOI] [PMC free article] [PubMed] [Google Scholar]
- 36.Lowe MJ., Sakaie KE., Beall EB., et al. Modern methods for interrogating the human connectome. J Int Neuropsychol Soc. 2016;22(2):105–119. doi: 10.1017/S1355617716000060. [DOI] [PMC free article] [PubMed] [Google Scholar]
- 37.Calhoun VD., Potluru V., Phlypo R., et al. Independent component analysis for brain fMRI does indeed select for maximal independence. PLoS ONE. 2013;8(8) doi: 10.1371/journal.pone.0073309. [DOI] [PMC free article] [PubMed] [Google Scholar]
- 38.Ashburner J., Friston KJ. Voxel-based morphometry-the methods. Neuroimage. 2000;11(6 Pt 1):805–821. doi: 10.1006/nimg.2000.0582. [DOI] [PubMed] [Google Scholar]
- 39.Wu L., Calhoun VD., Jung RE., Caprihan A. Connectivity-based whole brain dual parcellation by group ICA reveals tract structures and decreased connectivity in schizophrenia. Hum Brain Mapp. 2015;36(11):4681–4701. doi: 10.1002/hbm.22945. [DOI] [PMC free article] [PubMed] [Google Scholar]
- 40.Sporns O., Tononi G., Kotter R. The human connectome: A structural description of the human brain. PLoS Comput Biol. 2005;1(4):245–251. doi: 10.1371/journal.pcbi.0010042. [DOI] [PMC free article] [PubMed] [Google Scholar]
- 41.Calhoun VD., Adali T., Pearlson GD., Pekar JJ. A method for making group inferences from functional MRI data using independent component analysis. Human Brain Mapp. 2001;14(3):140–151. doi: 10.1002/hbm.1048. [DOI] [PMC free article] [PubMed] [Google Scholar]
- 42.Erhardt EB., Rachakonda S., Bedrick EJ., Allen EA., Adali T., Calhoun VD. Comparison of multi-subject ICA methods for analysis of fMRI data. Hum Brain Mapp. 2011;32(12):2075–2095. doi: 10.1002/hbm.21170. [DOI] [PMC free article] [PubMed] [Google Scholar]
- 43.Damaraju E., Allen EA., Belger A., et al. Dynamic functional connectivity analysis reveals transient states of dysconnectivity in schizophrenia. Neuroimage Clin. 2014;5:298–308. doi: 10.1016/j.nicl.2014.07.003. [DOI] [PMC free article] [PubMed] [Google Scholar]
- 44.Preti MG., Bolton TA., Van De Ville D. The dynamic functional connectome: State-of-the-art and perspectives. Neuroimage. 2017;160:41–54. doi: 10.1016/j.neuroimage.2016.12.061. [DOI] [PubMed] [Google Scholar]
- 45.Calhoun VD., Miller R., Pearlson G., Adali T. The chronnectome: time-varying connectivity networks as the next frontier in fMRI data discovery. Neuron. 2014;84(2):262–274. doi: 10.1016/j.neuron.2014.10.015. [DOI] [PMC free article] [PubMed] [Google Scholar]
- 46.Keilholz S., Caballero-Gaudes C., Bandettini P., Deco G., Calhoun V. Time-resolved resting-state functional magnetic resonance imaging analysis: current status, challenges, and new directions. Brain Connect. 2017;7(8):465–481. doi: 10.1089/brain.2017.0543. [DOI] [PMC free article] [PubMed] [Google Scholar]
- 47.Abrol A., Damaraju E., Miller RL., et al. Replicability of time-varying connectivity patterns in large resting state fMRI samples. Neuroimage. 2017;163:160–176. doi: 10.1016/j.neuroimage.2017.09.020. [DOI] [PMC free article] [PubMed] [Google Scholar]
- 48.Rashid B., Arbabshirani MR., Damaraju E., et al. Classification of schizophrenia and bipolar patients using static and dynamic resting-state fMRI brain connectivity. Neuroimage. 2016;134:645–657. doi: 10.1016/j.neuroimage.2016.04.051. [DOI] [PMC free article] [PubMed] [Google Scholar]
- 49.Allen EA., Damaraju E., Eichele T., Wu L., Calhoun VD. EEG Signatures of dynamic functional network connectivity states. Brain Topogr. 2018;31(1):101–116. doi: 10.1007/s10548-017-0546-2. [DOI] [PMC free article] [PubMed] [Google Scholar]
- 50.Kaiser RH., Whitfield-Gabrieli S., Dillon DG., et al. Dynamic resting-state functional connectivity in major depression. Neuropsychopharmacology. 2016;41(7):1822–1830. doi: 10.1038/npp.2015.352. [DOI] [PMC free article] [PubMed] [Google Scholar]
- 51.Kucyi A. Just a thought: How mind-wandering is represented in dynamic brain connectivity. Neuroimage. 2017; pii: S1053-8119(17)30569-4. . doi: 10.1016/j.neuroimage.2017.07.001. [DOI] [PubMed] [Google Scholar]
- 52.Miller RL., Yaesoubi M., Turner JA., et al. Higher dimensional meta-state analysis reveals reduced resting fMRI connectivity dynamism in schizophrenia patients. PLoS One. 2016;11(3):1–24. doi: 10.1371/journal.pone.0149849. [DOI] [PMC free article] [PubMed] [Google Scholar]
- 53.Segall JM., Allen EA., Jung RE., et al. Correspondence between structure and function in the human brain at rest. Front Neuroinform. 2012;6(10):10. doi: 10.3389/fninf.2012.00010. [DOI] [PMC free article] [PubMed] [Google Scholar]
- 54.Plis SM., Hjelm DR., Salakhutdinov R., et al. Deep learning for neuroimaging: a validation study. Front Neurosci. 2014;8:229. doi: 10.3389/fnins.2014.00229. [DOI] [PMC free article] [PubMed] [Google Scholar]
- 55.Hjelm RD., Calhoun VD., Salakhutdinov R., Allen EA., Adali T., Plis SM. Restricted Boltzmann machines for neuroimaging: an application in identifying intrinsic networks. Neuroimage. 2014;96:245–260. doi: 10.1016/j.neuroimage.2014.03.048. [DOI] [PMC free article] [PubMed] [Google Scholar]
- 56.Clementz BA., Sweeney JA., Hamm JP., et al. Identification of distinct psychosis biotypes using brain-based biomarkers. Am J Psychiatry. 2016;173(4):373–384. doi: 10.1176/appi.ajp.2015.14091200. [DOI] [PMC free article] [PubMed] [Google Scholar]
- 57.Calhoun VD., Adali T., Giuliani N., Pekar JJ., Pearlson GD., Kiehl KA. A method for multimodal analysis of independent source differences in schizophrenia: combining gray matter structural and auditory oddball functional data. Hum Brain Map. 2006;27(1):47–62. doi: 10.1002/hbm.20166. [DOI] [PMC free article] [PubMed] [Google Scholar]
- 58.Groves AR., Beckmann CF., Smith SM., Woolrich MW. Linked independent component analysis for multimodal data fusion. Neuroimage. 2011;54(3):2198–2217. doi: 10.1016/j.neuroimage.2010.09.073. [DOI] [PubMed] [Google Scholar]
- 59.Adali T., Levin-Schwartz Y., Calhoun VD. Multi-modal data fusion using source separation: Two effective models based on ICA and IVA and their properties. Proc IEEE Inst Electr Electron Eng. 2015;103(3):1478–1493. doi: 10.1109/JPROC.2015.2461624. [DOI] [PMC free article] [PubMed] [Google Scholar]
- 60.Sui J., He H., Pearlson GD., et al. Three-way (N-way) fusion of brain imaging data based on mCCA+jICA and its application to discriminating schizophrenia. Neuroimage. 2013;66(1):119–132. doi: 10.1016/j.neuroimage.2012.10.051. [DOI] [PMC free article] [PubMed] [Google Scholar]
- 61.Sui J., He H., Yu Q., et al. Combination of resting state fMRI, DTI, and sMRI data to discriminate schizophrenia by N-way MCCA + jICA. Front Hum Neurosci. 2013;7(235):1–14. doi: 10.3389/fnhum.2013.00235. [DOI] [PMC free article] [PubMed] [Google Scholar]
- 62.Qi S., Calhoun VD., van Erp TGM., et al. Multimodal fusion with reference: searching for joint neuromarkers of working memory deficits in schizophrenia. IEEE Trans Med Imaging. 2018;37(1):93–105. doi: 10.1109/TMI.2017.2725306. [DOI] [PMC free article] [PubMed] [Google Scholar]
- 63.Hutchison RM., Womelsdorf T., Allen EA., et al. Dynamic functional connectivity: promises, issues, and interpretations. Neuroimage. 2013;80:360–378. doi: 10.1016/j.neuroimage.2013.05.079. [DOI] [PMC free article] [PubMed] [Google Scholar]
- 64.Akbarian S., Vinuela A., Kim JJ., Potkin SG., Bunney WE, Jr., Jones EG. Distorted distribution of nicotinamide-adenine dinucleotide phosphate-diaphorase neurons in temporal lobe of schizophrenics implies anomalous cortical development. Arch Gen Psychiatry. 1993;50(3):178–187. doi: 10.1001/archpsyc.1993.01820150016002. [DOI] [PubMed] [Google Scholar]
- 65.Pearlson GD. Neurobiology of schizophrenia. Ann Neurol. 2000;48(4):556–566. [PubMed] [Google Scholar]
- 66.Andreasen NC., Nopoulos P., O'Leary DS., Miller DD., Wassink T., Flaum M. Defining the phenotype of schizophrenia: cognitive dysmetria and its neural mechanisms. Biol Psychiatry. 1999;46(7):908–920. doi: 10.1016/s0006-3223(99)00152-3. [DOI] [PubMed] [Google Scholar]
- 67.Amin F., Plis S., Damaraju E., Hjelm D., Cho K., Calhoun VD. A deep-learning approach to translate between brain structure and brain function. Paper presented at: Pattern Recognition in Neuroimaging (PRNI), 2015; Palo Alto, CA. [Google Scholar]


