Abstract
Purpose
How fluid moves during the cardiac cycle within a syrinx may affect its development. We measured syrinx fluid velocities before and after craniovertebral decompression in a patient and simulated syrinx fluid velocities for different heart rates, syrinx sizes and cerebrospinal fluid (CSF) flow velocities in a model of syringomyelia.
Materials and methods
With phase-contrast magnetic resonance we measured CSF and syrinx fluid velocities in a Chiari patient before and after craniovertebral decompression. With an idealized two-dimensional model of the subarachnoid space (SAS), cord and syrinx, we simulated fluid movement in the SAS and syrinx with the Navier-Stokes equations for different heart rates, inlet velocities and syrinx diameters.
Results
In the patient, fluid oscillated in the syrinx at 200 to 210 cycles per minute before and after craniovertebral decompression. Velocities peaked at 3.6 and 2.0 cm per second respectively in the SAS and the syrinx before surgery and at 2.7 and 1.5 cm per second after surgery. In the model, syrinx velocity varied between 0.91 and 12.70 cm per second. Increasing CSF inlet velocities from 1.56 to 4.69 cm per second increased peak syrinx fluid velocities in the syrinx by 151% to 299% for the three cycle rates. Increasing cycle rates from 60 to 120 cpm increased peak syrinx velocities by 160% to 312% for the three inlet velocities. Peak velocities changed inconsistently with syrinx size.
Conclusions
CSF velocity, heart rate and syrinx diameter affect syrinx fluid velocities, but not the frequency of syrinx fluid oscillation. Craniovertebral decompression decreases both CSF and syrinx fluid velocities.
Keywords: Cerebrospinal fluid, Chiari I, computational fluid dynamics, syringomyelia
Introduction
Fluid within syringomyelia cavities moves during the cardiac cycle. Dynamic magnetic resonance imaging (MRI) in a patient with Chiari I and syringomyelia showed cranial and caudal fluid jets in syrinx fluid related to the cardiac cycle.1 Phase-contrast MR (PC MR) in patients with Chiari I and syringomyelia have shown a spatially and temporally complex pattern of fluid movement in the syrinx.2 Craniovertebral decompression altered flow in a Chiari I patient both in the subarachnoid space (SAS) and in the syrinx, and decreased syrinx velocities by an order of magnitude.3 In vitro flow experiments in physical models of syringomyelia have revealed pulsatile pressure and flow within the syrinx during cardiac cycles.4 Computational studies have demonstrated syrinx fluid motion close to 1 cm per second initiated by pulse waves traveling along the spinal cord related to coughing, a velocity too small to generate sufficient force to lengthen a syrinx.5 It was suggested that greater syrinx velocities may cause tearing of spinal cord tissue. The movement of syrinx fluid vis-a-vis cerebrospinal fluid (CSF) movement in the SAS has yet to be thoroughly evaluated.
The goal of this study was to determine the range of syrinx fluid velocities for a set of physiological conditions. We obtained MR flow images of the CSF and syrinx fluid in a patient with syringomyelia and compared SAS and syrinx fluid dynamics before and after craniovertebral decompression. We simulated syrinx fluid movement in a computational model to study syrinx and CSF velocities. In the model, we measured the effects of CSF velocity waveform, CSF velocity, heart rate and syrinx size on the movement of syrinx fluid.
Methods
In vivo fluid velocity measurements
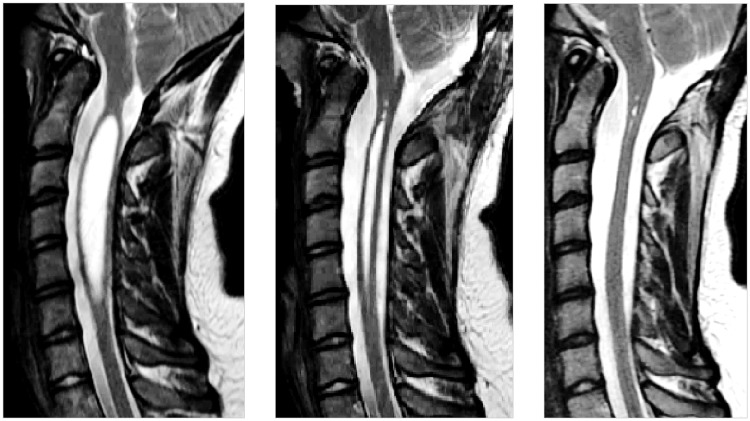
This study was performed with the approval of the local institutional review board, which granted a waiver of consent for the retrospective use of imaging data acquired as part of the clinical evaluations for diagnosis of Chiari I malformation. The serial anatomical MR and PC-flow imaging data of a 14-year-old female with a Chiari I malformation and syringomyelia obtained between 2013 and 2014 were selected for retrospective review, which included time-points before and after craniovertebral decompression; serial imaging had demonstrated resolution of the patient’s symptoms and syringomyelia following postsurgical decompression (Figure 1).
Figure 1.
T2-weighted sagittal magnetic resonance images prior to (left) and at two months (middle) and 10 months (right) after craniovertebral decompression. Preoperatively, a syrinx 7 mm in diameter expands the cervical spinal cord from C1 to C6. The syrinx resolved partially by two months and completely by 10 months.
Imaging was performed on a 3 Tesla wide-bore MRI scanner (Discovery 750w; General Electric Healthcare, Waukesha, WI, USA) with an eight-channel head coil. Per guidelines of the University of Wisconsin School of Medicine and Public Health for spinal CSF-flow imaging, peripherally gated multilevel axial two-dimensional (2D) PC imaging was performed perpendicular to the long axis of the cervical spinal canal at the C1–C2, C2, C2–C3, C3, C3–C4, and C4–C5 spinal levels (flip angle (FA) = 20 degrees; repetition time (TR) = 6.74 ms; echo time (TE) = 3.8 ms; slice thickness = 5 mm; field of view (FOV) = 180 mm; matrix = 256 × 256; velocity encoding gradient = 20 cm per second; 14 cardiac phases; 10% arrhythmia rejection rate). Other standard anatomical imaging of the cervical spine includes sagittal and axial T1 fluid-attenuated inversion recovery (T1 FLAIR) weighted spin echo imaging (FA = 142 degrees; TR = 2432.1 ms; TE = 24.9 ms; TI = 920 ms; echo train length = 4; slice thickness = 4 mm; FOV = 220 mm; matrix = 512 × 512; number of excitations (NEX) = 1), sagittal T2-weighted fast spin echo imaging (flip angle = 142 degrees; TR = 3600 ms; TE = 109.9 ms; TI = 920 ms; echo train length = 24; slice thickness = 4 mm; FOV = 220 mm; matrix = 512 × 512; NEX = 2), and axial T2* multiple echo recombined gradient echo (flip angle = 25 degrees; TR = 1000 ms; TE = 12.2 ms; TI = 920 ms; echo train length = 4; slice thickness = 4 mm; FOV = 200 mm; matrix = 512 × 512; NEX = 2).
Multilevel axial PC-flow data were calculated with the CV Flow Analysis software package (General Electric Healthcare; Waukesha, WI, USA). At each cervical spinal level, axial CSF flow velocities were sampled with elliptical regions of interest (ROIs) drawn in 12 clock face sectors that subdivided the SAS around the cervical cord, with the 12 o’clock location being the anterior side. This segmentation was performed to account for topographic variations in CSF flow around the cord, to avoid including structures traversing the CSF space that might interfere with accurate measure of peak velocities (e.g. nerve rootlets, blood vessels, cord margins), and to avoid low-flow boundary phenomena around the margins of the SAS and cord. An additional ROI was also drawn within the center of the syrinx; for the syrinx flow measurements, the hand-drawn ROI covered the main part of the syrinx cavity and excluded the low-flow boundary regions of the syrinx. Velocities within each ROI were then extracted and normalized to their respective sampling areas, prior to being plotted over the cardiac cycle. To compare the MR results to the 2D model, we focused on one ROI at each horizontal level of the cervical spine, all at the 1 o’clock location in the cross-section of the SAS, and computed the weighted average of the velocity in these ROIs.
Flow simulations
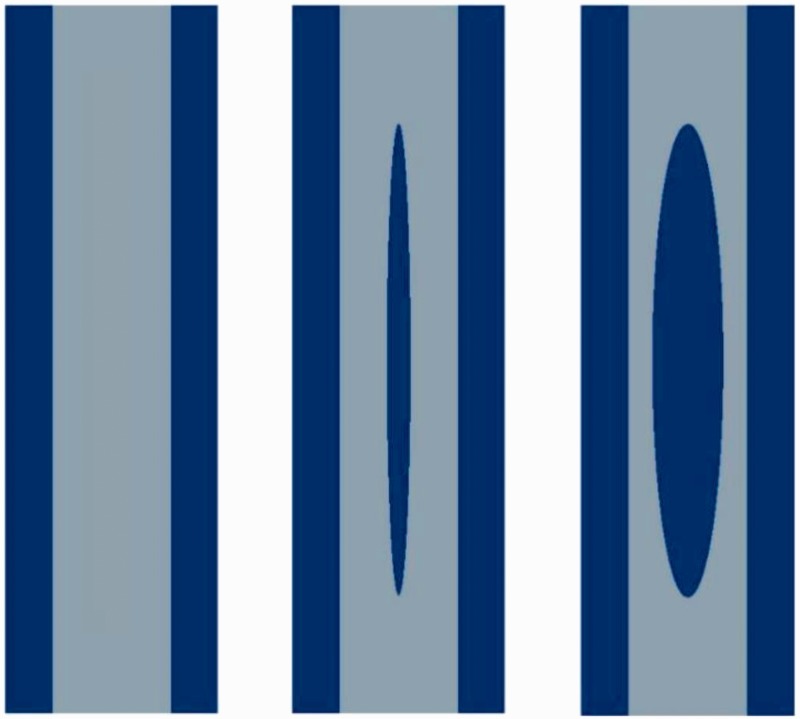
For flow simulations, we used a 2D computational model of the SAS, 6 cm in length and 1.8 cm in width (Figure 2), permitting flow measurements with greater spatial resolution (submillimeter all directions) and temporal resolution (millisecond) than in the PC MR images. Fluid in the model was assigned the properties of water at 37℃. Centrally in the spinal cord in the model we inserted a rectangle 6 cm in length and 1 cm in width to represent the spinal cord and assigned it linearly elastic properties of the spinal cord (Young’s modulus of 16 kPa6 and Poisson’s ratio of 0.479.7 We created two modifications of the model, one with an elliptical central water-filled space 4 cm in length and 2 mm in peak diameter and another with an elliptical space 4 cm in length and 6 mm in peak diameter.
Figure 2.
Sketches showing the model with no syrinx (left) and the two modifications of the model with a 2 mm (middle) or 6 mm (right) elliptical fluid-filled space (syrinx). Blue areas represent fluid; gray areas represent spinal cord tissue.
At the outer boundaries of the CSF and syrinx fluid spaces, we applied no slip conditions. At the interfaces between the fluid and the tissue, we assumed continuity of stresses and velocities. The top and bottom of the cord were assumed to be fixed. We applied flow at one end of the SAS, designated the cranial end, by specifying a flow condition varying in time, while a zero-pressure condition was applied to the outlet (caudal end). Flow in the caudal direction was assigned a positive sign and in the cranial direction a negative sign.
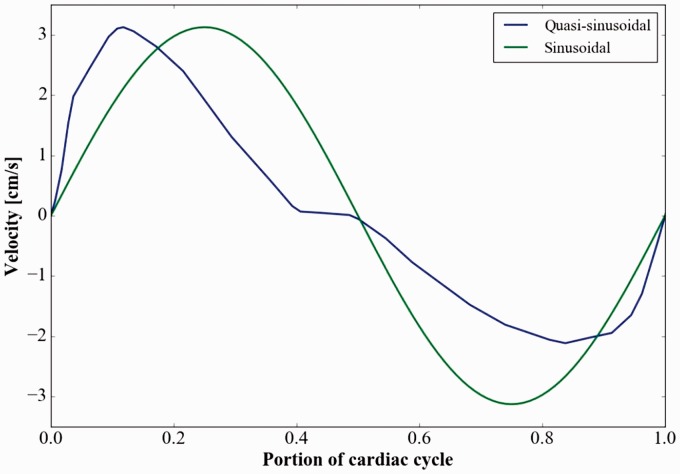
The different flow conditions applied at the cranial end included two waveforms, three flow velocities and three cycle rates, tested on all three models. The two waveforms were sinusoid and quasi-sinusoid. The quasi-sinusoidal wave was the spatial average of the flow measurement acquired at the foramen magnum with PC MR in the Chiari patient (Figure 3), adjusted to have zero net flow over one cycle. This waveform displayed a period of 0.87 seconds, with 0.37 seconds of caudally directed flow and 0.50 seconds of cranially directed flow. Peak velocity was 3.13 cm per second in the caudal direction and 2.14 cm per second in the cranial direction. The sinusoidal waveform had a period of one second and an amplitude of 3.13 cm per second. To compare results from the two different waveforms, the period of the quasi-sinusoidal waveform was adjusted (by standard stretching) to one second. Moreover, to test the effect of cycle rates, we used the quasi-sinusoidal waveform. Three cycle rates were created by changing the period length of the inlet velocity wave to 60, 90 and 120 cycles per minute (cpm). Finally, for the different flow velocities, the peak caudal velocity at the inlet was set to 1.56, 3.13 and 4.69 cm per second.
Figure 3.
The quasi-sinusoidal inlet velocity waveform acquired by phase-contrast magnetic resonance (solid line) and the sinusoidal waveform (dotted line) used in the models. The quasi-sinusoidal waveform has caudal (positive) flow of short duration (40% of the cycle) corresponding to systole and cranial (negative) flow of longer duration (approximately 60% of the cycle) corresponding to diastole.
The Navier-Stokes equations for an incompressible Newtonian fluid were used to simulate fluid flow in the SAS and in the syrinx for each of the conditions. The equations (Navier-Stokes and the dynamic linear elasticity equation) were solved simultaneously in a moving domain using the FEniCS8 finite element software with methods previously described.9 Simulations were performed over eight seconds to reach an oscillatory steady-state solution. Peak caudal and cranial velocities from the final cycle were tabulated for each model and boundary condition.
CSF and syrinx fluid velocities through the cardiac cycle were displayed in color-coded images. Peak velocities were plotted over time in Paraview for the three models and the different boundary conditions. The velocity in the middle of the syrinx through a cycle was inspected to determine the frequency of the fluid oscillations within the syrinx.
Results
In vivo fluid velocity measurements
Sagittal images obtained prior to surgery in the patient showed a syrinx 7 mm in diameter that diminished in size at two months and disappeared at 10 months after craniovertebral decompression (Figure 1). The length of the syrinx did not change from the preoperative state to two months after surgery. In the preoperative study, peak weighted mean velocity (magnitude) was 3.6 cm per second in the SAS (caudal direction) and 2.0 cm second in the syrinx (cranial direction) (Figure 4). The heart rate was 73 beats per minute (bpm), and the fluid in the syrinx displayed close to three full oscillations per cardiac cycle, a cycle rate of approximately 210 cpm. Preoperatively, CSF flow in the SAS was synchronously bidirectional at some cardiac phases.
Figure 4.
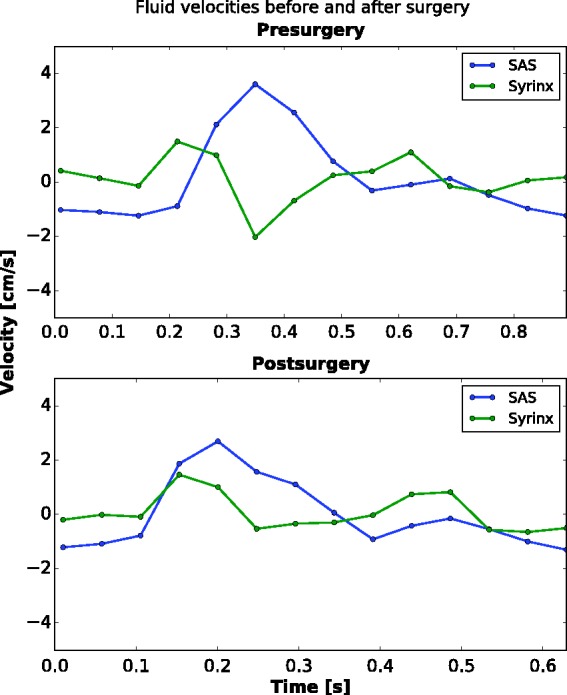
Plot of cerebrospinal fluid (CSF) and syrinx fluid velocities over one cardiac cycle before and after surgery. Subarachnoid space (SAS) velocities are averaged along the cervical cord at the 1 o’clock location in the SAS. Preoperatively, the SAS has a peak of 3.6 cm per second in the caudal direction, and fluid in the syrinx has a peak velocity of 2.0 cm per second in the cranial direction. The CSF flow has a unimodal pattern, with one peak in the positive direction and one of smaller magnitude and greater duration in the negative direction. Flow in the syrinx fluid has a multimodal pattern with three peaks in each direction. Peak caudal flow in the CSF coincides with peak cranial flow in the syrinx. The heart rate was recorded as 73 beats per minute (bpm). Postoperatively, CSF flow had a peak of 2.7 cm per second in the caudal direction, a 29% reduction from the preoperative study. The fluid in the syrinx had a peak of 1.5 cm per second, also in the caudal direction, a 25% decrease from the preoperative study. The pulse was recorded at 97 bpm. Peak CSF velocity in the same locations in the SAS at 10 months after surgery remained stable at 2.4 cm per second in the caudal direction (no plot shown).
At two months postsurgery, peak weighted average velocities in the SAS were reduced to 2.7 cm per second (caudal direction) and in the syrinx to 1.5 cm per second (caudal direction) (Figure 4). The relative decrease in flow was 29% in the SAS and 25% in the syrinx. In general, fluid velocities throughout the SAS and syrinx were reduced postsurgery. The heart rate during the image acquisition postsurgery was 97 bpm, and the fluid in the syrinx postoperatively had close to two full oscillations per cardiac cycle, a cycle rate of approximately 200 cpm.
At the 10-month postoperative time point, the syrinx had essentially resolved. CSF flow throughout the cervical SAS remained in the range of the velocities measured at two months postoperation.
Flow simulations
Fluid velocities in the syrinx varied with location in the fluid space, time in the cycle, syrinx diameter, CSF inlet velocity, inlet waveform and cycle rate (Table 1).
Table 1.
Peak syrinx fluid and cerebrospinal fluid velocities in the subarachnoid space (SAS) as a function of inlet velocity amplitude, cycle rate and syrinx size for the quasi-sinusoidal inlet profile.
| Inlet velocity 1.56 cm/sec |
Inlet velocity 3.13 cm/sec |
Inlet velocity 4.69 cm/sec |
|||||
|---|---|---|---|---|---|---|---|
| Cycle rate (cpm) | Syrinx diameter (mm) | SAS velocity (cm/sec) | Syrinx velocity (cm/sec) | SAS velocity (cm/sec) | Syrinx velocity (cm/sec) | SAS velocity (cm/sec) | Syrinx velocity (cm/sec) |
| 60 | No syrinx | 1.79 | NA | 3.57 | NA | 5.36 | NA |
| 2 | 2.06 | 1.41 | 4.10 | 2.82 | 6.16 | 4.21 | |
| 6 | 2.43 | 1.03 | 4.86 | 1.87 | 7.31 | 3.08 | |
| 90 | No syrinx | 1.85 | NA | 3.23 | NA | 5.55 | NA |
| 2 | 1.87 | 1.47 | 3.73 | 2.85 | 5.62 | 4.42 | |
| 6 | 2.25 | 0.91 | 4.49 | 1.71 | 6.65 | 2.65 | |
| 120 | No syrinx | 1.82 | NA | 3.64 | NA | 5.46 | NA |
| 2 | 2.19 | 4.35 | 4.25 | 7.87 | 5.57 | 10.94 | |
| 6 | 3.06 | 3.18 | 7.92 | 7.70 | 13.09 | 12.70 | |
cpm: cycles per minute; NA: not available; SAS: subarachnoid space.
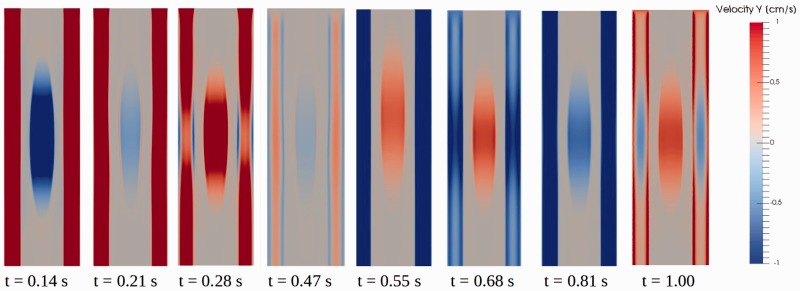
Spatially, velocities varied with distance from the edges of the fluid spaces. Velocities were greater in the central zones in the syrinx and SAS than at the borders. A detailed illustration of flow patterns of CSF and syrinx fluid throughout the cardiac cycle is given in Figure 5. In this figure, the quasi-sinusoidal inlet waveform at 60 cpm with 3.13 cm per second inlet velocity amplitude was used in the model with the larger syrinx.
Figure 5.
Flow images showing spatial variation from eight time points in the cardiac cycle in the 6 mm syrinx model, at 60 cycles per minute cycle rate, 3.13 cm per second inlet velocity and quasi-sinusoidal velocity waveform. The first three images show cerebrospinal fluid (CSF) flow primarily in the caudal direction and change from cranial to caudal flow in the syrinx. The fourth image shows relatively stagnant flow with bidirectionality both in the CSF and the syrinx. The next three show CSF flow in the cranial direction. The final image shows relatively stagnant flow again. The first image (t = 0.14 seconds) shows CSF and syrinx peak velocities in the caudal and cranial direction, respectively. At t = 0.21 seconds bidirectional flow is seen in the syrinx as fluid close to the syrinx walls reverses direction earlier than fluid in central regions. Between t = 0.28 seconds and t = 0.47 seconds, CSF flow is close to stagnant, and has some changes in directionality near the wall, and flow in the syrinx is caudal (t = 0.28 seconds), cranial (not shown) and caudal again (t = 0.47 seconds). In the next three phases, (t = 0.55 seconds, t = 0.68 seconds, t = 0.81 seconds), CSF is flowing in the cranial direction, while syrinx fluid oscillates back and forth at a rate of approximately 240 cycles per minute. At the final stage of the cycle (t = 1.00), CSF flow has started to flow in the caudal direction. Longitudinal variation of flow in the subarachnoid space is associated with movements of spinal cord tissue, especially adjacent to the syrinx.
The effect of inlet waveform
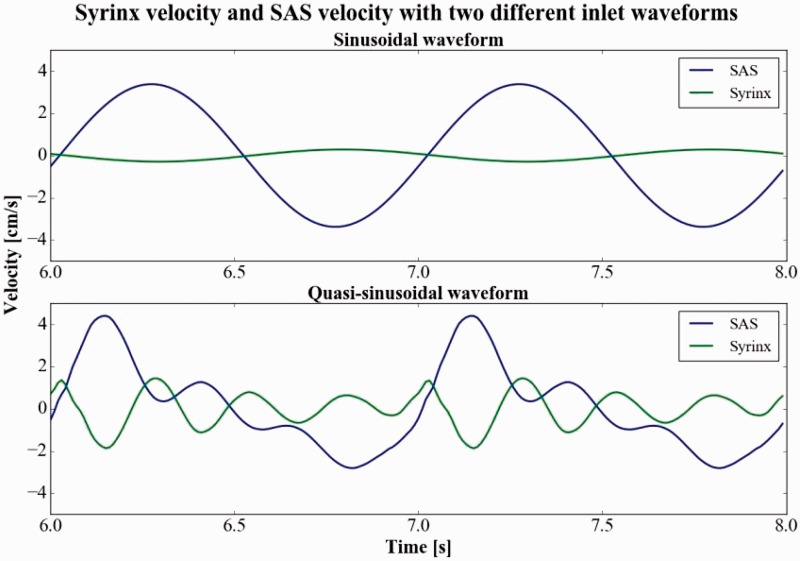
With the sinusoidal waveform at 60 cpm and inlet velocity amplitude of 3.13 cm per second, syrinx fluid moved concurrently in the syrinx and SAS, but in opposite directions and with different magnitudes, reaching a peak of 0.29 cm per second in the middle of the 6 mm diameter syrinx compared to 3.4 cm per second in the central SAS (Figure 6). Moreover, with the sinusoidal waveform, the oscillation rate within the syrinx equaled the cycle rate in the SAS (as in Figure 6) for all inlet velocities and all cycle rates.
Figure 6.
Plot of velocities centrally in the subarachnoid space (SAS) and the syrinx over two cycles (from six seconds to eight seconds in the simulation) for the sinusoidal inlet waveform (upper plot) and quasi-sinusoidal velocity waveform that was measured in a Chiari I patient (lower plot). The flow conditions for these plots were: inlet velocity 3.13 cm per second cycle rate 60 cycles per minute and 6 mm diameter syrinx (the same parameter setting as Figure 5). For the sinusoidal flow condition, fluid movement is unimodal both in the SAS and the cyst. For the quasi-sinusoidal velocity waveform, cerebrospinal fluid flow is unimodal and syrinx fluid flow is multimodal (four oscillations). Peak syrinx fluid velocities are greater in the cranial direction than in the caudal direction for quasi-sinusoidal inlet flow. The pattern corresponds well to in vivo measurements that show during systole (caudal SAS flow) flow in the syrinx is cranial. Later in the cycle, syrinx velocities diminish.
Changing the inlet velocity waveform from sinusoidal to quasi-sinusoidal (the waveform obtained in the Chiari I patient) increased the frequency and amplitude of the syrinx fluid oscillations (Figure 6). Peak syrinx fluid velocity occurred in the cranial direction, simultaneously with peak SAS velocity in the caudal direction. When the inlet velocity was quasi-sinusoidal, fluid in the syrinx had two, three or four oscillations per cycle in the SAS (Figure 6). The fluid in the syrinx oscillated with a frequency of about 240 cpm, independent of the cycle rate in the SAS. For example, when the cycle rate in the SAS was increased from 60 to 120 cpm, the number of oscillations in the syrinx per cycle in the SAS decreased from four to two. Syrinx fluid velocities were greater when the inlet velocity was quasi-sinusoidal than when it was sinusoidal. Peak SAS and syrinx velocity for varying inlet velocities, syrinx diameters and cycle rates are reported in Table 1 for the quasi-sinusoidal waveform.
The effect of velocity at the inlet
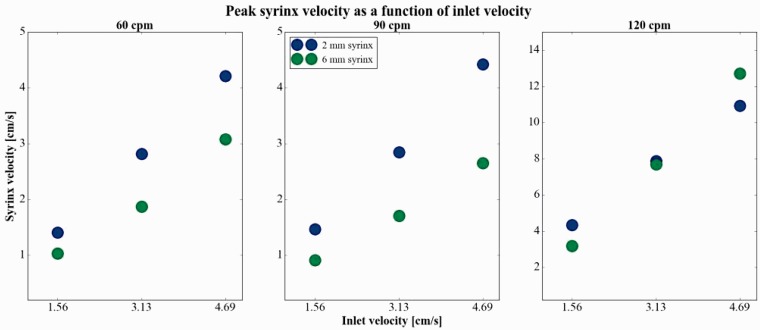
Peak syrinx velocity increased with increases in inlet velocity (from 1.56 to 3.13 and 4.69 cm per second) at all three cycle rates in both syringes (Table 1, Figure 7). The change in syrinx fluid velocity appeared linear with change in inlet velocity for each of the three cycle rates (Figure 7), thus an increase in inlet velocity led to the same relative increase in syrinx velocity (i.e. a 50% increase in inlet velocity led to a 50% increase in syrinx velocity). Increasing CSF inlet velocities from 1.56 to 4.69 cm per second increased peak cyst fluid velocities for the three cycle rates in the 2 mm syrinx by 151% to 200% and in the 6 mm syrinx by 191% to 299%. A change in inlet velocity did not change the frequency of oscillations within the syrinx. SAS peak fluid velocities were greater in the caudal direction and peak syrinx fluid velocities greater in the cranial direction.
Figure 7.
Peak syrinx velocity as a function of inlet velocity, at 60 (left), 90 (middle) and 120 (right) cycles per minute (cpm). Syrinx and cerebrospinal fluid velocities appear to increase linearly with inlet velocity for all cycle rates.
The effect of cycle rate
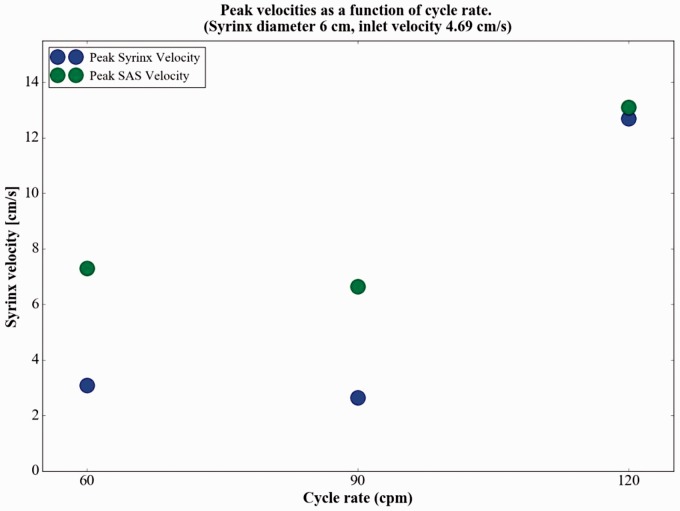
The effect of cycle rate on peak syrinx velocities was nonlinear. Syrinx velocities changed little with an increase of cycle rate from 60 to 90 cpm and increased by more than 100% with a further increase of cycle rate to 120 cpm (Figure 8). For example, with an inlet velocity of 4.69 cm per second, the peak syrinx velocity in the 6 mm syrinx decreased from 3.08 cm per second to 2.65 cm per second with an increase in cycle rate from 60 to 90 cpm. When the cycle rate was increased to 120 cpm, peak syrinx velocity increased to 12.70 cm per second. For the 2 mm syrinx an increase in cycle rate from 60 to 120 cpm increased peak syrinx velocities by 160% to 209% for the three cycle rates. Similarly, peak velocities in the 6 mm syrinx increased by 209% to 312% by an increase from 60 to 120 cpm (Table 1).
Figure 8.
Peak syrinx fluid velocity as a function of cycle rate for the 4.69 cm per second inlet velocity. Velocity diminished by less than 10% between 60 and 90 cycles per minute and increased by more than 100% between 90 and 120 cycles per minute. At the 1.56 and 3.13 cm per second inlet velocities, the same relative effect of cycle rate was noted (data not shown).
Effect of syrinx diameter
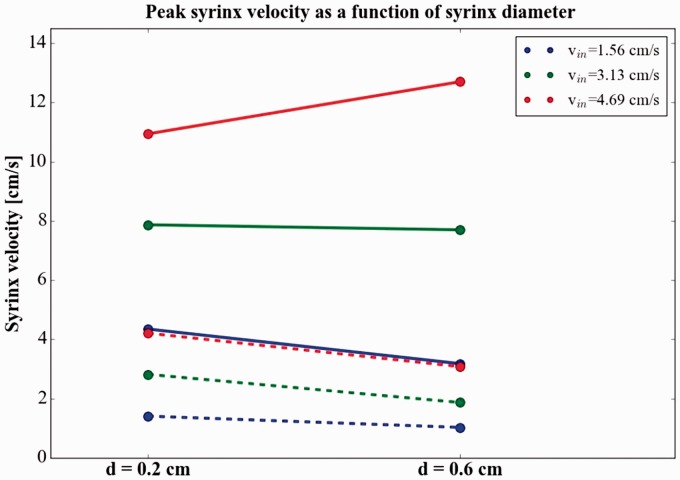
Syrinx diameter had little effect on observed peak syrinx velocities compared to the other parameters investigated. Peak syrinx velocities over the three cycle rates and three inlet velocities averaged 4.5 cm per second for the 2 mm syrinx and 3.9 cm/sec for the 6 mm syrinx (Table 1). Peak syrinx velocity decreased with increased syrinx size in eight of the nine test conditions (Figure 9, Table 1).
Figure 9.
Peak syrinx fluid velocity as a function of syrinx size at 60 (dashed lines) and 120 (solid lines) cycles per minute with three different inlet velocities. The figure shows syrinx had lower velocities in five of six instances. In eight of the nine test cases in total, syrinx velocities decreased with increased syrinx size, and the average peak velocity decreased from 4.5 cm per second in the smaller syrinx to 3.9 cm per second in the larger.
Discussion
Fluid in a spinal cord syrinx observed with PC MR or in a computational model displayed faster oscillations and sometimes greater velocities than in the CSF. In the patient, CSF and syrinx velocity decreased after craniovertebral decompression surgery. Similarly, in the model, changes in CSF velocities led to proportional changes in syrinx fluid velocities. Increasing cycle rates from 60 to 90 cpm had little effect on syrinx fluid velocities while increasing from 90 to 120 cpm increased syrinx velocities markedly. Fluid velocities tended to be slower in the larger syrinx. Peak syrinx fluid velocities, contrary to those in the SAS, tend to be greater in the cranial than in the caudal direction.
Our finding of oscillatory flow in syrinx cavities is consistent with in vivo observations of syrinx fluid flow reported previously. Honey et al.,1 using dynamic MRI, observed oscillatory flow of fluid in a syrinx, but reported no velocity measurements. Similar to our findings, Lichtor et al.3 found syrinx fluid velocity of comparable magnitude to flow in the SAS before surgery, but saw a greater decrease in syrinx velocity after surgery. In contrast to these two studies, we found peak syrinx fluid velocity to occur in the cranial direction before surgery. The syringes studied in these two reports differed from those in our patient in location and size (both width and length) of the syrinx, which may explain some of this difference. Incoherent movement of syrinx fluid has been documented previously,2 and variable syrinx fluid velocities have been observed depending on syrinx length.10 We are not aware of additional experimental studies documenting fluid velocities in the syrinx and SAS simultaneously. In a computational model, Bertram has previously showed that pressure waves related to coughing can initiate rapid fluid movement up to 1 cm per second in the syrinx cavity.5 In contrast, cord movement in our model was initiated by movement of CSF during the cardiac cycle, which under some conditions caused syrinx velocity to exceed the value found by Bertram.5
Our model has limitations. It lacks the variations in cross-sectional area and longitudinal axis of the SAS, which characterize the human cervical SAS. Therefore the model lacks the acceleration of fluid velocities in the SAS that occurs in the upper cervical spine.11 Modeling flow was limited to 2D because of the excessive computational times required for three-dimensional simulations. We did not change the velocity waveform with increases in cycle rate but retained the same proportion of systolic and diastolic flow phases, since the changes in waveform with increasing heart rate are not known. We assumed that stroke volume decreased proportionally with increasing heart rate, although not all investigators make this assumption.12 Our assumption is reasonable if the cerebral blood flow is independent of heart rate, and the blood entering the brain pushes CSF caudally in accordance with the Monro-Kellie hypothesis. However, cerebral blood flow has been shown to increase with exercise and to decrease during heavier exercise.13 If diastole shortens to a greater extent than systole with increasing heart rate, then our model may overestimate syrinx velocities at higher cycle rates.
Conclusions
Fluid in syrinx cavities moves during the cardiac cycle, affected by heart rate and CSF fluid velocity. Velocities in the cyst range over a wide range of values. The frequency of fluid oscillation in a syrinx does not vary with heart rate or CSF velocity.
Acknowledgments
Part of the MR study was presented (“Assessment of CSF Velocities and Cord Motion Before and After Chiari 1 Decompression”) by Dr Justin Brucker at the American Society of Spine Radiology, Las Vegas, 2015.
Funding
This work was supported by the Research Council of Norway, under FRINATEK, grant number: 250731/F20.
Conflict of interest
The authors declared no potential conflicts of interest with respect to the research, authorship, and/or publication of this article.
References
- 1.Honey CM, Martin KW, Heran MKS. Syringomyelia fluid dynamics and cord motion revealed by serendipitous null point artifacts during Cine MRI. AJNR Am J Neuroradiol 2017; 38: 1845–1847. [DOI] [PMC free article] [PubMed] [Google Scholar]
- 2.Pinna G, Alessandrini F, Alfieri A, et al. Cerebrospinal fluid flow dynamics study in Chiari I malformation: Implications for syrinx formation. Neurosurg Focus 2000; 8: 1–8. [DOI] [PubMed] [Google Scholar]
- 3.Lichtor T, Egofske P, Alperin N. Noncommunicating cysts and cerebrospinal fluid flow dynamics in a patient with a Chiari I malformation and syringomyelia—Part II. Spine 2005; 30: 1466–1472. [PubMed] [Google Scholar]
- 4.Martin BA, Labuda R, Royston TJ, et al. Spinal subarachnoid space pressure measurements in an in vitro spinal stenosis model: Implications on syringomyelia theories. J Biomech Eng 2010; 132: 111007. [DOI] [PubMed] [Google Scholar]
- 5.Bertram CD. A numerical investigation of waves propagating in the spinal cord and subarachnoid space in the presence of a syrinx. J Fluids Struct 2009; 25: 1189–1205. [Google Scholar]
- 6.Ozawa H, Matsumoto T, Ohashi T, et al. Mechanical properties and function of the spinal pia mater. J Neurosurg Spine 2004; 1: 122–127. [DOI] [PubMed] [Google Scholar]
- 7.Smith JH, Humphrey JA. Interstitial transport and transvascular fluid exchange during infusion into brain and tumor tissue. Microvasc Res 2007; 73: 58–73. [DOI] [PubMed] [Google Scholar]
- 8.Logg A, Mardal KA and Wells GN (eds) Automated solution of differential equations by the finite element method: The FEniCS book. Heidelberg: Springer Science & Business Media, 2012.
- 9.Vinje V. Simulating cerebrospinal fluid flow and spinal cord movement associated with syringomyelia—fluid-structure interaction in idealized geometries. MSc Thesis, University of Oslo, Norway, 2016.
- 10.Brugières P, Idy-Peretti I, Iffenecker C, et al. CSF flow measurement in syringomyelia. AJNR Am J Neuroradiol 2000; 21: 1785–1792. [PMC free article] [PubMed] [Google Scholar]
- 11.Shah S, Haughton V, del Río AM. CSF flow through the upper cervical spinal canal in Chiari I malformation. AJNR Am J Neuroradiol 2011; 32: 1149–1153. [DOI] [PMC free article] [PubMed] [Google Scholar]
- 12.Linge SO, Mardal KA, Haughton V, et al. Simulating CSF flow dynamics in the normal and the Chiari I subarachnoid space during rest and exertion. AJNR Am J Neuroradiol 2013; 34: 41–45. [DOI] [PMC free article] [PubMed] [Google Scholar]
- 13.Ogoh S, Ainslie PN. Cerebral blood flow during exercise: Mechanisms of regulation. J Appl Physiol (1985) 2009; 107: 1370–1380. [DOI] [PubMed] [Google Scholar]


