Abstract
The visualization of wear depth in hip prostheses can assist the evaluation of new bearing materials and implant designs. The goal of this study was to develop an accurate, fast, and economical methodology to generate colorimetric maps of wear depth in hip implants using a structured light 3D optical scanning system. The accuracy and precision of this novel technique were determined using reference blocks with known wear depths. This technique was then used to measure the in vitro wear of a hip resurfacing device for canines that incorporates a highly cross-linked polyethylene liner. The 3D optical scanner had an average accuracy of 2.1 µm and an average precision of 1.4 µm, which corresponded to errors less than 10% when measuring wear depths of 20 µm or greater. The scanner was able to repeatedly generate 3D colorimetric maps of wear depth in highly cross-linked polyethylene liners in 20 min or less. These colorimetric maps identified localized regions with 3-fold greater wear than the average wear depth, and revealed liners with asymmetric wear patterns. For the first time, this study has validated the use of 3D optical scanning to quantify in vitro surface wear in a hip replacement device.
Keywords: Highly cross-linked polyethylene, Hip simulator, Structured light, Colorimetric map, Wear map, CMM
1. Introduction
An ongoing challenge for hip replacement surgery is improving device longevity for younger patients. On average, the life expectancy of a total hip replacement is 15–20 years [1], and a primary reason for the limited life span is wearing of the implant bearing surface, which can lead to periprosthetic osteolysis and subsequent aseptic loosening [2,3]. To extend implant life and prevent premature failures, new material technologies for bearing surfaces have been developed in the past two decades with enhanced wear properties [2,4], including highly cross-linked polyethylene; a material that is more wear resistant than conventional polyethylene [5]. The inclusion of thin highly cross-linked polyethylene liners in total hip replacement has enabled the use of large-diameter articulations that reduce the risk of dislocation, the most common cause of early failure in hip replacements [6]. In addition, highly cross-linked polyethylene has recently been incorporated into hip resurfacing [7,8], a surgical procedure that preserves bone and therefore improves options for future revision surgeries. However, a potential problem with reducing liner thickness with highly cross-linked polyethylene is that thin liners are potentially more susceptible to detrimental cupping and uneven wear [8,9]. Therefore, accurate techniques to visualize bearing wear are critical to evaluate the in vitro efficacy of new bearing materials and device designs [10].
The visualization of surface wear requires the accurate measurement of wear depth across the entire bearing surface. The international standard for measuring wear depth in the acetabular liner of hip prostheses is with a coordinate measuring machine (CMM) [11,12]. CMMs use a contact probe to record the coordinate points of the worn implant, where any measured differences from the idealized original geometry is used to establish three-dimensional (3D) wear patterns with an accuracy of 0.7–5 µm [13–17]. Other methods for measuring liner wear depth include laser scanning and micro computed tomography (micro-CT) [18,19,20]. All of these established methods have unique advantages, but common limitations are long scanning times, a limited number of sampling points, and high equipment costs [18,20]. A likely consequence of these limitations is that most studies that investigate in vitro wear in joint prostheses only analyze wear by measuring mass loss via gravimetric methods [21]. To make the visualization of surface wear a more accessible and standard procedure in joint replacement studies, a need exists to develop an alternative, cost-effective imaging technique that can quickly and accurately measure wear depth and generate a topographical colorimetric mapping of wear patterns.
An optical technology that has potential to overcome current limitations in visualizing wear depth in joint replacement devices is structured light 3D optical scanning. Structured light technology uses an image projector to emit patterns of parallel lines onto a 3D object of interest. Cameras capture the distorted light pattern and the displacements of the distorted stripes are converted into surface coordinates that are used to quickly generate an accurate 3D reconstruction of the object geometry. Common applications of 3D optical scanners include automated optical inspection to detect physical defects in parts and in reverse engineering to obtain precise computer-aided drawings [22,23,24]. While 3D optical scanners have recently been used to measure bearing wear in total knee replacements [25], they have not yet been used to produce colorimetric maps of in vitro surface wear in hip replacement devices.
The objective of this research was to develop and validate a procedure to produce 3D colorimetric maps of in vitro surface wear in hip replacement devices using a 3D optical scanner. This procedure was then used to measure the surface wear of a hip resurfacing implant for canines that incorporates a thin highly cross-linked polyethylene liner.
2. Material and methods
2.1. Setup and calibration
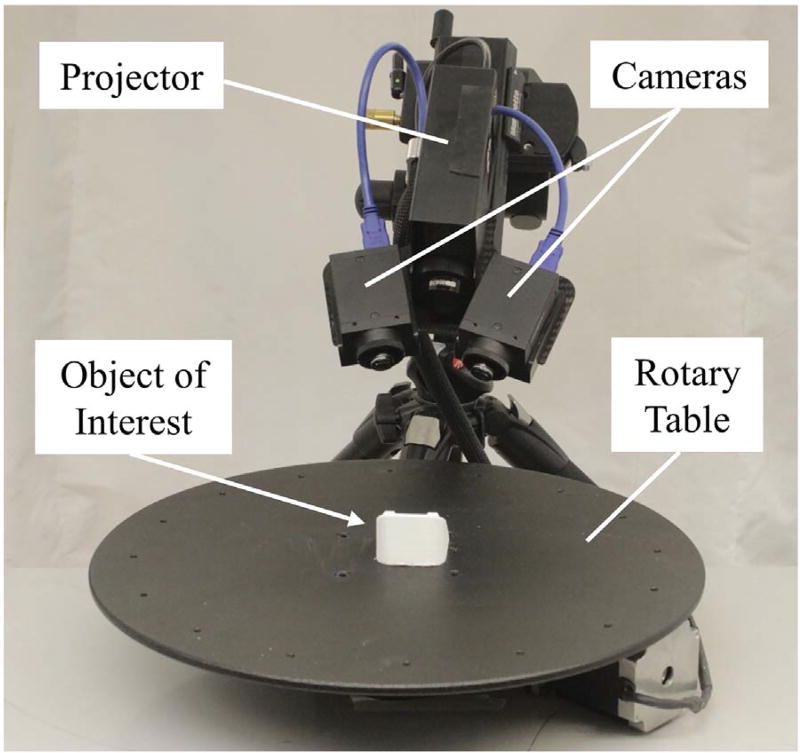
The 3D optical scanner consisted of a projector, a rotary table, and two low-profile cameras (2.8 megapixels) angled down at 45° and rotated inward at 15° (LMI Technologies, Delta, Canada; HDI Advance R2 projector with 17.5 mm/F8 83954 lenses) (Fig. 1). This system was operated with FlexScan 3D software (LMI Technologies) on a computer with a 2.4 GHz processor. Two modifications were made to the purchased 3D optical scanner to better capture the surface topology of a small object of interest. First, the original camera lenses that came with the scanner had a focal length of 12 mm and were exchanged for 17.5 mm lenses, which improved the scan resolution. Second, the original projector with a ~ 150 mm wide field of view was exchanged for a smaller projector with a ~ 50 mm wide field of view (working volume = 50 × 40 × 30 mm), which improved the level of precision achieved from each resolved measurement. For example, the standard projector with a wide field of view would effectively “soften” the scans of small objects by averaging results of measured points, making fine surface imperfections difficult to detect. By decreasing the field of view, our modified setup was able to increase the number of points measured on small objects by 16 times compared to the original setup.
Fig. 1.
Primary components of the 3D optical scanner used in this study.
A five-step calibration procedure was completed prior to scanning any objects. This procedure followed manufacturer recommendations [26], and utilized a calibration card that consisted of a 2.5 × 2.0 cm grid of 2 × 2 mm black and white squares to define a 3D field of view for the scanner. First, the depth of the field of view was defined by capturing 10–15 images of the calibration card at distances between 12 and 13 cm from the cameras. Second, to improve accuracy in measuring object depth, the calibration card was angled between 20° and 70° from the cameras while capturing 15–25 images. Third, per manufacturer recommendations [26], the vertical and horizontal field of view was calibrated by tilting the rigidly connected cameras and projector to capture 5–10 images of the upper, middle, and bottom regions of the calibration card. In total, approximately 30–50 images of the calibration card were captured using the aforementioned steps, resulting in a calibrated space of 50 × 40 × 30 mm. Fourth, the rotary table was calibrated to permit the object of interest to be automatically scanned at user-defined increments of rotation, which expedited the generation of 3D models. The previously described calibration card was positioned on the rotary table at an angle that was in-plane to the object being scanned and five scans were captured at increments of 20°. Lastly, to fine tune the 3D optical scanner's calibration, a reference sphere with a known diameter of 25.40 mm was scanned. Using the diameter of the reference sphere that was measured by the 3D optical scanner, a correction factor was input into the system's calibration formulation. The reference sphere was then re-scanned to ensure that the scanner's level of accuracy was repeatable, and this accuracy was between 1 and 5 µm for all tests. The entire calibration procedure needed to be performed only one time for each object of interest and took approximately 15 min to complete.
2.2. Experimental procedure to quantify surface wear
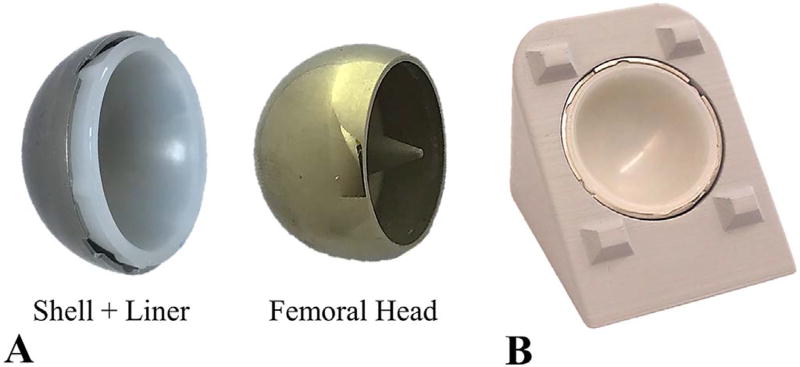
A procedure was developed to use the calibrated 3D optical scanner to detect the surface wear of a metal-on-polyethylene hip implant. For this study, the procedure was based on a standard hip implant design, where a polyethylene acetabular liner is press-fit into a metal shell, and articulates against a metal femoral head (Fig. 2A). Wear is detected by measuring differences in surface topology between two groups of acetabular liners: control and wear. The wear liners are subjected to articulating loads that cause wear, while control liners are not subjected to these articulating loads. The procedure to measure wear depth took approximately 20 min, and can be broken into three main steps: preparation, data acquisition, and post-processing.
Fig. 2.
Hip resurfacing implant (24 mm diameter). A) Implant components. B) Custom stand that holds the shell and liner during 3D optical scanning.
The preparation step involved coating each liner to reduce light reflectance and enhance the quality of the scan. The coating material was composed of 1/4 teaspoon of hexagonal boron nitride dissolved in 6 ml of acetone, and it was applied at a distance of 10–12 in. using an airbrush (Paasche, Chicago, IL, pressure = 35 psi). Hexagonal boron nitride was used because its small particle size of 0.5 µm decreased the amount of scan noise. Furthermore, acetone was used as the solvent because of its ability to quickly evaporate. The thickness of the surface coating when using this protocol was quantified by applying one and two surface coatings to the reference sphere. The diameter of the sphere after one and two coats was measured using a fitting feature in the scanner software, and the coating thickness was calculated by taking the difference between these diameters and dividing by two. This process was repeated seven times to estimate an average coating thickness of 2.1 ± 2.2 µm.
Once the surface coating was applied to an individual liner, a plastic stamp was used to uniformly press the liner into a metal shell (Fig. 2A), which was permanently cemented in a 3D printed stand (Fig. 2B). This stand was specifically designed with protruding geometry to assist with scan alignment. The stand was sprayed with foot powder, since it adhered better to the polylactic acid material used to print the stand. Only one stand was used for all tests, and this stand was rigidly attached to the rotary table platform to consistently hold the stand when scanning control and wear specimens. The preparation step took approximately 5 min to complete.
For the data acquisition step, multiple scans of each control and wear liners were taken using the automated rotary table (Fig. 1). Ambient light was minimized by scanning in a dark room, where the only light source came from the projector. By scanning in a dark room, external light could not influence the quality of the scans. This resulted in a single liner having 1.3% more points resolved than when scanning in a room with ambient light. In the scanner software, the projector's exposure time was set to 66.67 ms to prevent over- and under-exposure of the stand and liner. This exposure setting was necessary for a balanced contrast between white and black light patterns, where over-exposure (exposure time = 150 ms) and under-exposure (exposure time = 16.67 ms) caused an approximate 70% and 18% decrease in the number of points measured in the liner, respectively. A customized script was then written to scan the liner and stand every 10°, allowing for a 100° view to be captured. Each scan took approximately 20 s, and a total of 11 scans were captured for each liner using this script (Fig. 3). The total time needed to scan both the control and wear liners was approximately 10 min.
Fig. 3.
The scanner software combined 11 scans into a 3D model by aligning each scan with respect to the stand geometry. The 3D model consisted of the stand and liner. Note: The 3D model pictured above is an ideal representation of a 3D model produced from the 11 scans.
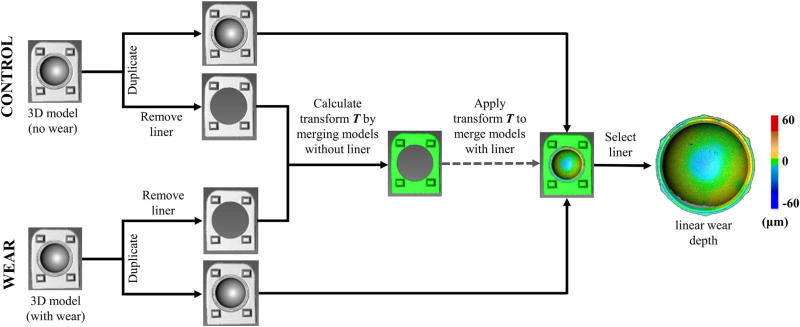
In the post-processing step, wear depth was measured by aligning and merging (i.e. registering) the control and wear liners. The alignment step is a procedure where all 11 scans are combined into a 3D model by aligning each scan based on common geometry (Fig. 3). The protruding geometry on the stand enhanced scan alignment by adding out-of-plane surfaces that assisted the least squares algorithm used by the scanner software to match surface geometries. The 3D model was then duplicated, where the duplicate stand had all regions containing the liner removed, while keeping the stand region (Fig. 4). In other words, there were two 3D models generated for each control and wear specimen, one with the stand + liner, and one with only the stand. The stand acted as a consistent frame of reference between the control and wear specimens, and therefore the merging of the control and wear 3D models (i.e. registration) was based only on the stand geometry. The transformation matrix T used to merge the 3D models of the control stand and the wear stand, when the liners were removed, was recorded. This transformation matrix was automatically calculated when using the merge feature in the scanner software and could be viewed as a text file. The wear and control 3D models of the stand + liner were then merged using this previously computed transformation matrix T. The reason we calculated the transformation matrix with the liners removed (Fig. 4) was that the average surface deviation between the merged stands was 8.6 ± 2.4 µm with the liners included and 5.1 ± 1.0 µm with the liners removed. Lower surface variations in the stand indicated better alignment of the registered models. Since we selected the same stand features to merge the stand + liner 3D model and the stand only 3D model, these results suggest that the software's merging tool could be affected by geometric features not specifically selected for merging. In total, this post processing step took approximately 5 min to complete and resulted in a high resolution colorimetric map of surface wear (~1.8 million points for each liner).
Fig. 4.
Flow chart of the post-processing methodology to measure wear depth. Three-dimensional models of control and wear specimens were merged, and the deviation between merged specimens was defined as wear depth. To improve alignment, the transformation matrix used to merge the 3D models was calculated when the liner was removed.
2.3. Measuring accuracy using reference blocks
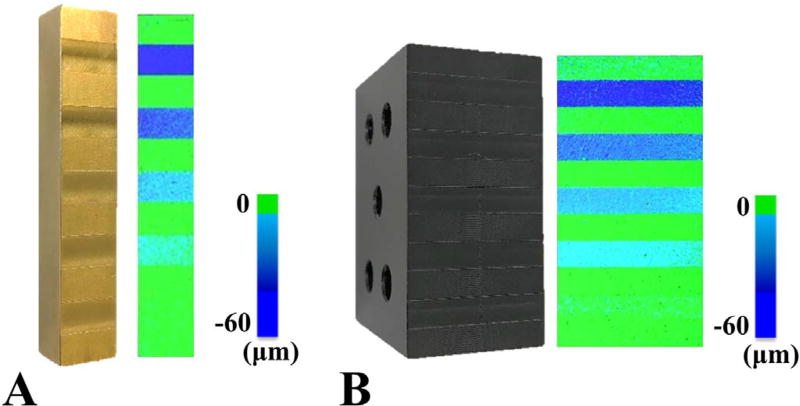
Tests were conducted to determine the 3D optical scanner's accuracy when using the procedure described in Section 2.2. For these tests, brass and delrin materials were selected to represent the metal and plastic liners used in total joint replacement devices. Both were machined with recesses of known depths of 10, 20, 30, 40, and 50 µm (Fig. 5A–B). The known wear depths, Wactual, of each recess were measured using a surface gauge with a dial indicator on a granite surface plate (Starrett, Athol, MA; resolution = ± 0.5 µm). To represent the control and wear surfaces required to measure wear (Fig. 4), the “wear surface” for the reference blocks was defined as the front recessed surface, while the "control surface" was the back surface, which was leveled for an accurate comparison. Using the previously described procedure in Section 2.2, the wear surface was merged with the leveled control surface to generate a colorimetric map that displayed the wear depth of each reference block (Fig. 5A–B). This merging resulted in surface deviations of 4.8 ± 0.3 µm for the non-recessed regions of the stand. For both reference blocks, the colorimetric maps were then segmented to record the average wear depth, Wmeasured, in three small circular sections within each recess (area = ~1.5 mm2). The full procedure of scanning the blocks, generating colorimetric maps, and segmenting all recesses was conducted four times (i.e. four trials) in order to measure the repeatability of the system. For each new trial, the reference blocks were cleaned and re-sprayed with a surface coating to ensure the preparation step was repeatable. Accuracy in measuring the wear depth was defined as the absolute mean difference (|Wmeasured – Wactual|), while the error in measuring the wear depth was defined as the absolute mean percentage error (|Wmeasured – Wactual|/Wactual). The precision was defined as the standard error of the mean for each group of accuracy measurements (s /√n), where s is the standard deviation and n is the number of samples measured for each recess, which would be 12 per recess (4 trials with 3 measurements in each recess per trial).
Fig. 5.
Reference blocks with machined recesses were used to produce colorimetric maps of linear wear depth for A) metal and B) plastic materials.
2.4. Mapping surface wear in a hip implant
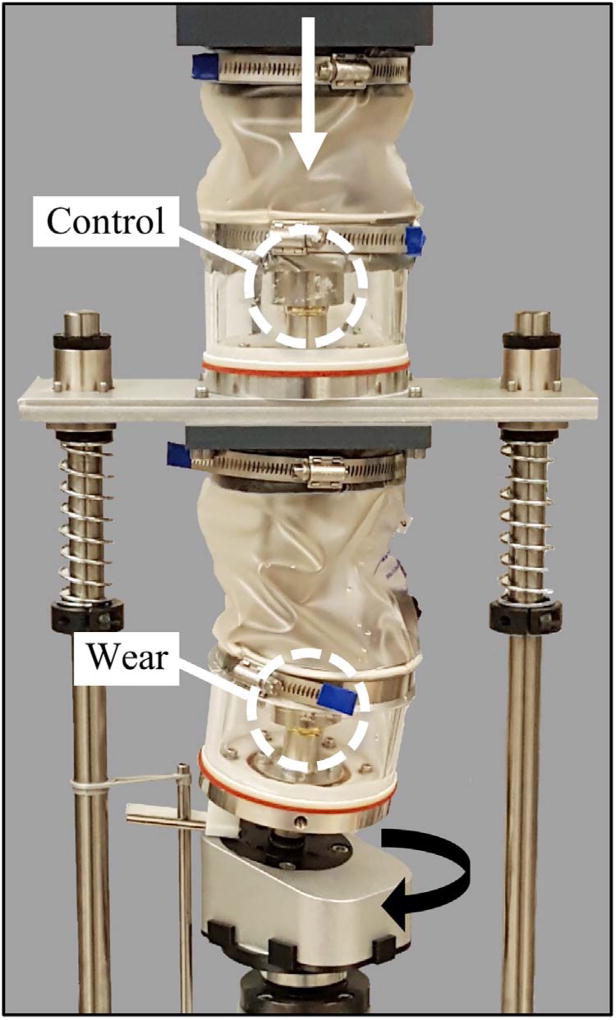
The 3D optical scanner was used to map surface wear in the highly cross-linked polyethylene liner of a canine hip resurfacing implant (Fig. 2). For wear testing, a hip simulator was developed [27] to reproduce canine hip kinematics based on international standards for wear testing of human hips (Fig. 6) [28,27]. In brief, the upper test chamber housed the control implant and was only subjected to axial loading, and the lower test chamber housed the wear implant and was subjected to axial and torsional loading. Each chamber contained bovine serum heated to 37 °C. An electrodynamic mechanical test system (Instron, Norwood, MA; E10000) applied a peak vertical load of 211 N at 2 Hz through the upper implant fixture, which was also transmitted onto the lower implant. A total of eight acetabular liners (four control, four wear) were each subjected to four test stages of 275,000 cycles for a total of 1.1 million cycles [27]. Prior to wear testing, each liner was physically marked on the backside to ensure consistent re-insertion into the hip simulator between testing stages.
Fig. 6.
Hip simulator used to apply 1.1 million loading cycles to canine hip resurfacing implants.
Gravimetric wear analysis was conducted every 275,000 cycles to determine net mass loss of each liner. Initially, all liners were soaked in diluted bovine serum for 48 h and then weighed. After each cycle of testing in the hip simulator, the liners underwent ultrasonic cleaning and drying in a vacuum desiccator, and were each weighed three times using a microbalance (Metter, Toledo OH; AT201, resolution = 0.1 mg).
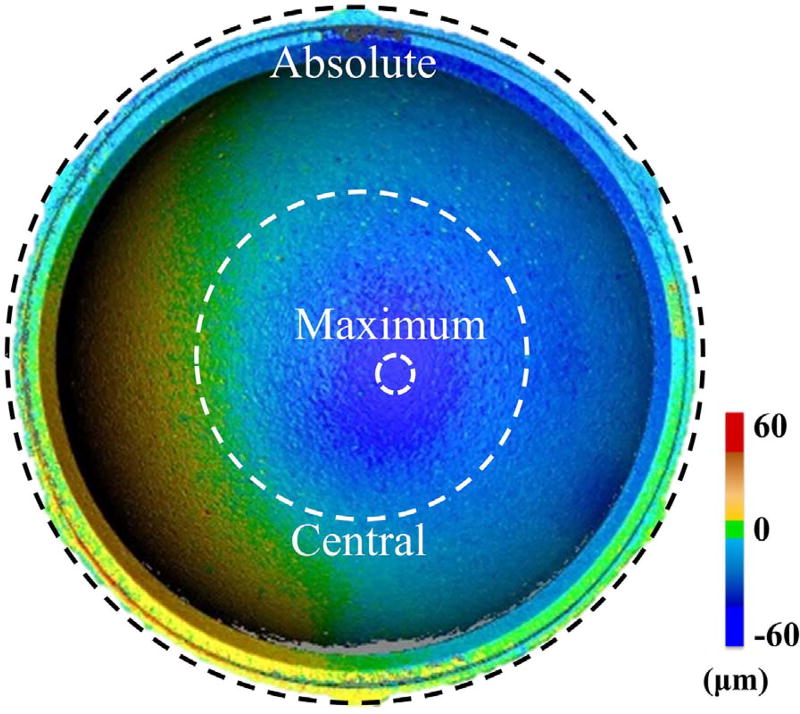
Once the gravimetric wear analysis was completed for the final cycle of tests, the 3D optical scanner was used to quantify and visualize the linear wear depth between the control and wear liners. All eight liners were prepared and scanned using the aforementioned procedure (Fig. 4). To test the repeatability of our testing protocol, each liner went through three trials of imaging, where for each trial, the liners were cleaned, sprayed with a surface coating, and inserted into the stand. The liners and metal shell were marked to consistently orient the liners in the stand between the three trials. To measure the average surface wear between the liners, three different regions were defined: absolute, central, and maximum (Fig. 7). For this study, absolute wear was defined as 100% of the liner surface area (~ 1234 mm2); central wear was defined as 15 ± 0.6% (185.1 ± 7.3 mm2) of the liner surface area in the central region; and maximum wear, which was detected by observation, accounted for 0.15 ± 0.04% (1.8 ± 0.4 mm2) of the liner's surface area.
Fig. 7.
Location of absolute, central, and maximum wear regions on a liner.
2.5. Statistical analysis
The effect of material type and the magnitude of wear depth on the accuracy, precision, and error in measuring wear depth was assessed using a MANOVA. An ANOVA test was performed to detect differences in average wear depth between the four tested liners depending on the type of wear measurement (i.e. absolute, central, and maximum). For both MANOVA and ANOVA analyses, a Bonferonni adjustment was used for pairwise comparisons. The goodness of fit between the wear depth measured using the 3D optical scanner and the mass loss measured using gravimetric analysis was quantified using the coefficient of determination (R2). For all statistical tests, significance was set at p < 0.05.
3. Results
The average accuracy of the system when measuring all recesses in the plastic and metal reference blocks was 2.1 ± 1.7 µm and 1.9 ± 1.0 µm, respectively (Fig. 8A). This accuracy corresponded to average errors in measuring “wear depth” of 7.8 ± 7.6% and 9.7 ± 10.8% for plastic and metal, respectively. The material type had no effect on accuracy or error (p = 0.46 and 0.17, respectively); however, the magnitude of the wear depth did have a significant effect on error (p < 0.001). For example, the error in measuring a 10 µm wear depth was significantly greater than measuring any other wear depth (Fig. 8B), but there was no difference in error when detecting wear depths with magnitudes between 20–50 µm.
Fig. 8.
Accuracy of the 3D optical scanner was tested using reference blocks with known wear depths. A) Accuracy was independent of wear depth and material. B) Percent error decreased at greater wear depths. Error bars are in standard error to represent precision. * = greater error than all other wear depths (p < 0.05).
The average precision of the system when measuring all recesses in the plastic and metal reference blocks was 1.4 ± 0.5 µm and 0.4 ± 0.2 µm, respectively (Fig. 8A, error bars). The material type had a significant effect on precision (p < 0.001), but the magnitude of the wear depth did not affect the precision (p = 0.33).
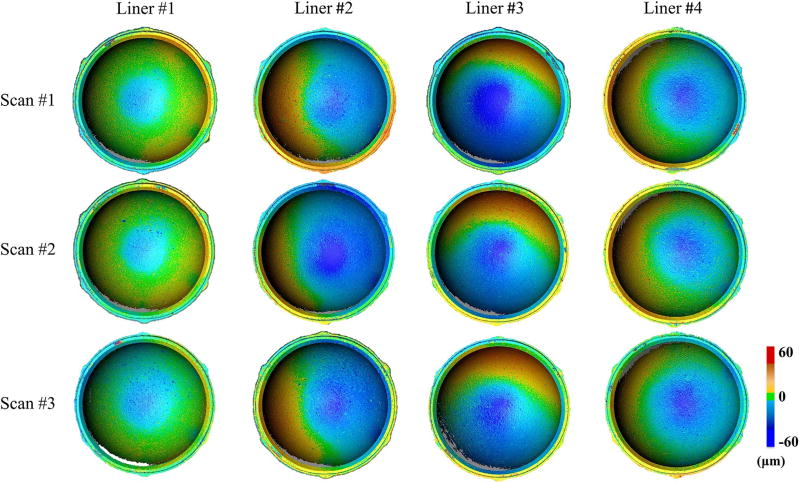
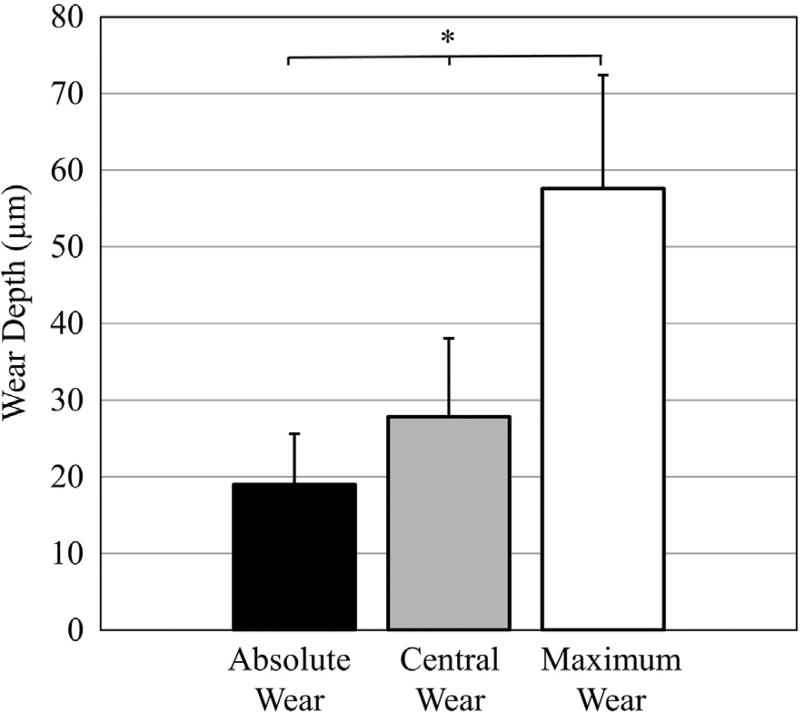
The wear patterns of four highly cross-linked polyethylene liners were successfully visualized with the 3D optical scanner (Fig. 9). For all liners, the absolute, central, and maximum wear depths were 19 ± 7 µm, 28 ± 10 µm, and 58 ± 15 µm, respectively (Fig. 10). Differences in wear depth existed between liners when measuring absolute, central, and maximum wear (p < 0.005). For example, liner #1 had 50 ± 14% less absolute wear, 57 ± 6% less central wear, and 43 ± 5% less maximum wear compared to the other three liners (p < 0.05). Cup deformation was apparent in the four liners, as the liner material was raised by at least 20 µm in 13 ± 7% of the liner surface area. The repeatability of the complete imaging procedure was determined by analyzing differences in the average wear depth between the three 3D models that were independently acquired for each liner (Fig. 9). The average repeatability of the scanning protocol was 1.2 ± 0.8 µm when measuring absolute wear, and was 4.7 ± 2.4 µm when measuring central wear.
Fig. 9.
Wear maps of acetabular liners that were generated using 3D optical scanning. To evaluate the repeatability of this imaging technique, the complete scanning protocol was repeated three times to acquire three 3D models (scan #1–3) of each liner exposed to in vitro wear testing (liner #1–4).
Fig. 10.
Average wear depth per region for all four polyethylene liners exposed to wear testing. *Indicates wear depth was significantly different between each region.
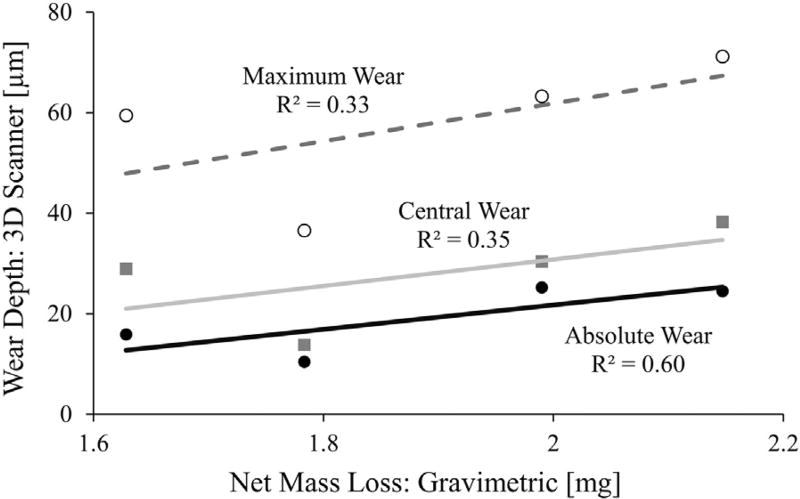
Positive correlations existed between the linear wear depths measured from the 3D optical scanner and the net mass loss measured from gravimetric analysis (Fig. 11). The strongest correlation with net mass loss was from the absolute measurements for wear depth (R2 = 0.60).
Fig. 11.
Weak to moderate positive correlations were found between liner mass loss via gravimetric analysis and liner wear depth via 3D optical scanning.
4. Discussion
This study has developed and validated a 3D optical scanning procedure to measure wear depth in highly cross-linked polyethylene liners of hip replacement devices. The procedure described in this study was able to detect wear depth in a polymer with an average accuracy of 2.1 µm and an average precision of 1.4 µm, which corresponded to an average error less than 10% when measuring 20 µm or more of wear depth. Once the system was calibrated, the time to generate a 3D colorimetric map of surface wear in the highly cross-linked polyethylene liner of a hip resurfacing device was less than 20 min. These results demonstrate that a 3D optical scanner can serve as a fast and accurate method to acquire colorimetric mappings of surface wear in joint replacement devices.
To our knowledge, this is the first study to validate a procedure to map in vitro wear in a hip replacement device using a 3D optical scanner, and is the first study to demonstrate that 3D optical scanners can repeatedly visualize wear patterns in highly cross-linked polyethylene liners. Three-dimensional optical scanners have typically been used for 3D modeling and dimensional measurement applications in the fields of product inspection and reverse engineering. In product inspection, 3D optical scanners have proven advantageous at monitoring quality compliance compared to traditional measuring tools, such as general purpose robots and CMMs, because of the 3D optical scanner's real-time inspection abilities, proper accuracy, and high speed [22]. These same benefits are applicable to reverse engineering, where complex physical objects need to be quickly and accurately converted to high resolution models composed of millions of points [23,24]. A study by Brajlih et al. investigated the use of 3D optical scanners for the quality inspection of complex objects and determined that their scanner had a standard uncertainty less than 12 µm when measuring gauge blocks in a small working volume (135 × 108 × 95 mm) [22]. Three-dimensional optical scanning has also been used in biomedical research, where a study by Ma et al. found that a 3D scanner had an average accuracy of 930 µm when recording facial morphology [29]. More recently, 3D optical scanning has been used by Affatato et al. to measure wear of conventional polyethylene in total knee replacements [25]. The study by Affatato et al. measured maximum wear depths of 300 µm using a scanner with a manufacturer reported accuracy of 10 µm. The present study has extended the medical application of 3D optical scanning to the surface analysis of highly cross-linked polyethylene liners in joint replacement devices. The average accuracy of our 3D optical scanning system when measuring reference blocks was 2.1 µm. This level of accuracy was necessary to detect faint wear patterns in highly cross-linked polyethylene that had maximum wear depth of only 58 µm. In order to maximize accuracy, our scanner setup included the use of 17.5 mm camera lenses and a high resolution projector that could focus on a small working volume of 50 × 40 × 30 mm. The accuracy of 3D optical scanners could potentially be further improved by using higher resolution cameras and projectors with enhanced optical quality.
The most common method for measuring wear depth in joint replacements is with CMMs (Table 1). Standard CMMs have an accuracy of around 3 µm [31], while high-end CMMs can have an accuracy of 0.7–1 µm [13–15], and are the recommended technology for measuring wear in “soft” and “hard” hip components [11,12]. However, there are a few notable limitations when using CMMs that 3D optical scanning may address. First, CMMs can take 90 min to accurately probe 322,000 points on a polyethylene liner [14]. The measuring time is directly related to the continuous CMM probe path, where decreasing the number of sampling points will cause regions of high wear in a liner to be underestimated [14,17]. In comparison, the 3D optical scanner in the present study scanned 1.8 million points in under 10 min (Table 1). This scan time was achieved with a standard 2.4 GHz processor, and could likely be further improved by using a faster processor. Second, CMMs that can measure wear depth to an accuracy of approximately 1 µm are expensive, with prices exceeding $80,000. In comparison, the type of 3D optical system used in the present study can be purchased for between $15,000 to $25,000. Other limitations of CMMs that can be addressed with 3D optical scanners include portability and modeling complex geometries with narrow features where it is difficult to probe. Although CMM systems remain the established standard for accuracy, the practical advantages of 3D optical systems with respect to image resolution, time, and cost make these scanners a promising technology to analyze wear depth.
Table 1.
Comparison of methods to measure surface wear in acetabular liners.
| Study | Method | Accuracy (µm) |
Scan Time (min) |
Number of pointsa |
|---|---|---|---|---|
| Present study | Optical Scanner | 2.1 | 10 | ~ 1.8 million |
| Lord et al. [15] | CMM | 0.9 | 20 | 3024–4104 |
| Wang et al. [17] | CMM | 1.9 | 50 | 3720 |
| Teeter et al. [20] | Micro-CT | 50b | 95 | Not given |
| Bowden et al. [18] | Micro-CT | 74b | 240 | Not given |
| Yun et al. [30] | Laser Scanner | Not given | 25–34 | Not given |
Measured on the acetabular liner.
Accuracy based on spatial resolution of the Micro-CT system.
The 3D optical scanner can also be compared to less common methods to measure wear depth, such as micro-CT and laser scanners (Table 1). Micro-CTs generate a 3D image from a large series of two-dimensional radiographs and have reported resolutions of between 50 and 74 µm when imaging acetabular liners [18,20]. At this resolution, the accuracy of micro-CTs in measuring liner wear depth will be inferior to CMMs and our 3D optical scanner; however, advantages of micro-CT include volumetric measurement and the ability to detect subsurface cracks [32]. Other limitations of micro-CT include time and cost. A micro-CT scan can take 95 min to 4 h to complete a high quality 3D image [18,20], and the cost of a micro-CT system is approximately 15-fold more than a 3D optical system. Laser scanners, which project a single strip of light to measure point coordinates and create a 3D model, have also been used to measure wear depth. Higher-cost laser scanners have been reported to have an accuracy of 34 µm and a precision of 10 µm when measuring a 100 mm long gage block [19]. Compared to the 3D optical scanner in this study, these laser scanners cost two to three times as much [19] and take about three times as long to scan an object [30].
Generating colorimetric maps of liner wear depth can enable the visualization of high wear regions and the detection of abnormal cup deformation. The identification of these metrics can improve the evaluation of implant design, and inform the selection of design parameters. Similar to Bills et al., this present study reported high wear regions [31]. More specifically, all liners experienced a localized region of maximum wear depth that was over 3-fold greater than the average “absolute” wear depth measured for the whole liner surface. By using estimates of annual activity levels, this information can be used to predict the annual loss in localized liner thickness. Interestingly, only a weak correlation existed between maximum wear depth and net mass loss (Fig. 11), indicating that considerable localized wear can occur in liners with only moderate mass loss. All four liners also showed cup deformation, yet the cupping in liners #2 and #3 was the most apparent with the material being raised by at least 20 µm in 19 ± 7% and 19 ± 5% of the liner surface area, respectively. This positive raising of the liner rim is not unexpected, as it has been shown in several other studies [15,20,31], and the thin acetabular liners used in this study are more susceptible to cup deformation [8]. The detection of cup deformation is important for the design and testing of hip implants, since cup deformation can potentially lead to acetabular cup clamping on the femoral head [33].
The accurate measurement of in vitro wear depth using 3D optical scanning required the design and fabrication of a stand to securely hold the acetabular liners. More specifically, a metal shell was cemented into a 3D printed stand to ensure repeatable insertion and removal of control and wear liners (Fig. 2B). To quantify this repeatability, we conducted three trials on each liner, where each trial consisted of cleaning and coating the liner, inserting the liner into the stand, and scanning the liner. We found that re-applying the surface coating and re-inserting the liners into the stand had no effect on the wear depth measurements, as wear depth was consistently measured between trials (p = 1.0; Fig. 9), and the average variability between each liner's three trials was 1.2 ± 0.8 µm. The stand had protruding geometry to facilitate the automatic registration of 3D models, which reduced operator error by avoiding the need for manual image registration. The success of this automated process was evaluated by measuring the surface deviation of the stand after merging the control and wear 3D models. After trial and error, a procedure (Fig. 4) was developed to reduce the stand's surface deviation to 5.1 µm, a close comparison to the 4.8 µm surface deviation calculated for the reference blocks (Fig. 5). The agreement in the deviation of the reference surfaces between the liner stand and the reference blocks gave us confidence that the accuracy and precision results measured with the reference blocks were applicable to the colorimetric maps generated for the acetabular liners (Fig. 9). The relative angle of the stand and camera setup was ~ 10° (Fig. 1), which was selected to reduce the area of the acetabular liner under shadow. These shadowed regions will create voids in the 3D model (see gray regions in Fig. 9). Although these voids accounted for less than 6% of our liners' surface area, all voids could potentially be eliminated by stitching together multiple scans using different stand angles. By using a stand, this study allowed for two acetabular liners to be directly compared. A similar approach could be adopted to measure wear depth in retrieved implants, whereby retrieved “worn” liners could be compared to never-implanted “control” liners.
There are several notable limitations in this study. First, the reference blocks used to determine the accuracy of the 3D optical scanner had a different curvature and material transparency than the acetabular liners. Therefore, the accuracy reported for the reference blocks should be treated as a best-case scenario. Second, as is the case for all optical imaging techniques, 3D optical scanning cannot measure in vivo wear behavior, nor can it distinguish between true particulate wear or time-dependent creep. In this study, we minimized any imaging artifact from creep by using reference dimensions from a load soak control that would have simultaneously experienced creep from axial loading [12]. Therefore our colorimetric maps should represent material loss and not plastic deformation (i.e. creep). Unfortunately, the FlexScan software used in this study is currently unable to directly calculate a volume difference between control and wear implants. Third, this study did not measure back-side wear of the liner [20], but a procedure similar to the one we introduced (Fig. 4) could feasibly be designed to measure backside wear with 3D optical scanning. Fourth, the procedure developed in this study was tested on highly cross-linked polyethylene liners in canine hip resurfacing implants, and has not yet been applied to larger human implants. However, the design of the canine implant is based on total hip replacement devices for humans and therefore this technique would also be applicable to human implants. Finally, an inherent limitation in 3D optical scanning is the need to apply a surface coating to reduce light reflectance on the scanned specimens. This study used a hexagonal boron nitride coating with 0.5 µm particle size. When using the coating protocol described in this study, the average coating thickness was determined to be 2.2 µm. This thickness value should be considered an estimate, since it is near the scanner's accuracy and was not based on a single coating, but rather was measured by subtracting the difference between a 1st and 2nd coat. When coating the implant liners, the amount of boron nitride and spray distance was carefully reproduced for every test. The repeatability of this procedure, as well as the uniformity of the surface coating, was demonstrated by consistently measuring wear depth after multiple trials of cleaning, coating, and scanning each individual liner (Fig. 9).
5. Conclusion
In conclusion, this study found that structured light 3D optical scanners can accurately, repeatedly, and quickly map the distribution of in vitro wear in hip prostheses. The excellent resolution of the system enabled the visualization of asymmetric wear patterns and cup deformation in highly cross-linked polyethylene liners. The technology presented in this study is a promising alternative to conventional CMM methods to measure wear depth in the polyethylene liners of joint replacement devices.
Acknowledgments
This material is based upon work supported by the Idaho Global Entrepreneurial Mission of Idaho Commerce under Award Number 2468, and the National Institute of General Medical Sciences of the National Institutes of Health under Award Number P20GM109095. A special thanks to Phil Boysen.
Footnotes
Conflicts of interest include a co-author being a paid employee for Global Inspection Solutions (DF).
References
- 1.Older J. Charnley low-friction arthroplasty: a worldwide retrospective review at 15 to 20 years. J. Arthroplast. 2002;17:675–680. doi: 10.1054/arth.2002.31973. [DOI] [PubMed] [Google Scholar]
- 2.Kumar N, Arora GN, Datta B. Bearing surfaces in hip replacement – evolution and likely future. Med. J. Armed Forces India. 2014;70:371–376. doi: 10.1016/j.mjafi.2014.04.015. [DOI] [PMC free article] [PubMed] [Google Scholar]
- 3.Dumbleton JH, Manley MT, Edidin AA. A literature review of the association between wear rate and osteolysis in total hip arthroplasty. J. Arthroplast. 2002;17:649–661. doi: 10.1054/arth.2002.33664. [DOI] [PubMed] [Google Scholar]
- 4.Illgen RL, Forsythe TM, Pike JW, Laurent MP, Blanchard CR. Highly cross-linked vs conventional polyethylene particles – an in vitro comparison of biologic activities. J. Arthroplast. 2008;23:721–731. doi: 10.1016/j.arth.2007.05.043. [DOI] [PubMed] [Google Scholar]
- 5.Pang HN, Naudie DD, McCalden RW, MacDonald SJ, Teeter MG. Highly crosslinked polyethylene improves wear but not surface damage in retrieved acetabular liners. Clin. Orthop. Relat. Res. 2015;473:463–468. doi: 10.1007/s11999-014-3858-5. [DOI] [PMC free article] [PubMed] [Google Scholar]
- 6.Zahar A, Rastogi A, Kendoff D. Dislocation after total hip arthroplasty. Curr. Rev. Musculoskelet. Med. 2013;6:350–356. doi: 10.1007/s12178-013-9187-6. [DOI] [PMC free article] [PubMed] [Google Scholar]
- 7.Amstutz HC, Takamura KM, Ebramzadeh E, Le Duff MJ. Highly cross-linked polyethylene in hip resurfacing arthroplasty: long-term follow-up. Hip Int. 2015;25:39–43. doi: 10.5301/hipint.5000190. [DOI] [PubMed] [Google Scholar]
- 8.Pritchett JW. Hip resurfacing using highly cross-linked polyethylene: prospective study results at 8.5 years. J. Arthroplast. 2016;31:2203–2208. doi: 10.1016/j.arth.2016.03.013. [DOI] [PubMed] [Google Scholar]
- 9.Zietz C, Fabry C, Middelborg L, Fulda G, Mittelmeier W, Bader R. Wear testing and particle characterisation of sequentially crosslinked polyethylene acetabular liners using different femoral head sizes. J. Mater. Sci. Mater. Med. 2013;24:2057–2065. doi: 10.1007/s10856-013-4936-z. [DOI] [PubMed] [Google Scholar]
- 10.McKellop H, Shen FW, Lu B, Campbell P, Salovey R. Development of an extremely wear-resistant ultra high molecular weight polyethylene for total hip replacements. J. Orthop. Res. 1999;17:157–167. doi: 10.1002/jor.1100170203. [DOI] [PubMed] [Google Scholar]
- 11.ASTM. Characterization of Wear from the Articulating Surfaces in Retrieved Metal-on-Metal and other Hard-on-Hard Hip Prostheses. 2014 [Google Scholar]
- 12.I.O.f. Standardization, ISO 14242-2:2000. Implants for Surgery – Wear of Total Hip-joint Prostheses – Part 2: Methods for Measurement. 2000 [Google Scholar]
- 13.Bills PJ, Racasan R, Underwood RJ, Cann P, Skinner J, Hart AJ, Jiang X, Blunt L. Volumetric wear assessment of retrieved metal-on-metal hip prostheses and the impact of measurement uncertainty. Wear. 2012;274:212–219. [Google Scholar]
- 14.Carmignato S, Spinelli M, Affatato S, Savio E. Uncertainty evaluation of volumetric wear assessment from coordinate measurements of ceramic hip joint prostheses. Wear. 2011;270:584–590. [Google Scholar]
- 15.Lord JK, Langton DJ, Nargol AVF, Joyce TJ. Volumetric wear assessment of failed metal-on-metal hip resurfacing prostheses. Wear. 2011;272:79–87. [Google Scholar]
- 16.Kothari M, Bartel DL, Booker JF. Surface Geometry of Retrieved McKee-Farrar Total Hip Replacements. Clin. Orthop. Relat. Res. 1996;329 doi: 10.1097/00003086-199608001-00014. [DOI] [PubMed] [Google Scholar]
- 17.Wang L, Peng XF, Sun CN, Wang HY, Li DC, Zhu JY, Jin ZM, Mihcin S, Liu CZ. The determination of the volumetric wear for surgically retrieved hip implants based on Cmm. J. Mech. Med. Biol. 2016;16 [Google Scholar]
- 18.Bowden AE, Kurtz SM, Edidin AA. Validation of a micro-CT technique for measuring volumetric wear in retrieved acetabular liners. J. Biomed. Mater. Res. B Appl. Biomater. 2005;75:205–209. doi: 10.1002/jbm.b.30318. [DOI] [PubMed] [Google Scholar]
- 19.Campanelli V, Howell SM, Hull ML. Accuracy evaluation of a lower-cost and four higher-cost laser scanners. J. Biomech. 2016;49:127–131. doi: 10.1016/j.jbiomech.2015.11.015. [DOI] [PubMed] [Google Scholar]
- 20.Teeter MG, Naudie DD, Charron KD, Holdsworth DW. Three-dimensional surface deviation maps for analysis of retrieved polyethylene acetabular liners using micro-computed tomography. J. Arthroplast. 2010;25:330–332. doi: 10.1016/j.arth.2009.11.001. [DOI] [PubMed] [Google Scholar]
- 21.Gaudin G, Ferreira A, Gaillard R, Prudhon JL, Caton JH, Lustig S. Equivalent wear performance of dual mobility bearing compared with standard bearing in total hip arthroplasty: in vitro study. Int. Orthop. 2017;41:521–527. doi: 10.1007/s00264-016-3346-5. [DOI] [PubMed] [Google Scholar]
- 22.Brajlih T, Tasic T, Drstvensek I, Valentan B, Hadzistevic M, Pogacar V, Balic J, Acko B. Possibilities of using three-dimensional optical scanning in complex geometrical inspection. Stroj. Vestn.-J. Mech. E. 2011;57:826–833. [Google Scholar]
- 23.Park SC, Chang M. Reverse engineering with a structured light system. Comput. Ind. Eng. 2009;57:1377–1384. [Google Scholar]
- 24.Sansoni G, Docchio F. Three-dimensional optical measurements and reverse engineering for automotive applications. Robot. Compu.-Integr. Manuf. 2004;20:359–367. [Google Scholar]
- 25.Affatato S, Valigi MC, Logozzo S. Wear of knee joint prostheses by means of 3D optical scanners. Materials. 2017;10 doi: 10.3390/ma10040364. [DOI] [PMC free article] [PubMed] [Google Scholar]
- 26.L. Technologies. FlexScan3D User Manual – Version 3.3.3.x. 2014 [Google Scholar]
- 27.Warburton KJ, Everingham JB, Helms JL, Kazanovicz AJ, Hollar KA, Brourman JD, Fox SM, Lujan TJ. Wear testing of a canine hip resurfacing implant using highly cross-linked polyethylene. J. Orthop. Res. 2017 doi: 10.1002/jor.23745. [DOI] [PMC free article] [PubMed]
- 28.I.O.f. Standardization, ISO 14242-1:2012. Implants for Surgery – Wear of Total Hip-joint Prostheses – Part 1: Loading and Displacement Parameters for Wear-testing Machines and Corresponding Environmental Conditions for Test. 2012 [Google Scholar]
- 29.Ma LL, Xu TM, Lin JX. Validation of a three-dimensional facial scanning system based on structured light techniques. Comput. Methods Prog. Biol. 2009;94:290–298. doi: 10.1016/j.cmpb.2009.01.010. [DOI] [PubMed] [Google Scholar]
- 30.Yun HH, Shon WY, Yoon JR, Yang JH, Lim DS. Reliability of a PowerPoint method for wear measurement after total hip arthroplasty a retrieval study using 3-dimensional laser scanning. J. Arthroplast. 2012;27:1530–1537. doi: 10.1016/j.arth.2011.12.025. [DOI] [PubMed] [Google Scholar]
- 31.Bills P, Blunt L, Jiang X. Development of a technique for accurately determining clinical wear in explanted total hip replacements. Wear. 2007;263:1133–1137. [Google Scholar]
- 32.Teeter MG, Yuan X, Naudie DD, Holdsworth DW. Technique to quantify subsurface cracks in retrieved polyethylene components using micro-CT. J. Long. Term. Eff. Med. Implants. 2010;20:27–34. doi: 10.1615/jlongtermeffmedimplants.v20.i1.40. [DOI] [PubMed] [Google Scholar]
- 33.Markel D, Day J, Siskey R, Liepins I, Kurtz S, Ong K. Deformation of metal-backed acetabular components and the impact of liner thickness in a cadaveric model. Int. Orthop. 2011;35:1131–1137. doi: 10.1007/s00264-010-1077-6. [DOI] [PMC free article] [PubMed] [Google Scholar]


