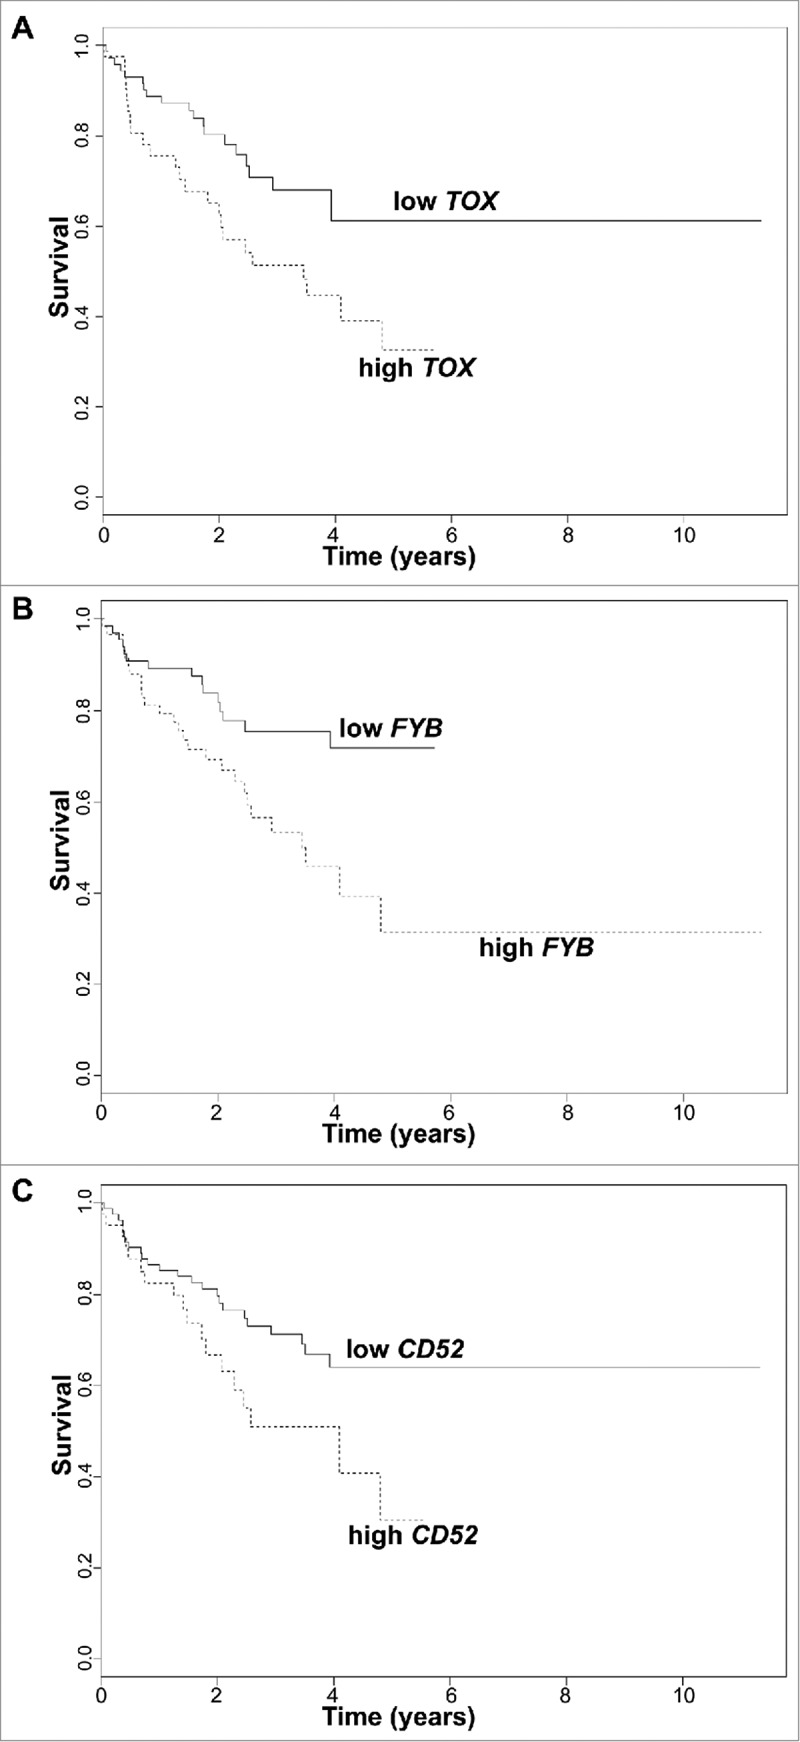
Figure 2.

Survival analysis plots of all CTCL samples according to gene expression for TOX (A), FYB (B), and CD52 (C). Samples are dichotomized based on gene expression levels in TPM after finding an optimal cut-off; samples with TPM below cut-off labelled as low (solid line) and samples with TPM above cut-off labelled as high (dotted line). Survival plots correspond to Cox proportional hazards regression models.
