

ABSTRACT
Autoantibodies against tumor-associated antigens (TAAs) are attractive non-invasive biomarkers for detection of cancer due to their inherently stable in serum. Serum autoantibodies against 9 TAAs from gastric cancer (GC) patients and healthy controls were measured by enzyme-linked immunosorbent assay (ELISA). A logistic regression model predicting the risk of being diagnosed with GC in the training cohort (n = 558) was generated and then validated in an independent cohort (n = 372). Area under the receiver operating characteristic curve (AUC) was used to assess the diagnostic performance. Finally, an optimal prediction model with 6 TAAs (p62, c-Myc, NPM1, 14-3-3ξ, MDM2 and p16) showed a great diagnostic performance of GC with AUC of 0.841 in the training cohort and 0.856 in the validation cohort. The proportion of subjects being correctly defined were 78.49% in the training cohort and 81.99% in the validation cohort. This prediction model could also differentiate early-stage (stage I-II) GC patients from healthy controls with sensitivity/specificity of 76.60%/72.34% and 80.56%/79.17% in the training and validation cohort, respectively, and the overall sensitivity/specificity for early-stage GC were 78.92%/74.70% when being combined with two cohorts. This prediction model presented no significant difference for the diagnostic accuracy between early-stage and late-stage (stage III – IV) GC patients. The model with 6 TAAs showed a high diagnostic performance for GC detection, particularly for early-stage GC. This study further supported the hypothesis that a customized array of multiple TAAs was able to enhance autoantibody detection in the immunodiagnosis of GC.
KEYWORDS: Autoantibody, cancer immunodiagnosis, gastric cancer, tumor-associated antigens
Introduction
Gastric cancer (GC) is the fifth most common malignant tumor and the third leading causes of cancer death worldwide. More than 950,000 new GC patients (6.8% of total) and an estimated 720,000 deaths (8.8% of total) occurred in 2012.1,2 The high mortality for GC is mainly attributed to its diagnosis at late-stage (stage III – IV). The overall 5-year survival rate varies from 4% to 20% and the median survival is about 8 to 12 months. Fewer than 20% of GC patients are diagnosed at early-stage (stage I-II) and the 5-year survival rate patients completing curative resection achieves 75%.3-5 The diagnosis of GC patients with early-stage is hindered by the paucity of specific clinical symptoms and effective screening tests for timely diagnosis. Presently, endoscopic examination and gastroscopic biopsy are traditional techniques for GC diagnosis, which are invasive approaches not suitable for the screening of asymptomatic high-risk population, particularly in the large epidemiological investigation.6,7 Therefore, development of GC biomarkers that could be easily measured in body fluids (e.g. plasma, serum, urine or saliva) and that are suitable for large-scale screening high-risk population could significantly reduce the morbidity and mortality caused by GC. However, serum markers for GC in clinical use, such as cancer antigen 72-4 (CA72-4), carcinoembryonic antigen (CEA), cancer antigen 19–9 (CA19-9), and cancer antigen 12–5 (CA12-5), lacked sufficient sensitivity for GC screening or detection.8-10
Previous studies have demonstrated that tumor-associated antigens (TAAs) derive from aberrant gene expression and gene mutation in cancers which could be considered as foreign antigens and subsequently, the corresponding autoantibodies were produced.11 Compared with other potential markers, autoantibodies against TAAs are highly stability and persistence in serum samples of cancer patients and can be detected before the onset of disease symptoms.12 In recent years, autoantibodies against TAAs as early tumor biomarkers in detection of various types of cancer or as indicator of cancer prognosis have been widely explored.13-15 In general, autoantibody against single TAA showed low sensitivity and specificity due to the heterogenic nature of cancer and lacked discriminatory capacities in diagnosing a specific cancer.14,16,17 Using a customized TAAs panel could improve autoantibody detection in cancer immunodiagnosis.3,18,19 However, previous studies in this field had some limitations as following, such as small sample size, failure to construct predictive model or lack of another independent validation cohort.
In this study, we evaluated autoantibodies against 9 TAAs (p53, p62, c-Myc, PTEN, IMP1, p16, 14-3-3ξ, MDM2 and NPM1) using subjects sera from GC patients and healthy controls in the two cohorts. The potential functions of these TAAs were presented in Supplementary Table S1. p53 is a tumor suppressor protein related to apoptosis, transcriptional activation, DNA binding, cell metabolic regulation or autophagy.20,21 Phosphatase and tensin homolog (PTEN) is another powerful tumor suppressor protein which has been known for regulating AKT kinase, downstream cell survival and growth response as well as maintain chromosomal integrity.22,23 IMP1 and p62/IMP2 are members of the insulin-like growth factor II mRNA-binding proteins (IMP1s) which could regulate the translation of insulin-like growth factor II. Studies have implicated that these proteins play an important role in aspects of cell function, such as cell migration, proliferation, metabolism and differentiation.24-26 c-Myc is an oncoprotein which involves in cell progression, apoptosis and cellular transformation.27,28 p16 is a cyclin-dependent kinase inhibitor and regulates cell cycle.29 14-3-3ξ mediates the conformation of enzymatic activity, protein stability and subcellular location of the target protein by binding to target proteins with phosphor-serine/threonine containing motifs.30 Nucleophosmin 1 (NPM1) is a nucleolar phosphoprotein directly involved in cancer pathogenesis, which have a role in the mediation of cell growth, proliferation transformation and ARF/p53 pathway.31 Mouse double minute 2 (MDM2) binds to and inhibits tumor suppressor protein p53 by regulating its location, stability and activity as a transcriptional activator.32
A logistic regression model, which could predict the probability of being diagnosed with GC, was generated based on optical density (OD) values of 9 anti-TAAs autoantibodies in our study and further validated by using an independent cohort.
Materials and methods
Serum samples
Two independent serum samples cohorts (training cohort and validation cohort) were used in this study. The training and validation cohort consisted of 279 and 186GC patients, respectively. Blood samples of 465 GC patients were collected from the First Affiliated Hospital of Zhengzhou University (Zhengzhou, China) from March 2011 to May 2017. Control serum samples from 465 healthy controls in two cohorts, matched to patients by age and sex, were selected from cardiovascular disease survey during August of 2013 to August of 2015 carried out in Henan, China. All GC patients were defined on the basis of gastroscopy and were then confirmed by histopathological diagnosis. All of the healthy controls had no evidence of cancer history and gastric diseases. In addition, a total of 69 serial serum samples from 26GC patients were collected at different time points before and after surgical treatment. All obtained serum samples were centrifuged at 1500 rpm for 10 min and then stored at −80°C until further measurements. This study was reviewed and approved by the Medical Ethics Committee of Zhengzhou University (Zhengzhou, China), and the informed consent forms were obtained from all subjects participating in this study before the samples were collected.
Enzyme-linked immunosorbent assay (ELISA)
The autoantibodies against 9 TAAs in human serum samples were detected by ELISA. In brief, all purified recombinant proteins were individually diluted in coating buffer (50 Mm sodium carbonate/ bicarbonate pH 9.6) to final concentration of 0.5 μg/ml and coated 96-well microliter plates (100 μl/well) overnight at 4°C. After being blocked each well 2% bovine serum albumin (BSA), human serum samples at 1:100 dilutions in 1% BSA were added to antigen-coated wells and plates were for 1 h at 37°C followed by washing five times by phosphate buffered saline (PBS) containing 0.05% Tween 20 (PBST). Then, horseradish peroxidase-rec-protein A (Camarillo, USA) was used as secondary antibody diluted 1:3000 at 37°C for 30 min. After the plates were washed five times with PBST, the solution of 3, 3′,5, 5′-tetramethylbenzidine (TMB)-H2O2-urea was used as detecting reagents. Finally, 50 μl stopping solution (2M H2SO4) was added into each well and the absorbance were obtained at the dual wavelength of 450 and 620 nm by using a microplate reader (Thermo Fisher Scientific). A positive control, a negative control and a blank control were set in each plate to ensure the reliability of serum levels of autoantibodies.
Statistical analysis
Due to the sera autoantibodies against 9 TAAs were not normally distributed (Shapiro Wilk's test), nonparametric Mann-Whitney U tests were used to analyze the differences of autoantibodies levels between two groups. The differences of anti-TAA autoantibodies levels between serum from GC patients before and after surgery were compared by Wilcoxon matched-pairs signed rank test. The x2 tests and Fisher's exact tests were used to compare the differences of frequency between two cohorts. The receiver operating characteristic (ROC) analysis was conducted to assess the diagnostic performance of the single autoantibody or a customized TAAs panel, leading to estimate the area under the curve (AUC) with 95% confidence interval (CI). A forward (conditional) logistic regression model was then constructed to select diagnostic autoantibody markers based on the training cohort. AUCs of different subgroups were compared by using the method of De Long et al. (1988).33 The predicted probability of being diagnosed with GC was used as an alternative index to generate ROC curve. Here, the predicted probability (P = 0.5) was set as cutoff value to distinguish between positive and negative results in the prediction model.
Statistical analyses were done by using SPSS (Version 21.0) and Graphpad Prism 6.0 software. MedCalc (Version 11.4.2.0) software was used to perform the ROC analysis. P values were two-tailed, and less than 0.05 were considered statistically significant.
Results
Characteristics of study participants
In total, 930 participants were included, 558 in the training cohort and 372 in the validation cohort. The detailed characteristics of study individuals in both two cohorts were showed in Table 1. No significant difference was seen in the distribution of age, sex, smoking and drinking between the training and validation cohorts. All of the tumor characteristics (differentiation, tumor size and lymph node number) except TNM stage were similar between the two cohorts. In GC groups, there were more GC patients with early-stage in the validation cohort than in the training cohort (39.2% vs. 35.2%, respectively, P < 0.0001).
Table 1.
Characteristics of gastric cancer patients and controls.
| Variable | Training cohort (N = 558) | Validation cohort (N = 372) | P |
|---|---|---|---|
| Healthy controls | 279 | 186 | |
| Age | 0.896 | ||
| Mean ± SD | 58.7 ± 12.0 | 58.8 ± 11.6 | |
| Range | 28–88 | 23–89 | |
| Sex, n(%) | 0.761 | ||
| Male | 209(74.9) | 137(73.7) | |
| Female | 70(25.1) | 49(26.3) | |
| Smoking, n(%) | |||
| 0 pack/day | 166(59.5) | 103(55.4) | 0.771 |
| <1 pack/day | 38(13.6) | 28(15.0) | |
| ≥1 pack/day | 53(19.0) | 31(16.7) | |
| Unknown | 22(7.9) | 24(21.9) | |
| Drinking, n(%) | 0.086 | ||
| No | 194(69.5) | 117(62.9) | |
| Yes | 81(29.0) | 69(37.1) | |
| Unknown | 4(1.5) | 0(0.0) | |
| Gastric cancers | 279 | 186 | |
| Age | 0.976 | ||
| Mean ± SD | 58.9 ± 12.2 | 58.9 ± 11.7 | |
| Range | 27–89 | 23–94 | |
| Sex, n(%) | |||
| Male | 209(74.9) | 137(73.7) | 0.761 |
| Female | 70(25.1) | 49(26.3) | |
| Smoking, n(%) | |||
| 0 pack/day | 184(65.9) | 128(68.8) | 0.793 |
| <1 pack/day | 21(7.5) | 12(6.5) | |
| ≥1 pack/day | 61(21.9) | 46(24.7) | |
| Unknown | 13(4.7) | 0(0.0) | |
| Drinking, n(%) | |||
| No | 207(74.2) | 152(81.7) | 0.172 |
| Yes | 64(22.9) | 34(18.3) | |
| Unknown | 8(2.9) | 0(0.0) | |
| TNM stage, n(%) | 0.000 | ||
| Stage I | 44(15.8) | 33(17.7) | |
| Stage II | 54(19.4) | 40(21.5) | |
| Stage III | 67(24.0) | 76(40.9) | |
| Stage IV | 43(15.4) | 6(3.2) | |
| Unknown | 71(25.4) | 31(16.7) | |
| Differentiation | 0.548 | ||
| Poor | 100(35.8) | 66(35.5) | |
| Moderate | 102(36.6) | 71(38.2) | |
| High | 5(1.8) | 1(0.5) | |
| Unknown | 72(25.8) | 48(25.8) | |
| Tumor size,n(%) | |||
| <5 cm | 68(24.4) | 65(34.9) | 0.165 |
| ≥5 cm | 50(17.9) | 68(36.6) | |
| Unknown | 161(57.7) | 53(28.5) | |
| Lymph node metastasis, n(%) | |||
| 0 | 61(21.9) | 62(33.2) | 0.229 |
| 1–3 | 41(14.7) | 34(18.3) | |
| 4–9 | 36(12.9) | 28(15.1) | |
| ≥10 | 17(6.1) | 28(15.1) | |
| Unknown | 124(44.4) | 34(18.3) |
GC, gastric cancer; SD, standard deviation
P < 0.0001
Autoantibody levels to TAA in GC patients and healthy controls
All anti-TAA autoantibodies titers of serum samples from GC patients and healthy controls were presented in Fig. 1. In the training cohort, 9 TAAs exhibited significantly higher autoantibody response in GC patients than that in healthy controls (Fig. 1a), similar results were also found in the validation cohort (Fig. 1b).
Figure 1.
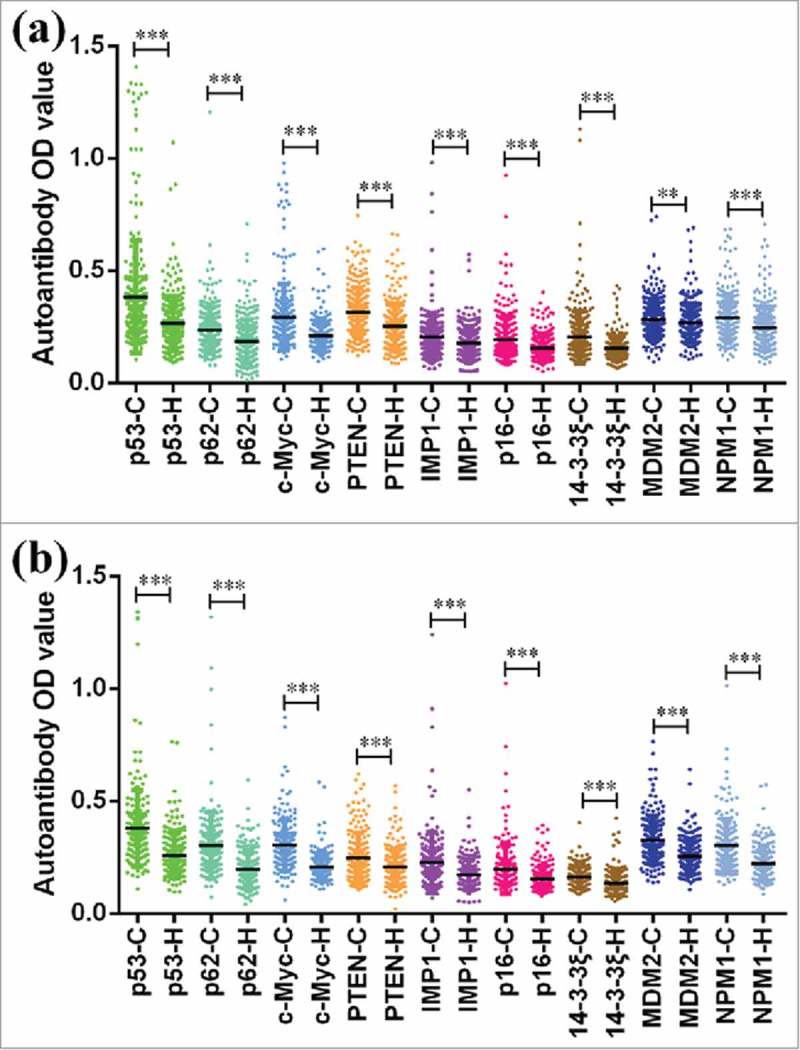
Serum levels of autoantibodies against 9 TAAs in GC patients and healthy controls. a Scatter plots of serum levels of autoantibodies in training cohort with 279 GC patients and 279 healthy controls. b Scatter plots of serum levels of autoantibodies in validation cohort with 186 GC patients and 186 healthy controls. C cancer, H healthy. **P < 0.01, ***P < 0.001.
Diagnostic performance of single autoantibody
To evaluate the potential serum autoantibodies as noninvasive biomarkers for the immunodiagnosis of GC, the purified recombinant proteins were used as coating antigen for detection of corresponding autoantibodies in the sera samples from 279 GC patients and 279 healthy controls in the training cohort. The diagnostic performance of single autoantibody in the training cohort was presented in Supplementary Fig. 1. Although GC patients could be distinguished from healthy controls in the training cohort, autoantibody against single TAA showed poor diagnostic accuracy. The AUCs ranged from 0.570 to 0.738. Anti-c-Myc autoantibodies showed the highest diagnostic performance for GC with AUC of 0.738 (95%CI: 0.700–0.774), sensitivity of 61.65% and specificity of 74.91% among 9 TAAs (Supplementary Fig. 1c).
Establishing the predictive TAA panel
A forward (conditional) logistic regression model was established to estimate the risk of being diagnosed with GC based on the training cohort (279 GC patients and 279 age- and sex-matched cancer-free healthy controls). Finally, autoantibodies against 6 TAAs (p62,c-Myc, NPM1, 14-3-3ξ, MDM2 and p16) were included into this model. The predicted probability of being diagnosed with GC from the model based on the autoantibodies against 6 TAAs, PRE (P = GC) = 1/(1+EXP(−(−3.001+6.976 × p62+9.851 × c-Myc-10.889 × NPM1+11.455 × 14-3-3ξ-3.718 × MDM2+ 5.532 × p16))), was used to constructed ROC curves. The diagnostic accuracy for the established TAA panel was estimated by ROC curve analysis. The cut-off value distinguishing from GC patients and healthy controls was defined as P = 0.5. In the training cohort, ROC analysis indicated that this model could distinguish GC patients from healthy controls with AUC of 0.841 (95%CI: 0.808–0.871), sensitivity of 78.14% and specificity of 78.85% (Fig. 2a). Further analysis revealed that the percentage of subjects being correctly classified was 78.49% when used this model.
Figure 2.
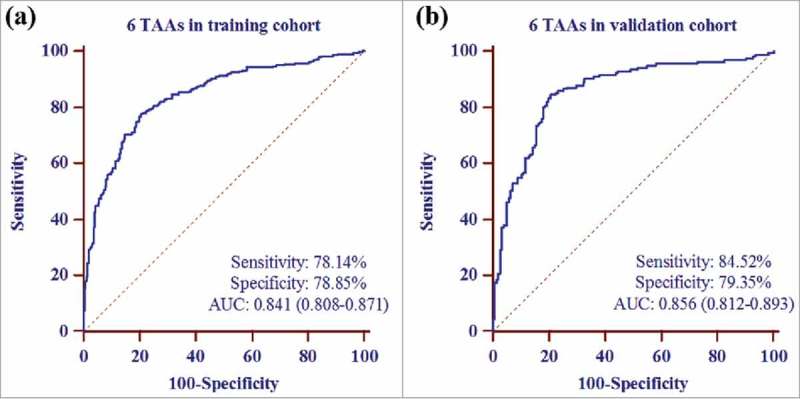
Receiver operating characteristic curve analysis of the prediction model with TAA panel in GC detection. a The prediction model with 6 TAAs (p62, c-Myc, NPM1, 14-3-3ξ, MDM2 and p16) in training cohort. b The prediction model with 6 TAAs in validation cohort.
Validating the prediction model
The results from the training cohort were used to predict the probability of being diagnosed with GC for another independent validation cohort (186GC patients and 186 cancer-free healthy controls). Similarly, the predicted probability was also used to generate ROC curve analysis. In the validation cohort, the AUC of the prediction model with 6 TAAs was 0.856 (95%CI: 0.812–0.893) with sensitivity of 84.52% and specificity of 79.35%, and 81.99% subjects were correctly classified (Fig. 2b).
Diagnostic value of the prediction model in early-stage GC detection
When GC patients were confined to the early-stage (stage I – II) GC detection, the prediction model with 6 TAAs presented an AUC of 0.826 (95%CI: 0.764–0.877) with sensitivity of 76.60%, specificity of 72.34%, Youden's index (YI) of 0.49, positive predictive value (PPV) of 73.5%, negative predictive value (NPV) of 75.6% and accuracy of 74.49% in the training cohort ( Fig. 3a, Table 2 ) and an AUC of 0.843 (95%CI: 0.773–0.898) with sensitivity, specificity, YI, PPV, NPV and accuracy of 80.56%, 79.17%, 0.60, 79.5%, 80.3%, and 80.14%, respectively, in the validation cohort (Fig. 3c, Table 2). When the two cohorts were combined, this model for all early-stage GC yielded an AUC of 0.834 (95%CI: 0.790–0.873, sensitivity = 78.92%, specificity = 74.70%, YI = 0.53, PPV = 75.7%, NPV = 78.0% and accuracy = 76.90%) (Fig. 3e, Table 2).
Figure 3.
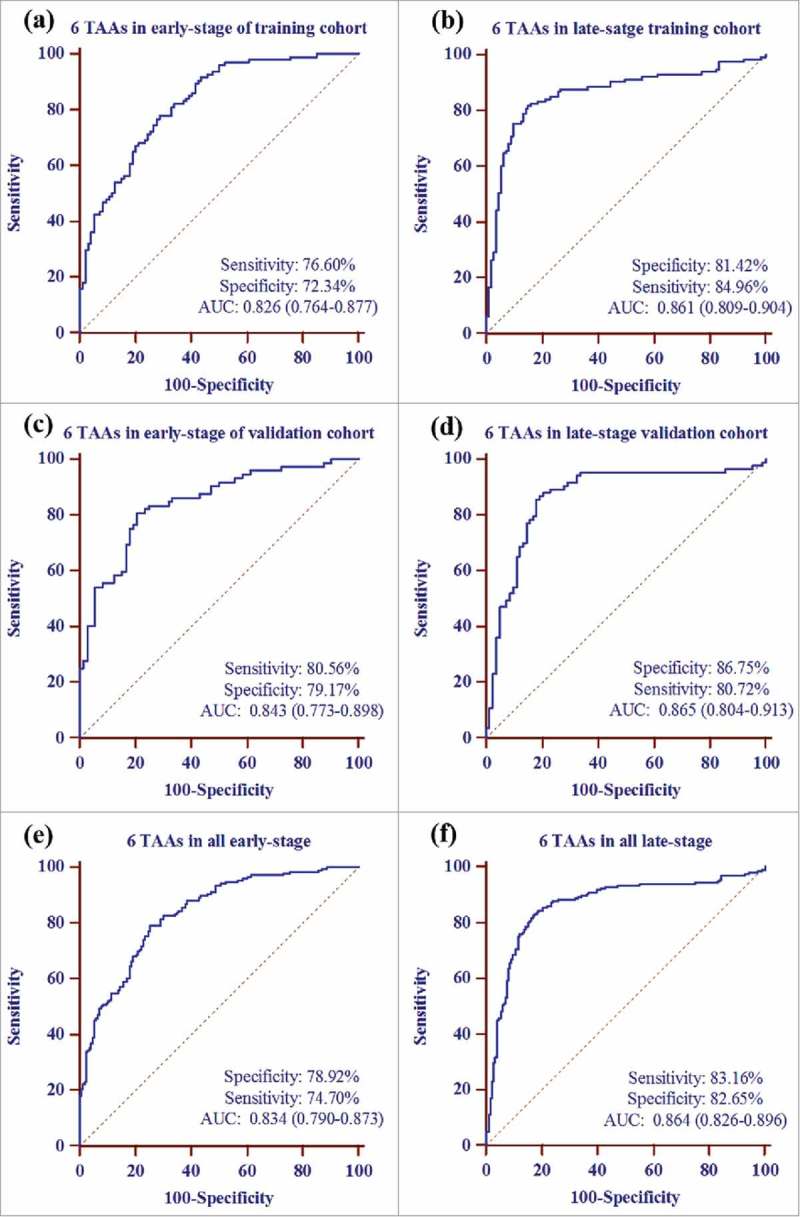
Receiver operating characteristic curve analysis of prediction model with TAA panel in early and late stage of GC detection. a the prediction model with 6 TAAs (p62, c-Myc, NPM1, 14-3-3ξ, MDM2 and p16) for early-stage GC detection in training cohort. b the prediction model with 6 TAAs for late-stage GC detection in training cohort. c the prediction model with 6 TAAs for early-stage GC detection in validation cohort. d the prediction model with 6 TAAs for late-stage GC detection in validation cohort. e the prediction model with 6 TAAs for overall early-stage GC detection. f the prediction model with 6 TAAs for overall late-stage GC detection.
Table 2.
Diagnostic value of prediction model with 6 TAAs panel for different stage of GC.
| Group | N | AUC (95%CI) | P | P | TPR(%) | FPR(%) | YI | +LR | −LR | PPV(%) | NPV(%) | Accuracy(%) |
|---|---|---|---|---|---|---|---|---|---|---|---|---|
| Training cohort | ||||||||||||
| Early-stage (I-II) | 98 | 0.826 (0.764–0.877) | 0.377 | <0.0001 | 76.60 | 27.66 | 0.49 | 2.77 | 0.32 | 73.5 | 75.6 | 74.49 |
| Late-stage (III-IV) | 110 | 0.861 (0.809–0.904) | <0.0001 | 81.42 | 15.04 | 0.66 | 5.41 | 0.22 | 84.4 | 82.1 | 83.18 | |
| Normal | 279 | — | — | — | — | — | — | — | — | — | — | |
| Validation cohort | ||||||||||||
| Early-stage (I-II) | 73 | 0.843 (0.773–0.898) | 0.625 | <0.0001 | 80.56 | 20.83 | 0.60 | 3.87 | 0.25 | 79.5 | 80.3 | 80.14 |
| Late-stage (III-IV) | 82 | 0.865 (0.804–0.913) | <0.0001 | 86.75 | 19.28 | 0.67 | 4.50 | 0.16 | 81.8 | 85.9 | 83.54 | |
| Normal | 186 | — | — | — | — | — | — | — | — | — | — | |
| All early-stage | 171 | 0.834 (0.790–0.873) | 0.309 | <0.0001 | 78.92 | 25.30 | 0.53 | 3.12 | 0.28 | 75.7 | 78.0 | 76.90 |
| All late-stage | 192 | 0.864 (0.826–0.896) | <0.0001 | 83.16 | 17.35 | 0.66 | 4.79 | 0.20 | 82.7 | 83.1 | 83.07 | |
| Normal | 465 | — | — | — | — | — | — | — | — | — | — |
P means comparison between early-stage and late-stage with the method of De Long et al. (1988);
P value is relative to normal controls.
6 TAAs: p62,c-Myc, NPM1, 14-3-3ξ, MDM2 and p16; AUC: area under the receiver operating characteristic curve; CI: confidence interval; TPR: true-positive rate; FPR: false-positive rate; YI: Youden's index; +LR: positive likelihood ration; −LR: negative likelihood ration; PPV: positive predictive value; NPV: negative predictive value.
For late-stage (stage III – IV) GC detection in this study, this prediction model showed an AUC of 0.861 (95%CI: 0.809–0.904), a sensitivity of 81.42%, a specificity of 84.96%, a YI of 0.66, a PPV of 84.4%, a NPV of 82.1% and an accuracy of 83.18% in the training cohort (Fig. 3b, Table 2) and an AUC of 0.865 (95%CI: 0.804–0.913), a sensitivity of 86.75%, a specificity of 80.72%, a YI of 0.67, a PPV of 81.8%, a NPV of 85.9% and an accuracy of 83.54% in the validation cohort (Fig. 3d, Table 2). For all late-stage GC patient detection, this prediction model showed an AUC 0.864 (95%CI: 0.826–0.896) with sensitivity of 83.16%, specificity of 82.65% and accuracy of 83.07% (Fig. 3f, Table 2).
The comparative results of diagnostic power of the prediction model with 6 TAAs for different TNM stage of GC were exhibited in Table 3. In the training cohort, 67.34% (66/98) early-stage and 70.00% (77/110) late-stage GC patients were correctly defined by this prediction model. However, there was no significant difference between different TNM stages of GC patients for the diagnostic performance (P = 0.680). In the validation cohort, 75.34% (55/73) early-stage and 78.31% (65/82) late-stage GC patients were correctly defined. The positive rate for early-stage and late-stage GC patients presented no significant difference (P = 0.560).
Table 3.
Comparison of diagnostic power of the prediction model with 6TAAs for different stage of GC.
| Training cohort |
Validation cohort |
|||||
|---|---|---|---|---|---|---|
| Stage | N | Positive (%) | P | N | Positive (%) | P |
| Early-stage(I-II) | 98 | 66 (67.34) | 0.680 | 73 | 55 (75.34) | 0.560 |
| Late-stage (III-IV) | 110 | 77 (70.00) | 82 | 65 (78.31) | ||
6 TAAs: p62,c-Myc, NPM1, 14-3-3ξ, MDM2 and p16.
Evaluation of autoantibodies to TAAs levels in GC patients before and after surgical treatment
Serial serum samples drawn before and after surgery were analyzed to explore whether surgical treatment affects the autoimmune response in GC. The serum levels of against 9 TAAs from 26 GC patients (69 serial serum samples) before and after surgery was showed in Fig. 4. Of 26 GC patients from whom 33 serial serum samples were collected before surgical treatment, 36 serial serum samples from the same patients were drawn after radical total gastrectomy (mean: 78 days, range: 6–227 days). If each GC patient had more than one serum sample before and after surgery, the average OD value was used to describe autoantibody levels. The OD value of 5 autoantibodies (p62, c-Myc, IMP1, 14-3-3ξ and NPM1) in sera from GC patients after surgery were significantly higher than that before surgery (all P < 0.05). However, anti-p53, anti-PTEN, anti-p16, anti-MDM2 autoantibodies showed no significant difference before and after surgery (all P > 0.05).
Figure 4.
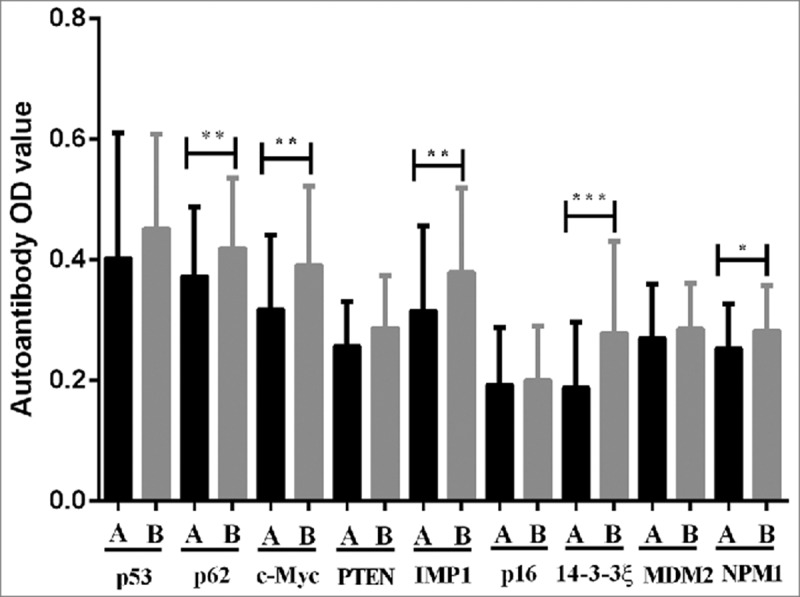
Comparison of autoantibodies serum levels to 9 TAAs in serial serum samples before and after surgery for GC patients. A before surgery, B after surgery. *P < 0.05, **P < 0.01.
Discussion
At present, the diagnostic techniques of GC are divided into two categories: imaging and biomarker detections. However, the diagnostic performance of these procedures are not satisfactory, practically for the early-stage GC. Most patients with early-stage GC are asymptomatic and, therefore, they are frequently diagnosed at late-stage.2 Therefore, it is necessary to identify novel serum or plasma biomarkers for the noninvasive diagnosis of GC. Using autoantibodies against TAAs as biomarkers in cancer immunodiagnosis has attracted more attention. This attention derives from the concept that these anti-TAA antibodies might be considered as “sensors” or “reporters” of molecular events associated with tumorigenesis.13 Many studies have demonstrated that serological autoantibodies against TAAs could serve as potential biomarkers for detection of cancer which can be easily detected in sera obtained with minimally invasive blood sampling.34-36
In this study, serum levels of autoantibodies against 9 TAAs (p53, p62, c-Myc, PTEN, IMP1, p16, 14-3-3ξ, MDM2 and NPM1) were measured by ELISA in two cohorts. The mean OD values of 9 anti-TAAs autoantibodies in serum samples from GC patients were significantly higher than in serum samples from healthy controls. It implied that autoantibodies to these 9 TAAs may serve as potential serological biomarker for GC detection. Generally, single autoantibody showed relatively low diagnostic performance for GC. Antibody frequency to NY-ESO-1 were 3.4%, 4.4%, 25.3% and 20% in GC patients with stage I, II, III and IV, respectively.37 Werner et al. reported that the sensitivity of single autoantibodies in the detection of GC ranged from 0 to 12%.38 Moreover, the prevalence of autoantibody against the 78 kDa glucose-regulated protein (GRP78) was 28.3% (17/60) in GC patients and also can be found in 26.7% and 20.0% patients with esophageal and colon cancer, respectively.39 In our study, the diagnostic performance of single autoantibody against single TAA was relatively low, with AUCs ranged from 0.570 to 0.738 in the training cohort.
Combinational utilization of multiple autoantibodies may provide a promising approach to improve the diagnostic accuracy for cancers. Many studies revealed that different types of cancer may require different anti-TAA autoantibodies profiles to achieve sufficient sensitivity and specificity for distinguishing cancer patients and normal individuals.13,40-42 Yang et al. revealed that a panel of 4 TAAs (COPS2, CTSF, NT5E and TERF1) provided promising diagnostic performance for the distinguishing GC patients from controls with 95% sensitivity and 92% specificity.5 However, it was not further validated by other independent samples. A recent study reported that an array with 45-autoantibody signature was capable of discriminating from GC and healthy, GC and peptic ulcer as well as GC and gastritis with AUC of 0.79 (58.7% sensitivity and 89.7% specificity), 0.76 (58.7% sensitivity and 81.5% specificity) and 0.64 (58.7% sensitivity and 55.0% specificity), respectively, in the validation set.3 Hoshino et al. showed that array of 6 TAAs (p53, HSP70, HCC-22-5, Prx VI, KM-HN-1 and p90) yielded sensitivity/specificity of 49.0%/92.4% and 52.0%/90.5% for GC diagnosis in the test and validation cohorts, respectively.43 Another study reported that a combination of autoantibodies against 5 TAAs (MAGEA4, CTAG1, TP53, ERBB2_C and SDCCAG8) could detect 32% GC patients at a specificity of 87% in the validation set.38 However, these three studies failed to construct prediction model of GC and, therefore, they did not show which TAA was more closely related to the occurrence of GC. In this study, a logistic regression model was constructed to predict the risk of being diagnosed with GC based on the serum levels of anti-TAAs autoantibody from the training cohort. The prediction model with 6 anti-TAA autoantibodies (p62,c-Myc, NPM1, 14-3-3ξ, MDM2 and p16) manifested optimal diagnostic performance in the training cohort. Furthermore, we validated this prediction model by using another independent cohort. The similar results were also found in the validation.
Specificity and sensitivity are highly affected by the selection of cutoff value. Many studies determining the positive threshold generally used mean + 3 standard deviation (SD) or 2 SD of the OD value in the control group as cutoff value, which results in very high specificity and relatively low sensitivity. In contrast to sensitivity and specificity, the AUC curve is an independent approach of the choice of cutoff value.44 This index highly facilitates comparison of the discriminatory capacities between different biomarkers and makes it more accurate for screening purposes.19,45 In this study, the AUC was used to evaluate the diagnostic performance of the prediction model with 6 TAAs. The predicted probability was set as P = 0.5 to designate positive and negative results for the prediction model. The AUC of this prediction model was 0.841 (95%CI: 0.808–0.871; sensitivity = 78.14%, specificity = 78.85%) in the training cohort and 0.856 (95%CI: 0.812–0.893; sensitivity = 84.52%, specificity = 79.35%) in the validation cohort. However, no significant difference was seen for the diagnostic value between two cohorts (P = 0.591).
In order to explore the diagnostic performance of the prediction model for GC patients with different TNM stage, GC patients were categorised into early-stage (stage I – II) and late-stage (stage III – IV) subgroups. We found that there were no significant difference for the diagnostic performance of this model between two subgroups in both training and validation cohorts (all P > 0.05). GC patients with late-stage seem to have higher positive rate for the TAAs panel than in early-stage, which may be partially attributed to a large number of stage III – IV patients in this two cohorts. The prediction model with 6 TAAs for early-stage showed sensitivity/specificity of 76.60%/72.43% and 80.56%/ 79.17% in the training cohort and validation cohort, respectively. The percentages of subjects being correctly defined were 74.49% and 80.14% for GC patients with early-stage in the training cohort and validation cohort, respectively. Furthermore, this prediction model for all early-stage showed sensitivity/specificity of 78.92%/74.70%, and 76.90% subjects were correctly defined.
To investigate whether the surgical removal of tumors can have an impact the dynamic change of anti-TAA autoantibodies, we compared the levels of autoantibodies to 9 TAAs in serial serum samples obtained at different time points before and after surgery in GC patients. Detection of anti-TAA autoantibodies in these serial serum samples from the patients with surgery might reflect the autoimmune responses to the absence of the tumor after surgical treatment. Interestingly, levels of 5 anti-TAAs autoantibodies (p62, c-Myc, IMP1, 14-3-3ξ and NPM1) in sera from GC patients after surgery treatment was significantly higher than that before surgery (all P<0.05). Similarly, Dai et al. reported that anti-NPMI antibody levels in prostate cancer patients significantly increased after surgical treatment.46 It has been hypothesized that changes in antibody levels might reflect change in tumor status or tumor burden related to therapy.11 However, the underlying biological mechanism regarding this observation is not completely understood. Previous study revealed that patients with large size of tumor are frequently immunosuppressed, and the surgical removal of tumor could reverse immune suppression owing to it reduces the quantity of tumor-related immunosuppressed factors, thereby allowing immune response to recover in the absence of the inhibitory cytokines.47 However, autoantibodies against p53, PTEN, p16, MDM2 presented no significant difference before and after surgery.
There are some strengths and limitations in this study, which should be considered. First, the logistic regression model was generated to estimate the risk of being diagnosed with GC and then validated by an independent cohort. Furthermore, a large sample size with 930 (558 in training cohort and 372 in validation cohort) samples was detected in this study. It is well known that the pathogenesis of GC is heterogeneous and that multiple mechanisms of the tumorigenesis (tumor suppressor genes, oncogenes, viral effects, and angiogenesis, etc.) could be involved. We further speculated that, similar to the HBV-related hepatocellular carcinoma, the disease progression of most GC patients could experience three stages as follows: healthy, gastritis and GC. Due to its long-term incubation period, aberrant antigenic changes of cellular proteins might occur during any of the stages (gastritis and GC I, II, III, IV) before the clinical/pathophysiological manifestation of GC. However, our study did not include individuals with precancerous lesions such as gastritis, gastric ulcer and polyp, etc. Therefore, further studies will be needed to pay more attention on this topic.
In summary, we found a panel of anti-TAAs autoantibodies can be used to distinguish GC patients from healthy individuals with a high degree of diagnostic performance. This study further supports the hypothesis that a customized array of multiple TAAs could enhance autoantibodies detection in the immunodiagnosis of cancer. The logistic regression model with 6 TAAs conducted in the present study is a promising way for the GC detection, particularly for early-stage GC.
Supplementary Material
Funding Statement
This study was supported by Grants from the Major Project of Science and Technology in Henan Province (No. 16110311400), the General Program of National Natural Science Foundation of China (No. 81372371) and Zhongyuan Scholars Program of Henan Province (No. 162101510006).
Abbreviations
- AFP
alfa fetoprotein
- AUC
area under the receiver operating characteristic curve
- BSA
bovine serum albumin
- CA72-4
carbohydrate antibody 72–4
- CA19-9
carbohydrate antibody 19–9
- CA12-5
carbohydrate antibody 12–5
- CEA
carbohydrate antibody
- CI
confidence interval
- ELISA
enzyme-linked immunosorbent assay
- GC
gastric cancer
- +LR
positive likelihood ration
- −LR
negative likelihood ration
- NPV
negative predictive value
- OD
optical density
- PBS
phosphate buffered saline
- PPV
positive predictive value
- ROC
receiver operating characteristic
- SD
standard deviation.
- TAAs
tumor-associated antigens
- TMB
3, 3′,5, 5′-tetramethylbenzidine
- YI
Youden's index
Disclosure of potential conflicts of interest
No potential conflicts of interest were disclosed.
References
- 1.Ferlay J, Soerjomataram I, Dikshit R, Eser S, Mathers C, Rebelo M, Parkin DM, Forman D, Bray F. Cancer incidence and mortality worldwide: sources, methods and major patterns in GLOBOCAN 2012. Int J Cancer. 2015;136(5):E359-86. doi: 10.1002/ijc.29210. PMID:25220842. [DOI] [PubMed] [Google Scholar]
- 2.Van Cutsem E, Sagaert X, Topal B, Haustermans K, Prenen H. Gastric cancer. Lancet. 2016;388(10060):2654–64. doi: 10.1016/S0140-6736(16)30354-3. PMID:27156933. [DOI] [PubMed] [Google Scholar]
- 3.Zayakin P, Ancans G, Silina K, Meistere I, Kalnina Z, Andrejeva D, Endzelins E, Ivanova L, Pismennaja A, Ruskule A, et al.. Tumor-associated autoantibody signature for the early detection of gastric cancer. Int J Cancer. 2013;132(1):137–47. doi: 10.1002/ijc.27667. PMID:22684876. [DOI] [PubMed] [Google Scholar]
- 4.Rosati G, Ferrara D, Manzione L. New perspectives in the treatment of advanced or metastatic gastric cancer. World J Gastroenterol. 2009;15(22):2689–92. doi: 10.3748/wjg.15.2689. PMID:19522017.26598640 [DOI] [PMC free article] [PubMed] [Google Scholar]
- 5.Yang L, Wang J, Li J, Zhang H, Guo S, Yan M, Zhu Z, Lan B, Ding Y, Xu M, et al.. Identification of Serum biomarkers for gastric cancer diagnosis using a human proteome microarray. Mol Cell Proteomics. 2016;15(2):614–23. doi: 10.1074/mcp.M115.051250. PMID:26598640. [DOI] [PMC free article] [PubMed] [Google Scholar]
- 6.Leung WK, Wu MS, Kakugawa Y, Kim JJ, Yeoh KG, Goh KL, Wu KC, Wu DC, Sollano J, Kachintorn U, et al.. Screening for gastric cancer in Asia: current evidence and practice. Lancet Oncol. 2008;9(3):279–87. doi: 10.1016/S1470-2045(08)70072-X. PMID:18308253. [DOI] [PubMed] [Google Scholar]
- 7.Dan YY, So JB, Yeoh KG. Endoscopic screening for gastric cancer. Clin Gastroenterol Hepatol. 2006;4(6):709–16. doi: 10.1016/j.cgh.2006.03.025. PMID:16765306.21892754 [DOI] [PubMed] [Google Scholar]
- 8.Emoto S, Ishigami H, Yamashita H, Yamaguchi H, Kaisaki S, Kitayama J. Clinical significance of CA125 and CA72-4 in gastric cancer with peritoneal dissemination. Gastric Cancer. 2012;15(2):154–61. doi: 10.1007/s10120-011-0091-8. PMID:21892754. [DOI] [PubMed] [Google Scholar]
- 9.Kim DH, Oh SJ, Oh CA, Choi MG, Noh JH, Sohn TS, Bae JM, Kim S. The relationships between perioperative CEA, CA 19-9, and CA 72-4 and recurrence in gastric cancer patients after curative radical gastrectomy. J Surg Oncol. 2011;104(6):585–91. doi: 10.1002/jso.21919. PMID:21695697. [DOI] [PubMed] [Google Scholar]
- 10.Feng F, Tian Y, Xu G, Liu Z, Liu S, Zheng G, Guo M, Lian X, Fan D, Zhang H. Diagnostic and prognostic value of CEA, CA19-9, AFP and CA125 for early gastric cancer. Bmc Cancer. 2017;17(1):737. doi: 10.1186/s12885-017-3738-y. PMID:29121872. [DOI] [PMC free article] [PubMed] [Google Scholar]
- 11.Tan EM, Zhang J. Autoantibodies to tumor-associated antigens: reporters from the immune system. Immunol Rev. 2008;222(1):328–40. doi: 10.1111/j.1600-065X.2008.00611.x. PMID:18364012. [DOI] [PMC free article] [PubMed] [Google Scholar]
- 12.Liu W, Peng B, Lu Y, Xu W, Qian W, Zhang JY. Autoantibodies to tumor-associated antigens as biomarkers in cancer immunodiagnosis. Autoimmun Rev. 2011;10(6):331–5. doi: 10.1016/j.autrev.2010.12.002. PMID:21167321.28638733 [DOI] [PMC free article] [PubMed] [Google Scholar]
- 13.Zhang JY, Tan EM. Autoantibodies to tumor-associated antigens as diagnostic biomarkers in hepatocellular carcinoma and other solid tumors. Expert Rev Mol Diagn. 2010;10(3):321–8. doi: 10.1586/erm.10.12. PMID:20370589.28638733 [DOI] [PMC free article] [PubMed] [Google Scholar]
- 14.Dai L, Li J, Tsay JJ, Yie TA, Munger JS, Pass H, Rom WN, Tan EM, Zhang JY. Identification of autoantibodies to ECH1 and HNRNPA2B1 as potential biomarkers in the early detection of lung cancer. Oncoimmunology. 2017;6(5):e1310359. doi: 10.1080/2162402X.2017.1310359. PMID:28638733. [DOI] [PMC free article] [PubMed] [Google Scholar]
- 15.Katchman BA, Chowell D, Wallstrom G, Vitonis AF, LaBaer J, Cramer DW, Anderson KS. Autoantibody biomarkers for the detection of serous ovarian cancer. Gynecol Oncol. 2017;146(1):129–36. doi: 10.1016/j.ygyno.2017.04.005. PMID:28427776.19860826 [DOI] [PMC free article] [PubMed] [Google Scholar]
- 16.Tan HT, Low J, Lim SG, Chung MC. Serum autoantibodies as biomarkers for early cancer detection. Febs J. 2009;276(23):6880–904. doi: 10.1111/j.1742-4658.2009.07396.x. PMID:19860826. [DOI] [PubMed] [Google Scholar]
- 17.Zaenker P, Ziman MR. Serologic autoantibodies as diagnostic cancer biomarkers-a review. Cancer Epidemiol Biomarkers Prev. 2013;22(12):2161–81. doi: 10.1158/1055-9965.EPI-13-0621. PMID:24057574. [DOI] [PubMed] [Google Scholar]
- 18.Dai L, Tsay JC, Li J, Yie TA, Munger JS, Pass H, Rom WN, Zhang Y, Tan EM, Zhang JY. Autoantibodies against tumor-associated antigens in the early detection of lung cancer. Lung Cancer. 2016;99:172–9. doi: 10.1016/j.lungcan.2016.07.018. PMID:27565936.27553002 [DOI] [PubMed] [Google Scholar]
- 19.Zhang HF, Qin JJ, Ren PF, Shi JX, Xia JF, Ye H, Wang P, Song CH, Wang KJ, Zhang JY. A panel of autoantibodies against multiple tumor-associated antigens in the immunodiagnosis of esophageal squamous cell cancer. Cancer Immunol Immunother. 2016;65(10):1233–42. doi: 10.1007/s00262-016-1886-6. PMID:27553002. [DOI] [PMC free article] [PubMed] [Google Scholar]
- 20.Kruse JP, Gu W. Modes of p53 regulation. Cell. 2009;137(4):609–22. doi: 10.1016/j.cell.2009.04.050. PMID:19450511.23263379 [DOI] [PMC free article] [PubMed] [Google Scholar]
- 21.Muller PAJ, Vousden KH. p53 mutations in cancer. Nat Cell Biol. 2013;15(1):2–8. doi: 10.1038/ncb2641. PMID:23263379. [DOI] [PubMed] [Google Scholar]
- 22.Gong L, Govan JM, Evans EB, Dai H, Wang E, Lee S, Lin H, Lazar AJ, Mills GB, Lin S. Nuclear PTEN tumor-suppressor functions through maintaining heterochromatin structure. Cell Cycle. 2015;14(14):2323–32. doi: 10.1080/15384101.2015.1044174. PMID:25946202. [DOI] [PMC free article] [PubMed] [Google Scholar]
- 23.Shen WH, Balajee AS, Wang J, Wu H, Eng C, Pandolfi PP, Yin Y. Essential role for nuclear PTEN in maintaining chromosomal integrity. Cell. 2007;128(1):157–70. doi: 10.1016/j.cell.2006.11.042. PMID:17218262.23069990 [DOI] [PubMed] [Google Scholar]
- 24.Bell JL, Wachter K, Muhleck B, Pazaitis N, Kohn M, Lederer M, Huttelmaier S. Insulin-like growth factor 2 mRNA-binding proteins (IGF2BPs): post-transcriptional drivers of cancer progression? Cell Mol Life Sci. 2013;70(15):2657–75. doi: 10.1007/s00018-012-1186-z. PMID:23069990. [DOI] [PMC free article] [PubMed] [Google Scholar]
- 25.Nielsen J, Christiansen J, Lykke-Andersen J, Johnsen AH, Wewer UM, Nielsen FC. A family of insulin-like growth factor II mRNA-binding proteins represses translation in late development. Mol Cell Biol. 1999;19(2):1262–70. doi: 10.1128/MCB.19.2.1262. PMID:9891060.23069990 [DOI] [PMC free article] [PubMed] [Google Scholar]
- 26.Bell JL, Wachter K, Muhleck B, Pazaitis N, Kohn M, Lederer M, Huttelmaier S. Insulin-like growth factor 2 mRNA-binding proteins (IGF2BPs): post-transcriptional drivers of cancer progression? Cell Mol Life Sci. 2013;70(15):2657–75. doi: 10.1007/s00018-012-1186-z. PMID:23069990. [DOI] [PMC free article] [PubMed] [Google Scholar]
- 27.Dang CV. c-Myc target genes involved in cell growth, apoptosis, and metabolism. Mol Cell Biol. 1999;19(1):1–11. doi: 10.1128/MCB.19.1.1. PMID:9858526.22464321 [DOI] [PMC free article] [PubMed] [Google Scholar]
- 28.Dang CV. MYC on the path to cancer. Cell. 2012;149(1):22–35. doi: 10.1016/j.cell.2012.03.003. PMID:22464321. [DOI] [PMC free article] [PubMed] [Google Scholar]
- 29.Rayess H, Wang MB, Srivatsan ES. Cellular senescence and tumor suppressor gene p16. Int J Cancer. 2012;130(8):1715–25. doi: 10.1002/ijc.27316. PMID:22025288. [DOI] [PMC free article] [PubMed] [Google Scholar]
- 30.Joshi S, Yang J, Wang Q, Li P, Wang H, Zhang Q, Xiong Y, Pickering BF, Parker-Thornburg J, Behringer RR, et al.. 14-3-3zeta loss impedes oncogene-induced mammary tumorigenesis and metastasis by attenuating oncogenic signaling. Am J Cancer Res. 2017;7(8):1654–64. PMID:28861322. [PMC free article] [PubMed] [Google Scholar]
- 31.Grisendi S, Mecucci C, Falini B, Pandolfi PP. Nucleophosmin and cancer. Nat Rev Cancer. 2006;6(7):493–505. doi: 10.1038/nrc1885. PMID:16794633. [DOI] [PubMed] [Google Scholar]
- 32.Bond GL, Hu W, Bond EE, Robins H, Lutzker SG, Arva NC, Bargonetti J, Bartel F, Taubert H, Wuerl P, et al.. A single nucleotide polymorphism in the MDM2 promoter attenuates the p53 tumor suppressor pathway and accelerates tumor formation in humans. Cell. 2004;119(5):591–602. doi: 10.1016/j.cell.2004.11.022. PMID:15550242.3203132 [DOI] [PubMed] [Google Scholar]
- 33.DeLong ER, DeLong DM, Clarke-Pearson DL. Comparing the areas under two or more correlated receiver operating characteristic curves: a nonparametric approach. Biometrics. 1988;44(3):837–45. doi: 10.2307/2531595. PMID:3203132. [DOI] [PubMed] [Google Scholar]
- 34.Fortner RT, Damms-Machado A, Kaaks R. Systematic review: Tumor-associated antigen autoantibodies and ovarian cancer early detection. Gynecol Oncol. 2017;147(2):465–80. doi: 10.1016/j.ygyno.2017.07.138. PMID:28800944.27769114 [DOI] [PubMed] [Google Scholar]
- 35.Broodman I, Lindemans J, van Sten J, Bischoff R, Luider T. Serum protein markers for the early detection of lung cancer: A focus on autoantibodies. J Proteome Res. 2017;16(1):3–13. doi: 10.1021/acs.jproteome.6b00559. PMID:27769114. [DOI] [PubMed] [Google Scholar]
- 36.Dai L, Ren P, Liu M, Imai H, Tan EM, Zhang JY. Using immunomic approach to enhance tumor-associated autoantibody detection in diagnosis of hepatocellular carcinoma. Clin Immunol. 2014;152(1-2):127–39. doi: 10.1016/j.clim.2014.03.007. PMID:24667685.23403818 [DOI] [PMC free article] [PubMed] [Google Scholar]
- 37.Fujiwara S, Wada H, Kawada J, Kawabata R, Takahashi T, Fujita J, Hirao T, Shibata K, Makari Y, Iijima S, et al.. NY-ESO-1 antibody as a novel tumour marker of gastric cancer. Br J Cancer. 2013;108(5):1119–25. doi: 10.1038/bjc.2013.51. PMID:23403818. [DOI] [PMC free article] [PubMed] [Google Scholar]
- 38.Werner S, Chen H, Butt J, Michel A, Knebel P, Holleczek B, Zornig I, Eichmuller SB, Jager D, Pawlita M, et al.. Evaluation of the diagnostic value of 64 simultaneously measured autoantibodies for early detection of gastric cancer. Sci Rep. 2016;6:25467. doi: 10.1038/srep25467. PMID:27140836. [DOI] [PMC free article] [PubMed] [Google Scholar]
- 39.Tsunemi S, Nakanishi T, Fujita Y, Bouras G, Miyamoto Y, Miyamoto A, Nomura E, Takubo T, Tanigawa N. Proteomics-based identification of a tumor-associated antigen and its corresponding autoantibody in gastric cancer. Oncol Rep. 2010;23(4):949–56. doi: 10.3892/or_00000719. PMID:20204278. [DOI] [PubMed] [Google Scholar]
- 40.Zhang JY. Mini-array of multiple tumor-associated antigens to enhance autoantibody detection for immunodiagnosis of hepatocellular carcinoma. Autoimmun Rev. 2007;6(3):143–8. doi: 10.1016/j.autrev.2006.09.009. PMID:17289549.28064445 [DOI] [PMC free article] [PubMed] [Google Scholar]
- 41.Katchman BA, Chowell D, Wallstrom G, Vitonis AF, LaBaer J, Cramer DW, Anderson KS. Autoantibody biomarkers for the detection of serous ovarian cancer. Gynecol Oncol. 2017;146(1):129–36. doi: 10.1016/j.ygyno.2017.04.005. PMID:28427776.28064445 [DOI] [PMC free article] [PubMed] [Google Scholar]
- 42.Barderas R, Babel I, Diaz-Uriarte R, Moreno V, Suarez A, Bonilla F, Villar-Vazquez R, Capella G, Casal JI. An optimized predictor panel for colorectal cancer diagnosis based on the combination of tumor-associated antigens obtained from protein and phage microarrays. J Proteomics. 2012;75(15):4647–55. doi: 10.1016/j.jprot.2012.03.004. PMID:22465712.28064445 [DOI] [PubMed] [Google Scholar]
- 43.Hoshino I, Nagata M, Takiguchi N, Nabeya Y, Ikeda A, Yokoi S, Kuwajima A, Tagawa M, Matsushita K, Satoshi Y, et al.. Panel of autoantibodies against multiple tumor-associated antigens for detecting gastric cancer. Cancer Sci. 2017;108(3):308–15. doi: 10.1111/cas.13158. PMID:28064445. [DOI] [PMC free article] [PubMed] [Google Scholar]
- 44.Werner S, Chen H, Tao S, Brenner H. Systematic review: serum autoantibodies in the early detection of gastric cancer. Int J Cancer. 2015;136(10):2243–52. doi: 10.1002/ijc.28807. PMID:24615018. [DOI] [PubMed] [Google Scholar]
- 45.Pepe MS, Etzioni R, Feng Z, Potter JD, Thompson ML, Thornquist M, Winget M, Yasui Y. Phases of biomarker development for early detection of cancer. J Natl Cancer Inst. 2001;93(14):1054–61. doi: 10.1093/jnci/93.14.1054. PMID:11459866.27418398 [DOI] [PubMed] [Google Scholar]
- 46.Dai L, Li J, Xing M, Sanchez TW, Casiano CA, Zhang JY. Using Serological proteome analysis to identify Serum Anti-Nucleophosmin 1 autoantibody as a potential biomarker in European-American and African-American patients with prostate cancer. Prostate. 2016;76(15):1375–86. doi: 10.1002/pros.23217. PMID:27418398. [DOI] [PubMed] [Google Scholar]
- 47.Danna EA, Sinha P, Gilbert M, Clements VK, Pulaski BA, Ostrand-Rosenberg S. Surgical removal of primary tumor reverses tumor-induced immunosuppression despite the presence of metastatic disease. Cancer Res. 2004;64(6):2205–11. doi: 10.1158/0008-5472.CAN-03-2646. PMID:15026364. [DOI] [PubMed] [Google Scholar]
Associated Data
This section collects any data citations, data availability statements, or supplementary materials included in this article.