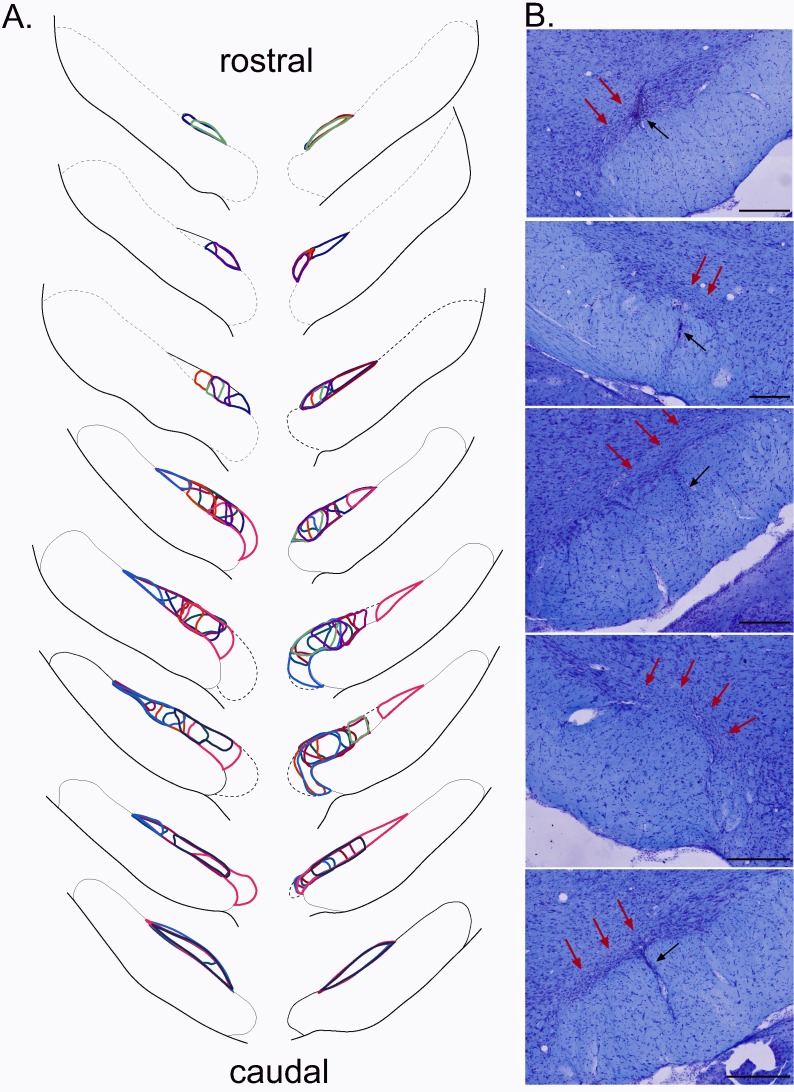
Figure 4. Plots of the STN lesion.
(A) Schematic of the ibotenic acid STN lesions, each colour represents the plot of an individual animal. (B) Coronal sections (stained with cresyl violet) of the STN following a bilateral injection of ibotenic acid. Red arrows indicate the location of the lesion and black arrows the tract of the cannula. Scale bars = 400 µm.

