

Abstract
Background
Pleural effusion remains largely unexplored in patients with pulmonary embolism and concurrent pulmonary infarction. The aim of the study was to investigate the relationship between the size of pulmonary infarction and pleural effusion as well as the time course of pleural effusion in patients with pulmonary infarction.
Patients and methods
Data from 103 patients with pulmonary infarction was retrospectively analysed along with patient comorbidities, size of pulmonary infarction, presence and size of pleural effusion with the time between the onset of clinical symptoms of pulmonary infarction and CT study.
Results
Assessment of possible correlations between the size of pulmonary infarction and age revealed a significant negative correlation. There was a highly significant difference (p = 0.005) in the mean size of pulmonary infarction in patients with effusion (34.5 cm3) compared to those without it (14.3 cm3), but the size of the effusion had no correlation with the size of pulmonary infarction. The size of the effusion peaked between 4th–5th day after the onset of clinical symptoms of pulmonary infarction. In the first 5 days after the onset of clinical symptoms of pulmonary infarction a significant correlation was found between the size of the effusion and time with approximation of 1.3 mm/12 h.
Conclusions
The data shows that patients with a pleural effusion are more likely to have a larger pulmonary infarction than those without it. If present, the effusion can be expected to increase in a relatively slow linear fashion in the first 5 days after the onset of clinical symptoms of pulmonary infarction.
Key words: pulmonary infarction, pleural effusion, pulmonary embolism, CTA of pulmonary arteries
Introduction
Pleural effusion is a known and well described occurrence in the setting of an acute pulmonary embolism and infarction.1, 2 In patients with acute pulmonary embolism, it has been proven to be a factor of poor prognosis and has been correlated with higher mortality.3, 4 Size-wise, it has been shown to peak 3 days after and resolve within 7–10 days of acute pulmonary embolism.5
However, focusing solely on patients with pulmonary infarction, the topic of pleural effusion remains largely unexplored in the literature published in the last 20 years (PubMed search term “pulmonary infarction pleural effusion” yields no relevant results). The aim of this study is therefore (1) to investigate the relationship between the volume of pulmonary infarction and pleural effusion and (2) to investigate the relationship between the amount of CT visible pleural effusion and its change in size with regards to time after the clinical onset of symptoms of pulmonary infarction.
Patients and methods
Patient selection and image analysis
The study is a part of an ongoing project at University Medical Centre Ljubljana and was approved by the National Medical Ethics Committee of Slovenia (No. 0120-509/2017/6, 18th May 2018). Data has been retrospectively evaluated from CT pulmonary angiography (CT-PA) of 103 patients in University Medical Centre in Ljubljana in the period of 15th April 2017 – 30th June 2018.
In our PACS archive we reviewed all CT-PA studies in the aforementioned period and included the patients with CT signs of pulmonary embolism and pulmonary infarction. We recorded: demographic data, comorbidities, location and size of the pulmonary infarction, presence, location and size of pleural effusion and time between the onset of clinical symptoms (pleuritic pain, haemoptysis) and the time at which CT-PA was performed.6 The size of the effusion was expressed as a fluid layer, measured in its thickest part, perpendicular to the thoracic wall7, as shown in Figure 1. Pulmonary infarction was defined as pleural based pulmonary consolidation without contrast enhancement.8,9 The volume of pulmonary infarction was measured using Aquarius iNtuition version 4.4.6 (TeraRecon, USA) by manually drawing regions of interest (ROIs) around the infarcted area (Figure 1). All the measurements were independently performed by two experienced radiologists.
Figure 1.
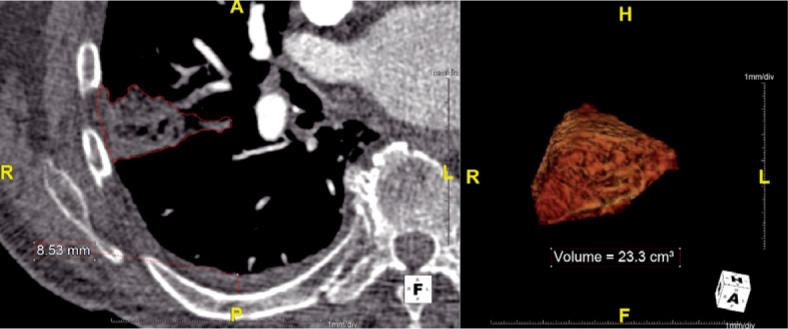
Measurements of pulmonary infarction volume and effusion layer size. Left: ROI around infarcted area and pleural effusion layer thickness measurement. Right: 3D visualization of the infarcted area.
Statistical analysis
Multiple linear regression, independent samples t-test and bivariate correlation (i.e. Pearson correlation coefficient) were used as appropriate. Statistical significance was set at the p-value of 0.05. All the statistics were performed using IBM SPSS Statistics version 22 (IBM, USA).
Results
Study population characteristics
Of the 103 patients, 8 were excluded due to: (1) previous pleural effusion and (2) CT imaging more than 10 days after the onset of symptoms in order to avoid effusions of other aetiologies, such as hemothorax and infection.5, 10 The study thus included 95 patients. Most of the patients (53.7%) had at least one comorbidity at the time of the pulmonary infarction, with reduced mobility being the most common (40%, Table 1). Patients with reduced mobility included post-operative patients, patients after cerebrovascular insult, patients with casts and other similar causes.
Table 1.
Demographic data and comorbidities. (∗) Multiple linear regression was performed to test for correlation. P-values are shown
| Gender | N | (%) | |||
| Male | 37 | (38.9 %) | |||
| Female | 58 | (61.6 %) | |||
| Age | |||||
| Mean (SD) | 61.3 | (± 19.5) | |||
| Pleural effusion | N | (%) | |||
| Present | 57 | (60 %) | |||
| Not present | 38 | (40 %) | |||
| Correlation(∗) with | |||||
| Comorbidities | N | (%) | PI size | Ef. size | Presence of ef. |
| Reduced mobility | 38 | (40 %) | 0.6 | 0.5 | 0.7 |
| Previous PE | 8 | (8.4 %) | 0.7 | 0.2 | 0.9 |
| Oral contraceptives | 7 | (7.4 %) | 0.5 | 0.4 | 0.2 |
| Known malignancy | 6 | (6.3 %) | 0.09 | 0.2 | 0.3 |
| Proven GVT | 6 | (6.3 %) | 0.9 | 0.7 | 0.1 |
| Congestive heart failure | 5 | (5.3 %) | 0.5 | 0.3 | 0.7 |
| COPD | 4 | (4.2 %) | 0.5 | 0.9 | 0.07 |
| Number of comorbidities present in a patient | N | (%) | |||
| No comorbidities | 37 | (38.9 %) | |||
| 1 | 51 | (53.7 %) | |||
| 2 | 5 | (5.3 %) | |||
| 3 | 2 | (2.1 %) | |||
Ef. = effusion; PE = pulmonary embolism; PI = pulmonary infarction
Pulmonary infarction size
The average size of the pulmonary infarction was 26.8 ± 40.9 cm3. There was a weak, but statistically significant negative correlation between age and the size of the pulmonary infarction, with older patients having smaller pulmonary infarctions (r = - 0.21; p < 0.05; Figure 2). There was no significant correlation between the presences of different comorbidities with the size of pulmonary infarction (Table 1).
Figure 2.

Size of the pulmonary infarction (in mm3) in relation to patients’ age (in years).
Pulmonary effusion presence and size
Pleural effusion was present in 57 patients (60 %) with an average thickness of 10.6 ± 8.5 mm. We found a highly statistically significant difference in size of the pulmonary infarction in patients with and without effusion, with effusions being present in patients with larger infarctions (p = 0.005; Table 2). No significant correlation was found between different comorbidities and the presence of the effusion (Table 1). In the group of patients with pleural effusion, there was no significant correlation between the size of the pulmonary infarction and the layer thickness of the effusion (r = 0.12; p = 0.4) or the presence of comorbidities and the layer thickness of the effusion (Table 1).
Table 2.
Mean pulmonary infarction size in patients with and without pleural effusion
| Pleural effusion | Mean PI size |
|---|---|
| Not present | 14.3 cm3 (± 17.8 cm3) |
| Present | 34.5 cm3 (± 50.5 cm3) |
PI = pulmonary infarction
Time course of a pleural effusion in patients with pulmonary infarction
In patients with a pleural effusion the layer thickness of the effusion peaked between the 4th and the 5th day after the onset of symptoms (Figure 3). In the first five days, we established a highly statistically significant positive correlation between the layer thickness of the effusion and time (r = 0.45; p = 0.001). Using a linear trend line fit, the resulting linear function was y = 5.7 + 0.1·x, where y is the effusion layer thickness in mm and x is time elapsed since the onset of symptoms in hours. Between the 5th and the 10th day, we found a negative correlation between the size of the effusion and time, but it was not statistically significant (r = - 0.4; p = 0.3).
Figure 3.

Thickness of the pleural effusion layer (in mm) in relation to time since the onset of symptoms (in hours).
Discussion
One of our main findings was that the size of the pulmonary infarction was significantly smaller in older patients. This seems to be complementary to previous studies, which report significantly lower prevalence of pulmonary infarction in the elderly.8, 11, 12 One of the probable mechanisms for this could be that in elderly patients with chronic cardiopulmonary disease regional hypoxia promotes collateral pulmonary angiogenesis, thus protecting the pulmonary parenchyma from infarction.11 Another possible mechanism, which could also interfere, is that the dilatation and extension of the bronchial circulation in patients with chronic lung diseases decreases flow dynamics through the established pulmonary circulation.8 Both of these hypotheses could reasonably be applied to our results as well.
The effusion layer present in patients with pulmonary infarction was generally relatively small (10.6 mm on average), which is in agreement with previous studies.1, 3, 4, 10, 13 However, while there was no correlation between pulmonary infarction size and effusion layer thickness, larger pulmonary infarctions seem more likely to be associated with an accompanying effusion than the smaller ones, which is in contrast to the previously published data.2 Our findings seem to be in agreement with proposed pathophysiological mechanisms, which suggest that the dynamics of pleural effusions are influenced by numerous, possibly alternating factors. Several mechanisms have been proposed by which pleural effusion develops in patients with pulmonary infarction. The first one is an increase of the capillary permeability in the lungs secondary to the release of inflammatory mediators.10, 14 This mechanism could explain the correlation between larger pulmonary infarctions and the presence of pleural effusion. Larger volume of infarcted tissue results in the release of greater quantities of inflammatory mediators, which efficiently promote the development of the effusion. On the other hand, this hypothesis would also suggest that the size of the effusion layer could possibly correlate with the size of the pulmonary infarction, which we found not to be the case. The additional mechanism which could alter the pleural effusion dynamics in patients with pulmonary embolism and pulmonary infarction is the increase of hydrostatic pressure in systemic veins and capillaries in the parietal pleura as a result of impaired blood flow. The increased pressure in systemic veins could impair lymphatic drainage and therefore promote pleural fluid formation.14 Therefore, one of the plausible explanations for relatively small or no pleural effusion in our study is that in the cases with relatively small pulmonary infarction pre-existent modifications in the bronchial circulation could have been present with already reduced pulmonary blood flow. Small flow dynamics could have consequently caused only relatively small increments in hydrostatic pressure with little or no pleural effusion.
In the cases of CT visible pleural effusion, the layer of effusion is more likely to increase in thickness with time in the first five days after the onset of pulmonary infarction. Using the fitted linear function, according to which the layer of pleural effusion would increase by about 1.3 mm every 12 h, one can predict the possible peak size of the effusion after the initial CT imaging. An assessment of the peak of pleural effusion seems to be useful, since a major increase in the effusion size has already been shown to be a worrisome feature, indicating complications and possibly prompting diagnostic thoracentesis in patients with pulmonary embolism.10 Our data also suggests that if the patient has a concurrent pulmonary infarction, the increase in size is not necessarily a sign of complications as long as it follows the expected trend line in the first five days. In any case, further investigation is needed, especially in light of our findings, which contradict previous studies.2
The major limitation of our study was the inability to differentiate between the area of true infarction (i.e. necrotic tissue) and the area of haemorrhage following pulmonary embolism, because both present as an area of unenhanced consolidation on a CT scan. We categorized these entities as pulmonary infarction in both cases, which probably resulted in overestimating the size of the true pulmonary infarction in our study.9 However, this has been suggested to be clinically less important as the entire volume of the consolidation (i.e. true infarction with surrounding haemorrhage) represents tissue with severely decreased, non-functional ventilation/perfusion (V/P) ratio. Due to radiation constraints we only analysed CT scans of multiple patients at different time points. In an ideal case, the dynamics of the effusion layer size would be measured in the same patient at different times and then the results could be averaged. Therefore, a reasonable continuation of this CT study would be to monitor pleural effusion dynamics in patients with CT confirmed pulmonary infarction by using complementary imaging modalities. One of the limitations of our study is also the relatively small sample size, especially with regards to the patients imaged later than 5 days after the onset of symptoms. One could expect a reduction of size of the effusion in this group; however, a considerably larger number of subjects is needed, preferably in a multicentre study.
Conclusions
With increasing patient age, the size of pulmonary infarction gets smaller. Pleural effusion is more likely to occur in patients with larger pulmonary infarction, however the size of the effusion does not necessarily correlate with the size of the pulmonary infarction. Our data suggests that if an effusion in a patient with pulmonary infarction is present, an increase in the effusion in the first five days is not necessarily a sign of complication, as long as it follows the expected trend line with an increase of about 1.3 mm in layer thickness every 12 h.
Disclosure
No potential conflict of interest were disclosed.
References
- 1.Choi SH, Cha S-I, Shin K-M, Lim J-K, Yoo S-S, Lee S-Y. et al. Clinical relevance of pleural effusion in patients with pulmonary embolism. Respiration. 2017;93:271–8. doi: 10.1159/000457132. [DOI] [PubMed] [Google Scholar]
- 2.Porcel JM, Madroñero AB, Pardina M, Vives M, Esquerda A, Light RW.. Analysis of pleural effusions in acute pulmonary embolism: radiological and pleural fluid data from 230 patients. Respirology. 2007;12:234–9. doi: 10.1111/j.1440-1843.2006.01026.x. [DOI] [PubMed] [Google Scholar]
- 3.Zhou X, Zhang Z, Zhai Z, Zhang Y, Miao R, Yang Y. et al. Pleural effusions as a predictive parameter for poor prognosis for patients with acute pulmonary thromboembolism. J Thromb Thrombolysis. 2016;42:432–40. doi: 10.1007/s11239-016-1371-2. [DOI] [PubMed] [Google Scholar]
- 4.Kiris T, Yazici S, Koc A, Köprülü C, Ilke Akyildiz Z, Karaca M. et al. Prognostic impact of pleural effusion in acute pulmonary embolism. Acta Radiol. 2017;58:816–24. doi: 10.1177/0284185116675655. [DOI] [PubMed] [Google Scholar]
- 5.Findik S.. Pleural effusion in pulmonary embolism. Curr Opin Pulm Med. 2012;18:347–54. doi: 10.1097/MCP.0b013e32835395d5. [DOI] [PubMed] [Google Scholar]
- 6.Tapson VF.. Pulmonary infarction: a disease of the (mostly) young. Respirology. 2018 Jul 16; doi: 10.1111/resp.13366. [Epub ahead of print] [DOI] [PubMed] [Google Scholar]
- 7.Hazlinger M, Ctvrtlik F, Langova K, Herman M.. Quantification of pleural effusion on CT by simple measurement. Biomed Pap. 2014;158:107–11. doi: 10.5507/bp.2012.042. [DOI] [PubMed] [Google Scholar]
- 8.Miniati M.. Pulmonary infarction: an often unrecognized clinical rntity. Semin Thromb Hemost. 2016;42:865–9. doi: 10.1055/s-0036-1592310. [DOI] [PubMed] [Google Scholar]
- 9.He H, Stein MW, Zalta B, Haramati LB.. Pulmonary infarction: spectrum of findings on multidetector helical CT. J Thorac Imaging. 2006;21:1–7. doi: 10.1097/01.rti.0000187433.06762.fb. [DOI] [PubMed] [Google Scholar]
- 10.Light R.. Pleural effusion in pulmonary embolism. Semin Respir Crit Care Med. 2010;31:716–22. doi: 10.1055/s-0030-1269832. [DOI] [PubMed] [Google Scholar]
- 11.Islam M, Filopei J, Frank M, Ramesh N, Verzosa S, Ehrlich M. et al. Pulmonary infarction secondary to pulmonary embolism: an evolving paradigm. Respirology. 2018 Ar 25; doi: 10.1111/resp.13299. [Epub ahead of print] [DOI] [PubMed] [Google Scholar]
- 12.Kirchner J, Obermann A, Stückradt S, Tüshaus C, Goltz J, Liermann D. et al. Lung infarction following pulmonary embolism: a comparative study on clinical conditions and CT findings to identify predisposing factors. Rofo. 2015;187:440–4. doi: 10.1055/s-0034-1399006. [DOI] [PubMed] [Google Scholar]
- 13.Shi HZ, Teng LL, Wang XJ, Wang Z, Xu LL, Zhai ZG. et al. Incidence of pleural effusion in patients with pulmonary embolism. Chin Med J (Engl) 2015;128:1032–6. doi: 10.4103/0366-6999.155073. [DOI] [PMC free article] [PubMed] [Google Scholar]
- 14.Agarwal R, Singh N, Gupta D.. Pleural effusions associated with pulmonary thromboembolism: a systematic review. Indian J Chest Dis. 2009;51:159–64. [Google Scholar]