

Abstract
Sirtuin 6 (SIRT6) is a sirtuin family member involved in a wide range of physiologic and disease processes, including cancer and glucose homeostasis. Based on the roles played by SIRT6 in different organs, including its ability to repress the expression of glucose transporters and glycolytic enzymes, inhibiting SIRT6 has been proposed as an approach for treating type 2 diabetes mellitus (T2DM). However, so far, the lack of small-molecule Sirt6 inhibitors has hampered the conduct of in vivo studies to assess the viability of this strategy. We took advantage of a recently identified SIRT6 inhibitor, compound 1, to study the effect of pharmacological Sirt6 inhibition in a mouse model of T2DM (i.e., in high-fat-diet–fed animals). The administration of the Sirt6 inhibitor for 10 d was well tolerated and improved oral glucose tolerance, it increased the expression of the glucose transporters GLUT1 and -4 in the muscle and enhanced the activity of the glycolytic pathway. Sirt6 inhibition also resulted in reduced insulin, triglycerides, and cholesterol levels in plasma. This study represents the first in vivo study of a SIRT6 inhibitor and provides the proof-of-concept that targeting SIRT6 may be a viable strategy for improving glycemic control in T2DM.—Sociali, G., Magnone, M., Ravera, S., Damonte, P., Vigliarolo, T., Von Holtey, M., Vellone, V. G., Millo, E., Caffa, I., Cea, M., Parenti, M. D., Del Rio, A., Murone, M., Mostoslavsky, R., Grozio, A., Nencioni, A., Bruzzone S. Pharmacological Sirt6 inhibition improves glucose tolerance in a type 2 diabetes mouse model.
Keywords: sirtuin inhibitors, glucose metabolism, glucose transporters
Type 2 diabetes mellitus (T2DM) affects more than 350 million people across the world (1). Despite the availability of drugs, such as metformin, an effective control of blood sugar levels is still hard to achieve. As a result, T2DM and its complications remain one of the primary causes of morbidity and mortality worldwide. Thus, new, effective treatments are sought to improve metabolic control and reduce the incidence of complications (2).
Sirtuin-6 (SIRT6) is a member of the sirtuin family, regulating many physiologic processes, including intermediary metabolism, aging, genomic stability, and tumorigenesis (3). SIRT6 was shown to have NAD+-dependent deacetylase/deacylase (4), as well as mono-ADP-ribosylating activity (5). Most of SIRT6’s biologic effects were ascribed to its histone deacetylase activity, by which SIRT6 epigenetically regulates gene expression (6), whereas the defatty-acylase activity of SIRT6 was proposed to primarily regulate protein secretion (7).
With respect to glucose metabolism, SIRT6 can be considered an appealing target for the development of new, effective antidiabetics in the light of animal studies indicating increased glucose transporter expression, increased tissue glucose uptake and low blood sugar levels in Sirt6-deficient mice (8). The increased glucose uptake in the absence of SIRT6 is accompanied by glycolysis enhancement and mitochondrial respiration inhibition (6). SIRT6-mediated regulation of glucose metabolism primarily reflects its epigenetic repression of the transcription factor hypoxia inducible factor-1α (HIF1-α) (9). As a result, SIRT6 deletion increases HIF1-α-mediated transcription and, thereby, the expression of glucose transporters and glycolytic enzymes. Thus, SIRT6 inhibitors could in principle represent useful antidiabetic agents, by stimulating glucose uptake and glycolysis. Notably, SIRT6 was also reported to control gluconeogenesis by modulating the activity of peroxisome proliferator-activated receptor-γ coactivator 1α, with SIRT6 ultimately suppressing hepatic glucose production (10). Based on the latter effect, SIRT6 activation was rather proposed as an antidiabetic strategy.
The evaluation of either pharmacological SIRT6 inhibition or activation as a strategy to treat T2DM has been hampered by the lack of specific SIRT6 modulators. Using an in silico compound screen, we were able to identify several small-molecule SIRT6 inhibitors that efficiently phenocopy the biologic effects of SIRT6 deletion, including an increase in GLUT1 expression and in glucose uptake in cultured mammalian cells (11).
In this study, we evaluated the effect of pharmacological Sirt6 inhibition in a high-fat–fed mouse model of T2DM.
MATERIALS AND METHODS
Materials
Compound 2,4-dioxo-N-(4-(pyridin-3-yloxy)phenyl)-1,2,3,4-tetrahydroquinazoline-6-sulfonamide (henceforth referred to as compound 1) was obtained from Mcule (Budapest, Hungary). Compounds 2–4 were purchased in milligram quantities from chemical vendors (Asinex, Winston Salem, NC, USA; and Princeton Biomolecular Research, Monmouth Junction, NJ, USA). Purity of compounds was ≥95%, as declared by the chemical vendors. The high-fat diet (HFD) was obtained from Mucedola SRL (Settimo Milanese, Milan, Italy). All reagents were obtained from Sigma-Aldrich (Milan, Italy), unless otherwise stated.
Determination of early ADME properties of the compounds
The physicochemical properties of the 4 compounds were determined in silico using Advanced Chemistry Development (ACD, Toronto ON, Canada) ADME (absorption, distribution, metabolism, and excretion) v.12.0 and ADME Boxes v.5.0 and compared to experimental pKa and log P data. Solubility was predicted in silico by using ACD/LogS and AB/LogS and compared to experimental measures in different excipients. Absorption was predicted based on a set of parameters including the number of rotatable bonds (nRotB; Molinspiration Cheminformatics, Slovensky Grob, Slovak Republic; http://www.molinspiration.com), violation of Lipinski rule of 5, experimental log P, log D, and topological polar surface area (TPSA; (JME Molecular Editor–Novartis, Basel, Switzerland; http://www.molinspiration.com/jme/doc/index.html)). Distribution was assessed by measuring human and mouse plasma protein binding, and plasma stability. Fraction unbound to plasma protein was determined with rapid equilibrium dialysis (RED) kit (Thermo Fisher Scientific, Waltham, MA USA) Metabolic stability was determined in human and mouse microsomes.
Cell culture and cytotoxicity
HepG2 human liver cancer cells were grown in DMEM supplemented with 10% fetal calf serum, penicillin (100 U/ml), and streptomycin (100 µg/ml) at 37°C in a humidified atmosphere with 5% CO2. HepG2 cells (1.5 × 10⁴/well in 96-well plates) were incubated for 72 h in the absence or presence of compound 1 (final concentrations: 25, 100, and 200 μM). Cell viability was measured as described in Sociali et al. (12).
In vivo experiments
C57BL/6J mice (6-wk-old males) were purchased from Charles River Laboratories Italia (Calco, Italy) and housed under a 12-h light/dark cycle in free-feeding conditions, in temperature- and humidity-controlled rooms. Animal rearing conditions and experiments complied with the Animal Research: Reporting of In Vivo Experiments (ARRIVE) guidelines (National Centre for the Replacement, Refinement, and Reduction of Animals in Research; London, United Kingdom), with those of the EU Directive 2010/63/EU and of the Italian Ministry of Health. The study was approved by the Istituto di Ricovero e Cura a Carattere Scientifico (IRCCS) Azienda Ospedaliera Universitaria (AOU) San Martino—Istituto Nazionale per la Ricerca sul Cancro (IST) Ethics Committee (Genova, Italy). In a first experimental protocol, 8-wk-old mice (7/group) were intraperitoneally injected with compound 1 (15 mg/kg), or with vehicle alone, starved overnight, and injected, the following morning, with a second dose of the inhibitor (again, 15 mg/kg). After 2 h, an oral glucose tolerance test (OGTT; 1 g/kg) was performed. In the second experimental setting, mice (10 wk old) were divided initially into 2 groups (14 animals/group): one group was fed a normal diet (ND), and the other group was fed an HFD (60% energy from fat) for 11 wk. The ND composition was wheat, maize, extracted toasted soybean meal, corn gluten feed, wheat straw, fish meal, lucerne meal, mineral dicalcium phosphate, calcium carbonate, sodium chloride, whey powder, soybean oil, yeasts. The additives (kg) were as follows: Nutritional additives (14,400 IU vitamin A, 1260 IU vitamin D3, 180 mg Fe, 54 mg Mn, 67.5 mg Zn, 11.7 mg Cu, 0.90 mg I, and 0.63 mg Co); technological additives (880 mg Sepiolite); and analytical constituents (12% moisture, 18.5% crude protein, 3% crude oils and fats, 6% crude fibers, and 7% crude ash). The HFD composition was: casein powder, lard (220 g/kg, containing 95–110 mg cholesterol/kg lard), maltodextrin, sucrose, palm oil, soybean oil, calcium carbonate, sodium chloride, mineral dicalcium phosphate, and magnesium oxide. The additives (kg−1) were as follows: nutritional additives (8400 IU vitamin A, 2100 IU vitamin D3, 55 mg Fe, 14.5 mg Mn, 46 mg Zn, 8.2 mg Cu, 0.29 mg I, 0.2 mg Se, and 0.21 mg Mo), preservatives (potassium citrate), colorants (blue indigotin), and analytical constituents (23% crude protein, 34% crude oils and fats; 5% crude fibers; and 5% crude ash). Mice were then subdivided into 4 groups (7 animals/group): ND- and HFD-fed animals were treated with either 15 mg/kg compound 1 (intraperitoneally) daily or with vehicle alone for 11 d. Compound 1 was dissolved in Kleptose HPB (23%; Roquette, Shanghai, People’s Republic of China) at a concentration of 1 mg/ml.
Glucose and insulin levels in blood
Glycemia was measured with a glucometer (Bayer, Milan, Italy) and insulinemia by ELISA (Merck Millipore, Milan, Italy).
Blood and hepatic triglycerides and cholesterol levels
Triglycerides and cholesterol test strips (Roche Diagnostics, Monza, Italy) were used to measure triglycerides and total cholesterol levels in blood. To evaluate levels of total cholesterol, LDL/VLDL and HDL in plasma, the colorimetric cholesterol assay kit was used (Abcam, Cambridge, United Kingdom). Livers were recovered from animals in the different groups and homogenized according to the instructions in the assay kits for triglycerides and total cholesterol (Abcam).
Histopathology
Liver specimens were fixed in 10% buffered formalin for 12–18 h, routinely processed, and embedded in paraffin blocks. From each block, three 3- to 4-µm-thick histologic slides were cut with a microtome and stained with hematoxylin-eosin or Masson’s trichrome. All the specimens were evaluated by a surgical pathologist expert in liver pathology who was unaware of the animal’s clinical and laboratory data. All the slices were scored according to the U.S. National Institutes of Health-sponsored Clinical Research Network in Nonalcoholic Steatohepatitis (NASH) (13–15).
Western blot analysis
Soleus muscle was recovered from animals in the different groups and homogenized in the following buffer: 50 mM Tris-HCl (pH 8), 150 mM NaCl, 1 mM EDTA, 1 mM NaF, 10 μM trichostatin A, 10 mM nicotinamide, 0.5 mM DTT, and protease inhibitor cocktail. Lysates (30 μg proteins) were loaded on a 10% polyacrylamide gel and separated by SDS-PAGE. Proteins were subsequently transferred to nitrocellulose membranes, and detection was performed with the following primary antibodies: anti-acetylated H3K9 (rabbit polyclonal, ab10812; Abcam), anti-histone [H3] (rabbit polyclonal, 9715; Cell Signaling Technology, Danvers, MA, USA), anti-GLUT1 (mouse monoclonal, SPM498; Abcam), anti-GLUT4 (mouse monoclonal, ab35826; Abcam), anti-GAPDH (mouse monoclonal, MA5-15738; Thermo Fisher Scientific), anti-SIRT6 (mouse monoclonal, SAB1407499, Sigma-Aldrich), anti-acetyl p53 (acetyl K381; rabbit polyclonal, ab61241; Abcam), anti-acetyl α-tubulin (rabbit polyclonal, 5335; Cell Signaling Technology), or anti-vinculin (a kind gift from E. Turco, Molecular Biotechnology Center, Turin, Italy). To evaluate the p-Akt levels, soleus muscle and liver tissue were homogenized in the same buffer as above, in the presence of a phosphatase inhibitor cocktail (Sigma-Aldrich). Lysates were analyzed by Western blot and the anti-p-Akt1/2/3 (Ser 473; rabbit polyclonal, sc7985; Santa Cruz Biotechnology, Dallas, TX, USA) and the anti-Akt1/2/3 (rabbit polyclonal, ab126811; Abcam) antibodies were used.
Following incubation with the appropriate secondary antibodies and ECL detection (GE Healthcare, Milan, Italy), band intensity was quantified with the ChemiDoc imaging system (Bio-Rad, Milan, Italy).
Assay of glycolytic enzymes, evaluation of ATP and AMP levels, and measurement of O2 consumption
Soleus muscle was recovered from animals in the different groups and homogenized in 0.25 M sucrose and 10 mM Tris-HCl (pH 7.4), in the presence of a protease inhibitor cocktail. PFK, PK, and lactate dehydrogenase (LDH) activities and ATP and AMP levels were determined (16).
O2 consumption was assayed in a thermostatically controlled oxygraph apparatus equipped with an amperometric electrode (Unisense–Microrespiration; Unisense A/S, Aarhus, Denmark) (17). For each experiment, 50 μg of total protein were used. The samples were incubated in the respiration buffer composed of: 120 mM KCl, 2 mM MgCl2, 1 mM KH2PO4, 50 mM Tris HC, (pH 7.4), and 25 µg/ml ampicillin. To register the respiration rates, 5 mM pyruvate and 2.5 mM malate were added. To confirm that O2 consumption was related to the activity of the oxphos proteins, 40 μM rotenone (complex 1 inhibitor) was added.
Statistical analysis
All parameters were tested by a Student’s t test. A value of P < 0.05 was considered significant. In the figures, only relevant comparisons are shown.
RESULTS
Fingerprinting of quinazolinedione SIRT6 inhibitors
We have recently identified several SIRT6 inhibitors with a quinazolinedione-like structure, which effectively increase glucose uptake by cultured cells (Fig. 1). To select the most suitable compound to test in vivo, we performed a characterization of the physicochemical properties (Table 1) and solubility (Table 2), as well as early ADME absorption (Table 3), distribution (Table 4), and metabolism (Table 5) of these compounds. Compounds 1–4 were all basic compounds. Compounds 1, 3, and 4 were ionizable at pH <4–5 (gastric pH) and their log P ∼ 1.9–2.2 did not predict good water solubility. Compound 2 was also ionizable at pH < 6 (duodenum pH) and was predicted to be slightly soluble in water because of its probable low log P (0.8: estimated value). Regarding measured solubility results, compounds 1 and 2 were found to be soluble (solubility ≥ 1 mg/ml) in cyclodextrin. Concerning the oral absorption prediction, no violation of Lipinski’s rules was observed. However, compound 4 showed 2 parameters outside the optimal range (nRotB and TPSA). Thus, it was predicted to have a poor oral absorption, whereas compounds 1–3 probably had moderate oral absorption. Concerning distribution and metabolism evaluation, metabolic stability results showed that 2 compounds (3 and 4) might be metabolized. The 2 remaining compounds (1 and 2) were both found to have a strong affinity to human plasma proteins. In conclusion, based on these early ADME results, compounds 1 and 2 were considered to be early leading candidates for our in vivo study. Ultimately, given its stronger in vitro activity in increasing cell glucose uptake compared to compound 2, as detected both in L6 skeletal muscle cells and in BxPC3 pancreatic cells (18), compound 1 was selected for our in vivo study. The cytotoxicity of compound 1 was evaluated on a liver hepatocellular cell line, HepG2; addition of up to 200 μM of compound 1 did not significantly affect cell viability for 72 h (cell viability, 99.1 ± 0.6, 98.4 ± 0.3, and 97.4 ± 1.7% in cells treated with 25, 100, or 200 μM, respectively, relative to untreated cells).
Figure 1.

Chemical structures of compounds 1, 2, 3, and 4.
TABLE 1.
Physicochemical properties
| Cmp | Prediction |
Determination |
|||
|---|---|---|---|---|---|
| Ionization constant (pKa) | Partition coefficient (log P) | Distribution coefficient (log D)a | Ionization constant (experimental pKa) | Partition coefficient [log Pexp (pH)]b | |
| 1 | 4.28 (B1), 8.16 (A1), 10.02 (A2)c | 1.28c | 2.2 | 3.93 (B1), 7.53 (A1), 9.54 (A2) | l1.92 (5.5) |
| 5.1 (B1), 8.6 (A2)a | 2.26a | ||||
| 2 | 6.75 (B1), 8.25 (A1), 10.03 (A2)c | 0.14c | 1.4 | 6.43 (B1), 7.58 (A1), 9.97 (A2) | 0.80 (7.18) |
| 6.7 (B1), 8.6 (A2)a | 1.46a | ||||
| 3 | 5.94 (B1), 8.33 (A1), 10.06 (A2)c | 1.93c | 3.2 | 5.58 (B1), 7.84 (A1), 9.95 (A2) | 2.03 (7.18) |
| 5.8 (B1), 8.6 (A2)a | 3.25a | ||||
| 4 | 5.73 (B1), 8.22 (A1)c | 2.20c | 2.9 | 5.33 (B1), 7.88 (A1) | 2.24 (7.18) |
| 5.7 (B1), 9.4 (A1)a | 2.89a | ||||
Cmp, compound. aLog D, pH 7.4. Predicted by ADME Boxes v.5.0. bLog P from log k50%; obtained by ultra-high performance liquid chromatography in gradient mode. cPredicted by ACD/ADME v.12.0.
TABLE 2.
Solubility
| Cmp | Prediction, S (mg/ml)a | Determination (mg/ml) |
|||
|---|---|---|---|---|---|
| Surfactant | Polymer | Cyclodextrin | PBSb | ||
| 1 | 2.02 10−4 | 0.73 in 9% Tween 80 | 0.65 in 1.96% Soluplus | 2.2 in 23% Kleptose HPB | 0.03 |
| 2 | 2.21 10−3 | 0.38 in 9% TPGS | 0.24 in 1.96% Kollidon | 1.1 in 23% Captisol | 0.02 |
| 3 | 1.35 10−4 | ND | ND | ND | ND |
| 4 | 3.97 10−3 | ND | ND | ND | ND |
Cmp, compound; ND, not determined; S, intrinsic aqueous solubility. aPredicted by ACD/ADME v.12.0. bPBS, pH 7.4.
TABLE 3.
Absorption prediction
| Cmp | MW | nRotB | Log Pexp | Log Da | TPSA |
|---|---|---|---|---|---|
| 1 | 410.40 | 5 | ≈2 | 2.2 | 134.01 |
| 2 | 397.41 | 5 | <1 | 1.4 | 113.92 |
| 3 | 422.46 | 6 | ≈2 | >3 | 124.78 |
| 4 | 436.48 | 8 | >2 | 2.9 | 103.05 |
Cmp, compound; MW, molecular weight. aLog D, pH 7.4 or 6.5.
TABLE 4.
Distribution evaluation
| Cmp | Partition coefficient [log Pexp (pH)] | PPB | Plasma stability mouse (1 μM, 37°C, 4 h) | |||
|---|---|---|---|---|---|---|
| Human |
Mouse |
|||||
| 1 μg/ml | 10 μg/ml | 1 μg/ml | 10 μg/ml | |||
| 1 | 1.92 (5.5) | fuRED 3.3% | fuRED 3.5% | fuRED 7.0% | fuRED 8.0% | Stable |
| 2 | 0.80a (7.2) | fuRED 10.2% | fuRED 9.5%a | fuRED 41.1% | fuRED 42.3% | Stable |
| 3 | 2.03 (7.2) | Strong affinity (fuHSA < 15%) | ND | Stable | ||
| 4 | 2.24 (7.2) | Strong affinity (fuHSA < 15%) | ND | Stable | ||
Cmp, compound; fuRED, fraction unbound to plasma protein with RED kit; fuHSA, fraction unbound to human serum albumin (HSA); ND, not determined; PPB, plasma protein binding. aEstimated value (low retention time).
TABLE 5.
Metabolism evaluation
| Cmp | Metabolic stability (μl/min/mg) |
|
|---|---|---|
| Human | Mouse | |
| 1 | Clint < 10 (low clearance) | 19 < Clint < 37 (low clearance) |
| 2 | Clint < 10 (low clearance) | 5 < Clint < 23 (low clearance) |
| 3 | 90 < Clint < 110 (high clearance) | 268 < Clint < 286 (high clearance) |
| 4 | 26 < Clint < 44 (medium clearance) | 19 < Clint < 37 (medium clearance) |
Clint, intrinsic clearance; cmp, compound.
Compound 1 improves oral glucose tolerance in WT mice
The effect of compound 1 was first evaluated in wild-type mice that were injected with a first dose of 15 mg/kg of this compound, deprived of food overnight, and then injected with a second dose of the Sirt6 inhibitor, 2 h before undergoing an OGTT. Administration of compound 1 significantly reduced the glycemia in unfed mice (Fig. 2A), and upon glucose administration, compound 1-treated mice showed a significant improvement in glucose tolerance (Fig. 2B–D). Thus, overall, these data represented a first in vivo demonstration of the effect of compound 1 on glucose homeostasis and prompted us to explore its activity on a mouse model of T2DM.
Figure 2.

Compound 1 reduces glycemia and improves oral glucose tolerance in unfed wild-type mice. C57BL/6J mice (7/group) were treated with 15 mg/kg compound 1, or with vehicle alone, left unfed overnight, and treated with a second dose of compound 1 (15 mg/kg) the following morning. A) After 2 h, glycemia was measured, and a standard oral glucose tolerance test was performed. B, C) Glycemia was monitored at the indicated time points (B), and AUC was calculated (C). D) Glycemia during the OGTT, as in B, was plotted setting the baseline glucose levels to 0. Data are expressed as means ± sd (A, C, D). Mean values are shown. *P < 0.05 (C); **P < 0.01 (A); *P < 0.05 vs. vehicle at the corresponding time point (D).
Sirt6 inhibition improves glucose levels in unfed mice and oral glucose tolerance, insulin levels, and insulin sensitivity in HFD-fed mice
C57BL/6J mice were subjected to 11 wk of an HFD, after which, as expected, they showed significantly increased body weight (Fig. 3A; white columns) and blood glucose levels (Fig. 3B; white columns), as compared to control animals fed a regular diet. Compound 1 was administered daily, and after 5 d, weight and blood glucose levels were monitored. Mouse weight decreased in response to treatment with compound 1, but not in response to the vehicle (Fig. 3A). Glycemia in unfed mice was greatly reduced by administration of compound 1 for 5 d, when compared to HFD-fed animals before the treatment and to HFD-fed animals treated with vehicle alone (Fig. 3B). Vehicle administration to HFD-fed mice did not significantly affect body weight and unfed glucose levels, and the administration of compound 1 to control mice reduced, although not significantly, glycemia in unfed animals.
Figure 3.
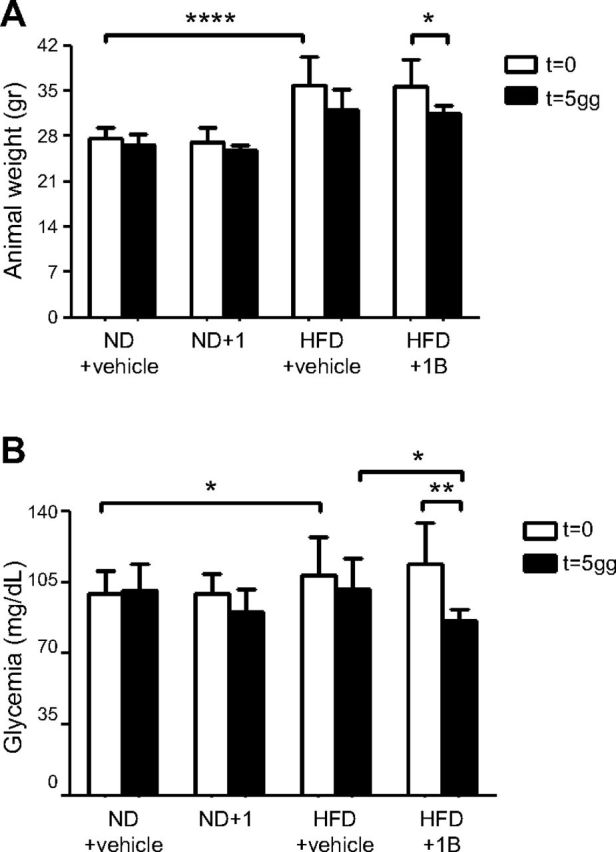
Compound 1 reduces body weight and fasting glycemia in HFD-fed mice. C57BL/6J mice (7/group) were fed an ND or an HFD for 11 wk. Next, animals were treated with compound 1 (15 mg/kg, i.p., daily), or with vehicle alone, for 5 d. After food was withheld overnight, body weight (A) and glycemia (B) were measured in unfed mice. *P < 0.05, **P < 0.01, ****P < 0.0001.
After 10 d of treatment with compound 1, HFD-fed animals were challenged with an oral glucose load. The basal glycemia was significantly reduced by the treatment (Fig. 4A), and compound 1-treated animals exhibited improved glucose tolerance (Fig. 4B–D). Insulin levels were also monitored: as expected, HFD-induced obesity and glucose intolerance were accompanied by increased insulin levels (Fig. 5A). Compound 1 treatment reduced insulin levels to values that were comparable to those of animals fed the ND. Next, the level of p-Akt was evaluated in liver and muscle tissue homogenates, as a marker of insulin sensitivity. Compound 1 treatment significantly increased p-Akt levels in both liver and muscle tissue from HFD-fed mice (Fig. 5B, C).
Figure 4.

Compound 1 improves oral glucose tolerance in HFD-fed mice. C57BL/6J mice (7/group) were fed an HFD for 11 wk. The animals were then treated with compound 1 (15 mg/kg, i.p., daily), or with vehicle alone, for 10 d. A) After overnight food deprivation, glycemia was measured, and glucose was orally administered. B, C) Glycemia was monitored at the indicated time points (B), and the area under the curve was calculated (C). D) Glycemia during the OGTT, as in B, was plotted, setting the baseline glucose levels to zero. Data are expressed means ± sd (A, C, D). Means are shown in panel B. **P < 0.01, ****P < 0.0001 (A, C); *P < 0.05 vs. vehicle at the corresponding time point (D).
Figure 5.
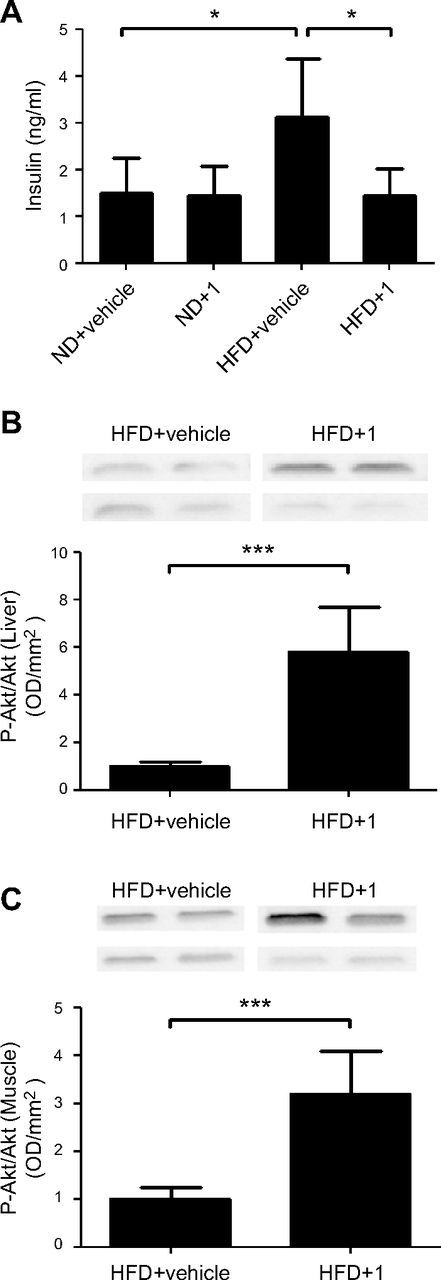
Compound 1 reduces insulin blood levels and increases levels of Akt phosphorylation in liver and muscle tissue in HFD-fed mice. C57BL/6J mice (7/group) were fed an ND or an HFD for 11 wk. The animals were then treated with compound 1 (15 mg/kg, i.p. daily), or with vehicle alone, for 11 d. A) Insulin plasma levels were measured. B, C) Liver (B) and muscle tissue (C) were recovered and homogenized: 50 μg proteins was loaded on SDS-polyacrylamide gels, subjected to Western blot analysis, and stained with anti-phospho-Akt or total Akt primary antibody. Band intensity was evaluated, and phospho-Akt levels were normalized to Akt levels. Representative Western blot analyses from 2 animals/group are shown. Graphs shows means ± sd of results from 4–5 animals. *P < 0.05, ***P < 0.001.
Sirt6 inhibition improves hepatic and plasma levels of cholesterol and triglyceride plasma levels in HFD-fed mice
Notably, in line with improved glycemia, triglyceride levels were also significantly reduced by administration of compound 1 in HFD-fed mice (Fig. 6A). Total cholesterol levels were also decreased by compound 1 treatment, as detected by 2 different assays: strips (Fig. 6B) and colorimetric kit (Fig. 6C). LDL was significantly reduced, whereas HDL was increased in HFD-fed mice, by treatment with compound 1.
Figure 6.

Compound 1 reduces triglycerides and total cholesterol and LDL/VLDL blood levels, and increases HDL, in HFD-fed mice. C57BL/6J mice (7/group) were fed an ND or an HFD for 11 wk. Next, animals were treated with compound 1 (15 mg/kg, i.p., daily), or with vehicle alone, for 11 d. A, B) Triglycerides (A) and total cholesterol (B) were measured with strips. C) Plasma total cholesterol. HDL and LDL/VLDL were measured with a colorimetric assay kit. *P < 0.05, **P < 0.01; #P < 0.01, ##P < 0.001 vs. ND+vehicle.
Lipid levels were also evaluated in livers from animals treated with compound 1 or vehicle
As expected, triglyceride and cholesterol levels were significantly increased in mice fed an HFD (Fig. 7A, B). Upon treatment with compound 1, hepatic cholesterol of HFD-fed mice was significantly reduced (Fig. 7B). Conversely, triglyceride levels showed a trend toward an increase, although the latter was not significant (Fig. 7A). Histopathology with hematoxylin-eosin confirmed the data obtained with the triglyceride assay kit (Fig. 7C).
Figure 7.

Compound 1 reduces hepatic total cholesterol, but not triglycerides, in HFD-fed mice. C57BL/6J mice (7/group) were fed an ND or an HFD for 11 wk. Next, animals were treated with compound 1 (15 mg/kg, i.p., daily) or with vehicle alone for 11 d. A, B) Triglycerides (A) and total cholesterol (B) were measured on liver homogenates with a colorimetric assay kit. C) Immediately after liver recovery, a part of the organ was fixed in formalin and processed for hematoxylin-eosin staining. *P < 0.05, **P < 0.01.
Compound 1 is not toxic
Compound 1 was well tolerated, with no evidence of clinical toxicity. Food and water intake by mice was not affected by treatment with compound 1 (Supplemental Fig. S1). In addition, no sign of hepatotoxicity was revealed. A mild (<33% of the hepatocytes, azonal distribution) macrovesicular steatosis was observed in 2 of 7 mice fed an HFD, regardless of compound 1 or vehicle treatment. No other relevant pathologic features suggestive of hepatotoxic damage, necrosis, or fibrosis, were observed after treatment (Fig. 7C). Thus, the reduction in body weight observed in mice treated with compound 1 (Fig. 3A) was possibly related to an increased energy expenditure and not to a reduced food intake or to toxicity of compound 1, which indeed did not affect body weight in animals fed an ND.
Pharmacological Sirt6 inhibition increases the expression of glucose transporters and stimulates glycolysis
To verify that upon in vivo treatment with compound 1, Sirt6 activity was actually inhibited, we analyzed the acetylation levels of Lys 9 on histone 3 (H3K9), a known substrate of Sirt6 deacetylase activity (6). In protein lysates from muscle tissue of compound 1-treated mice, H3K9 acetylation was increased, in both control (Supplemental Fig. S2A, B) and HFD-fed animals (Fig. 8A and Supplemental Fig. S2C). Sirt6 expression levels were not modified by the treatment, as verified in the same lysates (Supplemental Fig. S3A, B). Notably, the acetylation levels of protein, that are known targets of Sirt1 (p53) and Sirt2 (α-tubulin) activity, were not significantly modified in muscle tissue lysates from compound 1-treated HFD-fed mice (Supplemental Fig. S3A, C, D). This lack of change could reflect compound 1’s specificity for SIRT6 vs. other sirtuins [particularly vs. Sirt1; (11)] and/or the strong deacetylase activity of Sirt1 and -2 in comparison with the weak deacetylase activity of Sirt6, which could have prevented compound 1 from effectively blocking Sirt1/2 in our model (19). Next, the expression level of glucose transporters, whose expression is regulated by SIRT6 activity, was evaluated. Glut1 expression was significantly increased by compound 1 in mice subjected to either the ND (not shown) or the HFD (Fig. 8B). In line with a previous study (20), Glut4 expression was also significantly increased by treatment with compound 1 (Fig. 8C). In addition, treatment with compound 1 increased GAPDH expression (Fig. 8D), which is in line with increased glycolysis (see below) and with a previous report (9).
Figure 8.

Compound 1 increases acetylation levels of H3K9 and expression of Glut1, Glut4, and Gapdh. C57BL/6J mice (7/group) were fed an ND or an HFD for 11 wk. The animals were then treated with compound 1 (15 mg/kg, i.p,. daily) or with vehicle alone for 11 d. Muscle tissue was collected, and Western blot analyses were performed on the obtained lysates. Acetylation levels of Lys 9 on Histone 3 (A) and expression levels of the glucose transporters Glut1 (B), Glut4 (C), and Gapdh (D) were evaluated with the appropriate antibodies. Representative Western blot analyses from 2 animals/group are shown. Graphs shows means ± sd of results in 4–5 animals. *P < 0.05, **P < 0.01.
Finally, given Sirt6’s role in the regulation of glycolysis (9), we investigated the activity of glycolytic enzymes in muscle tissue lysates from animals treated with or without compound 1. Upon treatment with compound 1, PFK, PK, and LDH activities were significantly increased, both in control and HFD-treated mice (Fig. 9A–C), which is consistent with the effects obtained by Sirt6 genetic ablation (9). An evaluation of ATP and AMP levels in muscle tissue lysates (Fig. 9D) also revealed a reduction of the ATP/AMP ratio after compound 1 treatment (Fig. 9E). Mitochondrial respiration was evaluated on muscle homogenates: after treatment with compound 1, a decrease in the O2 consumption rate was recorded (Fig. 9F). Again, all of these measurements are in line with the phenotype of Sirt6-deficient cells, which show an up-regulation of glycolysis and a reduction in their mitochondrial respiration (9).
Figure 9.

Compound 1 increases glycolysis and decreases O2 consumption in muscle tissue from ND- and HFD-fed mice. A–C) PFK (A), PK (B), and LDH (C) activities were determined in muscle tissue lysates (50 μg protein) from the differently fed and treated animals. D, E) ATP and AMP levels were measured in the same extracts (D) and their ratio was calculated (E). F) O2 consumption was induced by the addition of pyruvate/malate and blocked by rotenone, the specific inhibitor of complex I. *P < 0.05, **P < 0.01, ***P < 0.001, ****P < 0.0001.
DISCUSSION
This is the first study to provide the proof-of-concept that pharmacological Sirt6 inhibition actually has blood sugar–lowering effects in a mouse model of T2DM. Notably, this is also the first study in which pharmacological SIRT6 inhibition has been achieved in vivo.
A rationale exists for the use of both Sirt6 inhibitors and Sirt6 activators in T2DM (21–23). However, the lack of small molecules targeting Sirt6 enzymatic activity has so far prevented the conduct of in vivo pharmacological studies. Drawing from early studies showing that Sirt6 deletion leads to an increase in tissue glucose uptake (3), we found that small molecule Sirt6 inhibitors identified in silico, can actually recreate such an effect in cultured cells, with compound 1 being the most effective in stimulating glucose uptake in muscle cells (11). These data prompted us to design an in vivo study of these molecules in a T2DM model. The results of our study were consistent with the reported biologic role of Sirt6 and with the effects of the Sirt6 inhibitors that we observed in vitro, showing a marked reduction in glucose levels in unfed mice in response to treatment with compound 1, both in mice that were on a regular diet (Fig. 2A) and in HFD-fed, diabetic mice (Fig. 4A). Quite remarkably, again consistent with previously reported effects of Sirt6 on glucose transporters, we found that compound 1 increased both Glut1 and -4 expression in mice (Fig. 8B, C), which might account for the reduction in blood sugar levels observed in response to this compound. In addition, an increase in glycolytic enzyme activity was also expected in response to compound 1 (9) and was indeed readily documented in mice treated with this compound (Fig. 9A–C). Therefore, overall, this preclinical in vivo study showed that a small-molecule Sirt6 inhibitor has blood sugar–lowering effects, possibly via increased glucose transporter and glycolytic enzyme expression. The potential value of pharmacological Sirt6 activation in terms of glycemic control (10, 21) remains to be ascertained since the conduct of such a study necessitates the development of Sirt6 activators with pharmacological properties allowing in vivo studies, which, to the best of our knowledge, are currently still lacking.
A previous study of mice lacking Sirt6 in their β-cells showed that Sirt6 promotes glucose-induced insulin release (22). In our hands, compound 1 did not significantly affect insulin levels in mice on an ND (Fig. 5A). Conversely, it significantly decreased insulin levels in HFD-fed animals, bringing them to levels that were similar to those measured in mice on an ND. Thus, the latter effect might be consistent with the role of Sirt6 proposed by Song et al. (22). Reduced insulin levels may reflect an improvement in insulin sensitivity, as indicated by the increased levels of phosphorylated Akt in muscle tissue and in liver from mice treated with compound 1 (Fig. 5B, C). Indeed, our data indicate that the antidiabetic effect of compound 1 does not rely on its ability to increase insulin secretion, but rather, conceivably, on the increased cell glucose uptake and glycolysis induced by this compound. In line with this conclusion, moderate GLUT4 overexpression improves insulin sensitivity and triglyceridemia in HFD-fed transgenic mice that are left unfed for a period (23).
Sirt6 also regulates lipid metabolism, with the absence of Sirt6 resulting in accumulation of triglycerides and cholesterol in the liver (6, 24–26). Our results, showing that compound 1 blunts cholesterol and triglyceride plasma levels in HFD-fed mice, contrast with those of Kanfi et al. (24). We interpret them as reflecting the reduced glucose and insulin levels in HFD-fed mice treated with compound 1. The effect of a Sirt6 inhibitor on hepatic lipids also seems not to be fully consistent with previous reports. Kim et al. (25) found that, in mice with a specific Sirt6 deletion within their liver and fed an ND, there is a marked accumulation of triglycerides in the liver itself, and the effect was ascribed to an increased expression of enzymes involved in triglyceride synthesis. In our hands, Sirt6 pharmacological inhibition did not significantly affect hepatic lipid content in mice fed an ND; in mice fed an HFD, compound 1 led to a trend toward an increase in hepatic triglycerides, but the it did not reach statistical significance (Fig. 7). This discrepancy could reflect the short time during which our animals were exposed to the Sirt6 inhibitor (11 d) vs. the longer periods of time during which the liver was affected by Sirt6 deletion in the conditional mouse models (i.e., in the model, an increase in the levels of total cholesterol and triglycerides was documented in 3-mo-old and in 5- to 6-mo-old animals, respectively) (25, 26). We cannot exclude that protracted treatment with compound 1 could actually lead to a more pronounced triglyceride accumulation in the liver. Therefore, the effect of a long-term pharmacologic Sirt6 inhibition on triglycerides and cholesterol hepatic synthesis and accumulation remains to be more thoroughly investigated.
In summary, we show that a short-term pharmacological Sirt6 inhibition in vivo is feasible and well tolerated and that it has blood glucose–lowering effects, in both nonobese and obese mice, in addition to lowering cholesterol and triglyceride levels. Further evaluations of Sirt6 inhibitors, assessing their long-term effects on metabolic parameters and organ function, as well as possible combination with other antidiabetic drugs are warranted.
Supplementary Material
This article includes supplemental data. Please visit http://www.fasebj.org to obtain this information.
ACKNOWLEDGMENTS
The authors thank Thierry Dupraz and Yogeshwar Bacchav (Debiopharm International SA) for technical support. G.S. is a recipient of a fellowship for young investigators granted by Collegio Ghislieri (Pavia, Italy). This work was supported by the Italian Ministry of Health Grant GR-2011–02347192 (to A.N., A.G., and A.D.R.); the University of Genova (to S.B. and A.N.); Programme FP7 PANACREAS Grant 256986 (to A.N. and S.B.) and Athero-B-Cell, Grant 602114 (to A.N.); Associazione Italiana per la Ricerca sul Cancro (AIRC) Grant 17736 (to A.N.); and the Fondazione Umberto Veronesi (to A.N.). G.S. and M.M. contributed equally to this work as first authors. A.N. and S.B. contributed equally to this work as senior authors. The authors declare no conflicts of interest.
Glossary
- ADME
absorption, distribution, metabolism, and excretion
- HFD
high-fat diet
- HIF1-α
hypoxia inducible factor-1α
- LDH
lactate dehydrogenase
- ND
normal diet
- nRotB
number of rotatable bonds
- OGTT
oral glucose tolerance test
- PFK
phosphofructokinase
- PK
pyruvate kinase
- RED
rapid equilibrium dialysis
- SIRT6
sirtuin 6
- TPSA
topological polar surface area
- T2DM
type 2 diabetes mellitus
Footnotes
This article includes supplemental data. Please visit http://www.fasebj.org to obtain this information.
AUTHOR CONTRIBUTIONS
A. Nencioni, A. Grozio, S. Bruzzone, R. Mostoslavsky, and A. Del Rio designed the research; S. Bruzzone and A. Nencioni drafted the manuscript; G. Sociali performed most of the experiments and analyzed the data; M. Magnone planned and conducted most of the in vivo treatments; and S. Ravera, M. Von Holtey, E. Millo, P. Damonte, T. Vigliarolo, V. G. Vallone, I. Caffa, M. Cea, M. Murone, and M. D. Parenti performed some of the experiments.
REFERENCES
- 1.Nolan C. J., Damm P., Prentki M. (2011) Type 2 diabetes across generations: from pathophysiology to prevention and management. Lancet , 169–181 [DOI] [PubMed] [Google Scholar]
- 2.Marín-Peñalver J. J., Martín-Timón I., Sevillano-Collantes C., Del Cañizo-Gómez F. J. (2016) Update on the treatment of type 2 diabetes mellitus. World J. Diabetes , 354–395 [DOI] [PMC free article] [PubMed] [Google Scholar]
- 3.Finkel T., Deng C. X., Mostoslavsky R. (2009) Recent progress in the biology and physiology of sirtuins. Nature , 587–591 [DOI] [PMC free article] [PubMed] [Google Scholar]
- 4.Jiang H., Khan S., Wang Y., Charron G., He B., Sebastian C., Du J., Kim R., Ge E., Mostoslavsky R., Hang H. C., Hao Q., Lin H. (2013) SIRT6 regulates TNF-α secretion through hydrolysis of long-chain fatty acyl lysine. Nature , 110–113 [DOI] [PMC free article] [PubMed] [Google Scholar]
- 5.Liszt G., Ford E., Kurtev M., Guarente L. (2005) Mouse Sir2 homolog SIRT6 is a nuclear ADP-ribosyltransferase. J. Biol. Chem. , 21313–21320 [DOI] [PubMed] [Google Scholar]
- 6.Kugel S., Mostoslavsky R. (2014) Chromatin and beyond: the multitasking roles for SIRT6. Trends Biochem. Sci. , 72–81 [DOI] [PMC free article] [PubMed] [Google Scholar]
- 7.Zhang X., Khan S., Jiang H., Antonyak M. A., Chen X., Spiegelman N. A., Shrimp J. H., Cerione R. A., Lin H. (2016) Identifying the functional contribution of the defatty-acylase activity of SIRT6. Nat. Chem. Biol. , 614–620 [DOI] [PMC free article] [PubMed] [Google Scholar]
- 8.Mostoslavsky R., Chua K. F., Lombard D. B., Pang W. W., Fischer M. R., Gellon L., Liu P., Mostoslavsky G., Franco S., Murphy M. M., Mills K. D., Patel P., Hsu J. T., Hong A. L., Ford E., Cheng H. L., Kennedy C., Nunez N., Bronson R., Frendewey D., Auerbach W., Valenzuela D., Karow M., Hottiger M. O., Hursting S., Barrett J. C., Guarente L., Mulligan R., Demple B., Yancopoulos G. D., Alt F. W. (2006) Genomic instability and aging-like phenotype in the absence of mammalian SIRT6. Cell , 315–329 [DOI] [PubMed] [Google Scholar]
- 9.Zhong L., D’Urso A., Toiber D., Sebastian C., Henry R. E., Vadysirisack D. D., Guimaraes A., Marinelli B., Wikstrom J. D., Nir T., Clish C. B., Vaitheesvaran B., Iliopoulos O., Kurland I., Dor Y., Weissleder R., Shirihai O. S., Ellisen L. W., Espinosa J. M., Mostoslavsky R. (2010) The histone deacetylase Sirt6 regulates glucose homeostasis via Hif1alpha. Cell , 280–293 [DOI] [PMC free article] [PubMed] [Google Scholar]
- 10.Dominy J. E. Jr., Lee Y., Jedrychowski M. P., Chim H., Jurczak M. J., Camporez J. P., Ruan H. B., Feldman J., Pierce K., Mostoslavsky R., Denu J. M., Clish C. B., Yang X., Shulman G. I., Gygi S. P., Puigserver P. (2012) The deacetylase Sirt6 activates the acetyltransferase GCN5 and suppresses hepatic gluconeogenesis. Mol. Cell , 900–913 [DOI] [PMC free article] [PubMed] [Google Scholar]
- 11.Parenti M. D., Grozio A., Bauer I., Galeno L., Damonte P., Millo E., Sociali G., Franceschi C., Ballestrero A., Bruzzone S., Del Rio A., Nencioni A. (2014) Discovery of novel and selective SIRT6 inhibitors. J. Med. Chem. , 4796–4804 [DOI] [PubMed] [Google Scholar]
- 12.Sociali G., Raffaghello L., Magnone M., Zamporlini F., Emionite L., Sturla L., Bianchi G., Vigliarolo T., Nahimana A., Nencioni A., Raffaelli N., Bruzzone S. (2016) Antitumor effect of combined NAMPT and CD73 inhibition in an ovarian cancer model. Oncotarget , 2968–2984 [DOI] [PMC free article] [PubMed] [Google Scholar]
- 13.Nonalcoholic Steatohepatitis Clinical Research Network (2005) Design and validation of a histological scoring system for nonalcoholic fatty liver disease. Hepatology , 1313–1321 [DOI] [PubMed] [Google Scholar]
- 14.Miele L., Forgione A., La Torre G., Vero V., Cefalo C., Racco S., Vellone V. G., Vecchio F. M., Gasbarrini G., Rapaccini G. L., Neuman M. G., Grieco A. (2009) Serum levels of hyaluronic acid and tissue metalloproteinase inhibitor-1 combined with age predict the presence of nonalcoholic steatohepatitis in a pilot cohort of subjects with nonalcoholic fatty liver disease. Transl. Res. , 194–201 [DOI] [PubMed] [Google Scholar]
- 15.Manco M., Fernandez-Real J. M., Vecchio F. M., Vellone V., Moreno J. M., Tondolo V., Bottazzo G., Nanni G., Mingrone G. (2010) The decrease of serum levels of human neutrophil alpha-defensins parallels with the surgery-induced amelioration of NASH in obesity. Obes. Surg. , 1682–1689 [DOI] [PubMed] [Google Scholar]
- 16.Bianchi G., Martella R., Ravera S., Marini C., Capitanio S., Orengo A., Emionite L., Lavarello C., Amaro A., Petretto A., Pfeffer U., Sambuceti G., Pistoia V., Raffaghello L., Longo V. D. (2015) Fasting induces anti-Warburg effect that increases respiration but reduces ATP-synthesis to promote apoptosis in colon cancer models. Oncotarget , 11806–11819 [DOI] [PMC free article] [PubMed] [Google Scholar]
- 17.Ravera S., Bartolucci M., Calzia D., Aluigi M. G., Ramoino P., Morelli A., Panfoli I. (2013) Tricarboxylic acid cycle-sustained oxidative phosphorylation in isolated myelin vesicles. Biochimie , 1991–1998 [DOI] [PubMed] [Google Scholar]
- 18.Sociali G., Galeno L., Parenti M. D., Grozio A., Bauer I., Passalacqua M., Boero S., Donadini A., Millo E., Bellotti M., Sturla L., Damonte P., Puddu A., Ferroni C., Varchi G., Franceschi C., Ballestrero A., Poggi A., Bruzzone S., Nencioni A., Del Rio A. (2015) Quinazolinedione SIRT6 inhibitors sensitize cancer cells to chemotherapeutics. Eur. J. Med. Chem. , 530–539 [DOI] [PubMed] [Google Scholar]
- 19.Feldman J. L., Baeza J., Denu J. M. (2013) Activation of the protein deacetylase SIRT6 by long-chain fatty acids and widespread deacylation by mammalian sirtuins. J. Biol. Chem. , 31350–31356 [DOI] [PMC free article] [PubMed] [Google Scholar]
- 20.Xiao C., Kim H. S., Lahusen T., Wang R. H., Xu X., Gavrilova O., Jou W., Gius D., Deng C. X. (2010) SIRT6 deficiency results in severe hypoglycemia by enhancing both basal and insulin-stimulated glucose uptake in mice. J. Biol. Chem. , 36776–36784 [DOI] [PMC free article] [PubMed] [Google Scholar]
- 21.Anderson J. G., Ramadori G., Ioris R. M., Galiè M., Berglund E. D., Coate K. C., Fujikawa T., Pucciarelli S., Moreschini B., Amici A., Andreani C., Coppari R. (2015) Enhanced insulin sensitivity in skeletal muscle and liver by physiological overexpression of SIRT6. Mol. Metab. , 846–856 [DOI] [PMC free article] [PubMed] [Google Scholar]
- 22.Song M. Y., Wang J., Ka S. O., Bae E. J., Park B. H. (2016) Insulin secretion impairment in Sirt6 knockout pancreatic β cells is mediated by suppression of the FoxO1-Pdx1-Glut2 pathway. Sci. Rep. , 30321 [DOI] [PMC free article] [PubMed] [Google Scholar]
- 23.Atkinson B. J., Griesel B. A., King C. D., Josey M. A., Olson A. L. (2013) Moderate GLUT4 overexpression improves insulin sensitivity and fasting triglyceridemia in high-fat diet-fed transgenic mice. Diabetes , 2249–2258 [DOI] [PMC free article] [PubMed] [Google Scholar]
- 24.Kanfi Y., Peshti V., Gil R., Naiman S., Nahum L., Levin E., Kronfeld-Schor N., Cohen H. Y. (2010) SIRT6 protects against pathological damage caused by diet-induced obesity. Aging Cell , 162–173 [DOI] [PubMed] [Google Scholar]
- 25.Kim H. S., Xiao C., Wang R. H., Lahusen T., Xu X., Vassilopoulos A., Vazquez-Ortiz G., Jeong W. I., Park O., Ki S. H., Gao B., Deng C. X. (2010) Hepatic-specific disruption of SIRT6 in mice results in fatty liver formation due to enhanced glycolysis and triglyceride synthesis. Cell Metab. , 224–236 [DOI] [PMC free article] [PubMed] [Google Scholar]
- 26.Tao R., Xiong X., DePinho R. A., Deng C. X., Dong X. C. (2013) Hepatic SREBP-2 and cholesterol biosynthesis are regulated by FoxO3 and Sirt6. J. Lipid Res. , 2745–2753 [DOI] [PMC free article] [PubMed] [Google Scholar]
Associated Data
This section collects any data citations, data availability statements, or supplementary materials included in this article.