

Abstract
Background
Faecal calprotectin correlates with histological and clinical activity in inflammatory bowel disease. Gastrointestinal bleeding might also increase faecal calprotectin levels, erroneously implying intestinal inflammation; however, this possibility has not been systematically assessed.
Methods
Sixteen healthy volunteers without gastrointestinal disease and normal faecal calprotectin baseline values ingested their own blood twice, either by drinking or via nasogastric tube. Quantities of 100 ml and 300 ml blood were ingested in a randomised order, with a 28-day wash-out period. Faecal calprotectin, faecal occult blood test, and the occurrence of melaena were assessed. Faecal calprotectin ≥ 50 µg/g was considered elevated.
Results
Melaena was reported by all healthy volunteers after 300 ml and by 11/15 healthy volunteers (71%) after 100 ml blood ingestion. One day after ingestion of 300 ml blood, 8/16 faecal calprotectin tests were positive compared to 1/16 at baseline (p = 0.016). Faecal calprotectin levels above > 200 µg/g were rarely observed. There was a trend for faecal calprotectin test positivity also after ingestion of 100 ml.
Conclusion
Ingestion of blood resulted in an increase in faecal calprotectin-positive tests. Gastrointestinal bleeding should be considered as a potential cause of mild faecal calprotectin elevation > 50 µg/g; however, increased faecal calprotectin above > 250–300 µg/g, the established cut-off for relevant intestinal inflammation in patients with inflammatory bowel disease, is rare.
Keywords: Calprotectin, inflammatory bowel disease, gastrointestinal bleeding, mucosal inflammation, Crohn’s disease, ulcerative colitis
Key summary
Current knowledge
Faecal calprotectin (fC) correlates with histological and clinical activity in inflammatory bowel disease (IBD); however, the specificity of this test is low. In addition to inflammation, gastrointestinal (GI) bleeding may be a cause of elevated fC; however, this possibility has not been systematically assessed.
What is new
Ingestion of blood can lead to an increase in fC.
Blood in the GI tract should be considered as a potential reason for mild fC elevation (>50 µg/g); however, calprotectin levels > 250–300 µg/g are unlikely to be caused by upper GI bleeding.
Introduction
Monitoring disease activity in inflammatory bowel disease (IBD) patients remains a challenge in clinical practice. The current approach includes symptom assessment, measurement of biomarkers for inflammation, radiology and endoscopy with histology. However, all of these strategies are associated with significant limitations. Symptoms as a means of assessing disease activity are limited by their subjective nature as well as a patient’s inability to discriminate between inflammation and functional (post-inflammatory) conditions.1–3 Systemic serum markers in the blood are not specific to IBD and are frequently normal if inflammation remains restricted to the superficial mucosa. Endoscopy is the gold standard to assess disease activity;4,5 however, it is invasive, costly, uncomfortable for the patient and cannot readily access the entire intestine.
Calprotectin has emerged as a non-invasive marker for intestinal inflammation.6 It is a calcium-binding protein abundant in neutrophils;6 its concentration in the faeces correlates with neutrophilic infiltration of the intestinal mucosa.7 Faecal calprotectin (fC) has been shown to correlate well also with endoscopic and histologic disease activity in IBD.8–12 Furthermore, it remains stable in stool samples for several days under a wide range of temperatures.13
For these reasons, fC is increasingly used in clinical practice and constitutes an important component of therapeutic decision making. However, fC as a marker for IBD activity has several limitations. Due to the role of neutrophils in many forms of inflammation and the presence of neutrophils in normal blood, clinical studies have shown elevated fC in a range of conditions including gastrointestinal (GI)-tract infections,14 colorectal neoplasia,15–17 microscopic colitis,18 use of non-steroidal anti-inflammatory drugs19 and even upper GI pathologies such as reflux esophagitis20 and oesophago-gastric neoplasia.21
GI bleeding may be an important confounder in assessing IBD activity by fC measurement. The upper GI tract is a frequent source of intestinal bleeding. Moreover, the prevalence of GI blood loss in IBD is high. An increase in fC due to GI-bleeding could erroneously indicate active inflammation in IBD patients. If this increase exceeded the established cut-off for relevant intestinal inflammation in patients with IBD, then this would diminish the validity of this investigation. To our knowledge, the impact of upper-GI bleeding on fC levels has not been systematically assessed.
This study reports the results of a randomised interventional study to assess the effects of defined amounts of blood delivered to the stomach on fC values. Established markers of GI bleeding (Faecal Occult Blood Test (FOBT)) were also obtained. The results suggest that even 100 ml of blood can lead to a measureable increase in fC levels (>50 µg/g); however, fC levels >250–300 µg/g typical for acute IBD flares are unlikely to be caused by upper GI bleeding; however, high values typical for acute IBD flares were rarely observed.
Materials and methods
Participants and methods
The study was performed at the Division of Gastroenterology at Triemli Hospital, a tertiary care centre and teaching hospital in Zurich, Switzerland. Participants were recruited by advertisement within the study centre and prospectively enrolled into the study. Epidemiological characteristics, stool frequency and consistency (Bristol Stool Scale (BSS)), medical history, current medication intake were assessed during an initial screening visit. Exclusion criteria were age below 18 years, acute medical conditions, medical history of GI disease or former/ current malignancy, GI symptoms such as constipation, diarrhoea, abdominal pain and abdominal surgeries except for appendectomy and hernia repair older than six months. Blood haemoglobin and fC were measured once during the screening visit; individuals with anaemia (defined as <13.0 g/dl for men and 12.0 g/dl for women according to the World Health Organisation (WHO)) were excluded. Acute illness (such as an upper airway infection or gastroenteritis) during intervention were additional exclusion criteria. Participants had to refrain from intake of non-steroidal anti-inflammatory drugs (NSAIDs). To limit the number of false positive FOBT results, participants were asked to refrain from consuming red meat or vitamin C > 200 mg during the study, according to the recommendation of some manufacturers of FOBTs.
The study was carried out according to the principles of the Declaration of Helsinki and the local ethical committee approved the study protocol (Kantonale Ethikkommission Zürich, KEK-ZH Nr 2014-0630, approval on 12 June 2015). All participants provided written informed consent before participating in any study related procedures.
Study procedures
Participants were randomly assigned to ingest either 100 ml or 300 ml blood first, followed by ingestion of the other amount of blood after a washout period of 28 days. Blood was collected by venous puncture and ingested by participants via drinking or nasogastric tube. Stool samples were collected on two consecutive days at baseline (day–2 and –1), daily on day 0–7 and day 14 at the study centre or at participant’s home and sent directly to the laboratory via mail. Symptoms including melaena, stool frequency and consistency (Brisol stool scale, BSS) as well as other symptoms were separately recorded by patient questionnaires for each study day. A BSS score of 1 and 2 was considered constipation, a BSS score of 5 or 6 was considered diarrhoea.
Calprotectin measurements
Calprotectin is stable up to three days at room temperature.13 In our study all faecal samples were analysed at the local diagnostic laboratory within 72 h after collection. Laboratory technicians were blinded regarding sample assignment. fC values were determined by using a commercially available assay, fCAL™ turbo (Bühlmann Laboratories Ltd, Schönenbuch, Switzerland) on an automatic Analyzer Cobas c501 (Roche Diagnostics Ltd, Rotkreuz, Switzerland). The quantification of calprotectin is based on the technique of particle-enhanced turbidimetric immunoassay (PETIA). A positive value was defined as equal as or greater than 50 µg/g as stated by the manufacturer.
Data analysis
Calculations were performed using GraphPad Prism version 6.0 or Matlab (version R2015b). Non-parametric tests (Wilcoxon matched-pairs signed rank test, Mann-Whitney U test) or Fisher’s exact test were used as appropriate. A p value of <0.05 was considered significant. Figures were generated using Matlab, Prism and Adobe Illustrator CC 2015.1.0.
Results
Seventeen healthy volunteers (HVs; mean age 25 years, range 23–33 years) were enrolled into the study. One participant developed flu-like symptoms with fever, myalgia and pharyngitis at baseline and was excluded (see below). Two additional participants developed acute gastroenteritis with vomiting on day 7 lasting three days, and another had symptoms of bacterial pharyngitis with sore throat and fever on day 14. FOBT and fC measurements on these study days were censored. One participant dropped out of this study after ingestion of 300 ml blood, leaving 16 individuals for analysis following 300 ml blood ingestion and 15 individuals for analysis following 100 ml blood ingestion, respectively. Characteristics of the 16 participants are provided in Table 1. A total of 336 stool samples were analysed.
Table 1.
Characteristics of participants. The mean ± standard deviation is provided.
| Description | Numbers (n = 16) Mean ± standard deviation, range | |
|---|---|---|
| Gender | Male: 4 (25%) | |
| Female: 12 (75%) | ||
| Age | 25 ± 2.8 years, range 23–33 years | |
| Baseline stool frequency | 1.2/day ± 0.4, range 0.7–2 per day | |
| Baseline stool consistency (Bristol Stool Scale) | 4 ± 0.7, range 2–5 | |
| Baseline calprotectin | 24 ± 10 mg/kg |
All participants tolerated blood ingestion well, with only minor side effects such as nausea, bloating or heartburn in 8/16 participants (50%), lasting < 24 h. Constipation occurred in 6/15 (40%) and 5/16 (31%) of HVs after ingestion of 100 and 300 ml blood, respectively. Diarrhoea was noted by 4/15 (27%) and 4/16 (25%) of HVs after ingestion of 100 and 300 ml blood, respectively.
Melaena
Melaena was reported by all 16 HVs (100%) after 300 ml and by 11 out of 15 HV after 100 ml blood ingestion (71%, Figures 1 and 2). Melaena occurred mainly on the intervention day and during the following four days with a peak at days 1 and 2 (p < 0.001 for days 1–3, p < 0.01 for days 0 and 4).
Figure 1.

Effects of 300 ml blood on symptoms (melaena), faecal occult blood test (FOBT) and faecal calprotectin (fC) measurements. Top row: individual results for melaena (left column), FOBT (middle column) and calprotectin (right column) after ingestion of 300 ml blood on each study day. A black box indicates a positive, a white box indicates a negative test result; a cross (X) indicates that there was no stool sample on that day. Bottom row: cumulative test results for each study day for melaena (left column), FOBT (middle column) and calprotectin (right column) after ingestion of 300 ml blood.
*p < 0.05, **p < 0.01, ***p < 0.001, Fisher’s exact test.
Figure 2.

Effects of 100 ml blood on symptoms (melaena), faecal occult blood test (FOBT) and faecal calprotectin (fC) measurements. Top row: individual results for melaena (left column), FOBT (middle column) and calprotectin (right column) after ingestion of 100 ml blood on each study day. A black box indicates a positive, a white box indicates a negative test result; a cross (X) indicates that there was no stool sample on that day. Bottom row: cumulative test results for each study day for melaena (left column), FOBT (middle column) and calprotectin (right column) after ingestion of 100 ml blood.
*p < 0.05, **p < 0.01, ***p < 0.001, Fisher’s exact test.
FC measurements
After ingestion of 300 ml blood fC levels rose at day 1 (Figure 3) compared to baseline (median 51 µg/g vs < 20 µg/g on day 1 and 2 before blood ingestion, p = 0.012). Note that, for unexplained reasons, the fC level of one participant were very high at day –2 (429 µg/g). Due to this outlier, the difference of day –2 and 1 was not significant (p = 0.13).
Figure 3.

Calprotectin measurements before and after blood ingestion. Data are provided as median and interquartile range for the respective day. The asterix in brackets (*) indicates statistical significance upon comparison with day –1 (p = 0.012).
From day 1–3 after 300 ml blood ingestion, 13 out of 46 (26%) stool samples had a fC value of > 50 µg/g compared to two out of 32 (3%) at baseline (p = 0.019). The highest fraction of positive fC was observed at day 1 (seven out of 16 samples, 44%, compared to one out of 16 at baseline, p = 0.016). However positive values were noted up to day 7 and at least one fC value above 50 µg/g was observed in 10/16 (63%) of HVs (Figures 1 and 2).
A trend for increased fC levels after ingestion of 100 ml was present: six out of 44 samples (14%) were positive from day 1–3 vs one out of 27 (3%) at baseline (not significant). Overall, fC levels above 50 µg/g were observed in 7/15 (46%) of HVs after ingestion of 100 ml at some point. Pronounced increases in fC levels above 200 µg/g were rarely observed following blood ingestion (none after 300 ml, one individual (6%) after 100 ml ingestion).
Faecal occult blood testing
The FOBT was positive in 14 of 16 HVs (88%) following 300 ml blood ingestion within days 1–3 compared to one individual at baseline. Following 100 ml blood ingestion, six of 15 HVs (40%) had a positive test within days 1–3 compared to no individual at baseline (Figures 1 and 2).
FOBT and fC levels showed a positive association. In the test with ingestion of 300 ml blood, fC levels were significantly higher in the 43 FOBT-positive samples than in 118 FOBT-negative samples (p < 0.0001, Figure 4(a)). Similarly, fC levels were higher in 11 FOBT-positive samples after 100 ml blood ingestion compared to 138 FOBT negative samples (p = 0.018, Figure 4(b)). fC levels were also significantly higher in faecal samples of individuals with 300 ml blood ingestion in patients that reported melaena (p = 0.0005, data not shown), but no such relationship was present after 100 ml of blood ingestion (data not shown).
Figure 4.
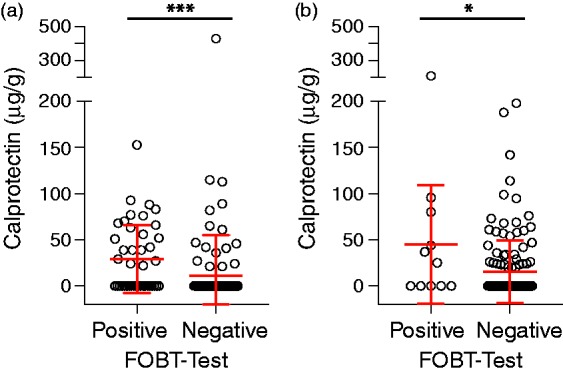
Association of faecal calprotectin values with faecal occult blood test (FOBT) test results. (a) Stool samples with positive and negative FOBT-tests before and after ingestion of 300 ml blood (p < 0.0001); (b) as in (a), after ingestion of 100 ml blood (p = 0.0183).
*p < 0.05, ***p < 0.001, Mann Whitney-U test.
Two individuals developed viral gastroenteritis and bacterial ear and nose infection, respectively. Both individuals were excluded from the study after the onset of infection. Interestingly, we observed a pronounced, non-specific increase in fC levels (>400 µg/g), accompanying inflammation (Figure 5(a) and (b)).
Figure 5.

Increase in faecal calprotectin measurements after onset of acute infections. (a) Female volunteer (24 years) with development of flu-like symptoms with fever, myalgia and pharyngitis after enrolment but before blood intake; (b) male volunteer (24 years) with symptoms of acute gastroenteritis with vomiting on day 7 lasting three days.
Discussion
In this prospective interventional study in HVs we analysed the effect of intraluminal blood in the upper GI tract on fC levels. We report four key observations: First, ingestion of 300 ml blood results in a significant increase in the likelihood of obtaining a fC-positive test. Second, elevations of fC values above 200 µg/g suggestive of significant GI inflammation were rare following blood ingestion. Third, there was a positive association between fC and FOBT, such that the likelihood of a FOBT positive stool sample was significantly higher in samples with elevated fC concentration. Finally, relevant fC elevation (>200 ug/g) was observed in two individuals with acute gastroenteritis and pharyngitis.
Management of IBD patients increasingly relies on fC measurements as low-cost, non-invasive tests with high sensitivity for detecting mucosal inflammation.22–26 However, fC cannot distinguish IBD activity from other inflammatory conditions including infection, ischaemia, neoplasia or toxicity. Our study now suggests an additional limitation of fC: upper GI bleeding of 300 ml blood or more also increases the chances of a positive fC tests. Chances of a positive test were highest at day 1 and decreased over time.
The increase in fC values upon blood ingestion was dose-dependent. The likelihood of a positive fC test was significantly higher after the 300 ml than the 100 ml blood meal. Indeed, there was no significant increase over baseline after ingestion of 100 ml blood. Thus, fC has lower sensitivity for detection of intraluminal blood than the FOBT. However, when samples with positive FOBT were compared to samples with negative FOBT, significant differences in fC levels were observed upon 100 ml as well as 300 ml blood ingestion. This confirms the hypothesis that the presence of blood in the stool is the cause of increased fC and suggests that the threshold at which upper GI blood loss can confound fC levels is between 100–300 ml bleeding.
Remarkably, patient observations (melaena) were more sensitive for the detection of intraluminal blood by FOBT and fC indicating that 100 ml or 300 ml can leave the GI tract quickly. Only a single stool sample Blood per day was analysed in this study and the relevant sample was possibly missed in a fraction of participants.
While intestinal blood can confound fC measurements, fC does not appear to be a sensitive test for GI bleeding. Assuming each neutrophilic cell carries approximately 5 pg of fC,27,28 300 ml of blood with a neutrophil count of 5 gigaparticles/l concentrated in 200 g stool would yield an fC concentration of 37.5 µg/g and might thus push measurements above the threshold of 50 µg/g in some patients. Therefore, migration of neutrophils into the intestinal lumen in inflammation remains the main factor responsible for pronounced increases in fC levels in IBD, with minimal contribution of occult or frank intestinal bleeding. The effect is dose-dependent and, therefore, severe bleeding from a duodenal ulcer (or an inflamed colon in ulcerative colitis (UC)) would be expected to yield higher fC concentrations than observed in our study.
The level of fC in the stool is prognostically relevant. Levels < 100 µg/g are typically found in clinical remissions while an increase > 150–200 µg/g is a poor prognostic sign with an increased risk of a flare in the following months, especially if present repetitively.29–32 It is noted that, while intestinal bleeding could cause false-positive fC measurements in patients, high levels > 200 µg/g were only very rarely observed (i.e. in one sample of one HV) after ingestion of 300 ml blood. Notwithstanding the above, a false-positive FC test due to upper GI bleeding could impact on therapeutic decisions, even if standardised assessment tools are used (e.g. Utrecht index).33 Even a minor, incremental FC elevation unrelated to GI inflammation could ‘tip the scales’ and prompt initiation of a new medication. This underscores the recommendation that in IBD a therapeutic decision should never be based on a single parameter.
Two of our participants developed a viral infection during the course of our study. Interestingly, in both participants, fC levels increased to >400 µg/g (Figure 5). Even though these data need to be reproduced, it appears that infections of the oropharynx as well as the GI tract could confound fC measurement. Additional studies are required to assess the impact of infections fC measurements.
There are limited data regarding effects of nutrition on calprotectin levels. One small randomised study comparing a diet of fish with a diet of red meat did not find significant differences.34 Other studies found an inverse correlation of fibre intake and calprotectin levels.35 A recent review concluded that there are insufficient data regarding effects of nutrition on fC levels.25 Similarly, data regarding effects of nutrition on FOBT are limited with most studies not showing any influence of diet on FOBT.36,37 Nonetheless, some manufacturers of FOBT recommend refraining from vitamin C > 200 mg per day and red meat before testing, which was also done in our study.
Several methods exist for the quantification of fC. The gold-standard is mass spectrometry (MS) (e.g. liquid chromatography-mass spectrometry (LC-MS)); however, this is applied only in the research setting.38 In clinical practice, the fC enzyme-linked immunosorbent assay (ELISA) remains the most often applied method for the quantification of fC. The PETIA which was used in our study, was shown to be equal compared to ELISA in several studies.39–41
Our study has several limitations: Our study population was limited to 16 healthy and young participants. All individuals were free of significant GI symptoms at inclusion and in the past but endoscopy was not performed to confirm the absence of GI pathology. Furthermore, although laboratory technicians were blinded to the study day, participants were not blinded when reporting symptoms. Moreover, our study simulated a ‘single bleeding event’, whereas GI bleeding usually occurs continuously or discontinuously for a longer period of time.
In summary, our study demonstrates that ingestion of 300 ml blood leads to significant increase of fC within the first three days; however, high fC values above 200 µg/g typically observed in severe intestinal inflammation are rarely observed.
Acknowledgements
The authors are grateful to Mark Fox for critical review and proof reading of the draft manuscript. Author contributions were as follows: SV, HH, EB, MSa: study design; SV, HH, SB, FB, MSa: data acquisition; SV, HH, BM, MSa, FB: data analysis; SV, HH, MSa, FB, BM: drafting of manuscript; all authors: critical review and final approval of the manuscript. The guarantor was SV. Data analysis: MSa, SV, HH, FB, BM, GR, JZ, MSc, LB, JB, XS.
Declaration of conflicting interests
None declared.
Ethics approval
The study was approved by the local ethics committee (Kantonale Ethikkommission Zürich, KEK-ZH Nr 2014-0630, approval on 12 June 2015).
Funding
The study was funded by the Triemli Hospital. The calprotectin kits were provided by Bühlmann Laboratories AG. BM was supported by a grant of the Swiss National Science Foundation (grant number 32473B_156525).
Informed consent
All participants gave written informed consent before participating in any study related procedures.
References
- 1.Quigley EM. Overlapping irritable bowel syndrome and inflammatory bowel disease: Less to this than meets the eye? Therap Adv Gastroenterol 2016; 9: 199–212. [DOI] [PMC free article] [PubMed] [Google Scholar]
- 2.Schoepfer AM, Trummler M, Seeholzer P, et al. Discriminating IBD from IBS: Comparison of the test performance of fecal markers, blood leukocytes, CRP, and IBD antibodies. Inflamm Bowel Dis 2008; 14: 32–39. [DOI] [PubMed] [Google Scholar]
- 3.Hoekman DR, Zeevenhooven J, D'Haens GR, et al. The prevalence of irritable bowel syndrome-type symptoms in inflammatory bowel disease patients in remission. Eur J Gastroenterol Hepatol 2017; 29: 1086–1090. [DOI] [PubMed] [Google Scholar]
- 4.Saverymuttu SH. Clinical remission in Crohn's disease–assessment using faecal 111In granulocyte excretion. Digestion 1986; 33: 74–79. [DOI] [PubMed] [Google Scholar]
- 5.Dignass A, Lindsay JO, Sturm A, et al. Second European evidence-based consensus on the diagnosis and management of ulcerative colitis part 2: Current management. J Crohns Colitis 2012; 6: 991–1030. [DOI] [PubMed] [Google Scholar]
- 6.Roseth AG, Fagerhol MK, Aadland E, et al. Assessment of the neutrophil dominating protein calprotectin in feces. A methodologic study. Scand J Gastroenterol 1992; 27: 793–798. [DOI] [PubMed] [Google Scholar]
- 7.Roseth AG, Schmidt PN, Fagerhol MK. Correlation between faecal excretion of indium-111-labelled granulocytes and calprotectin, a granulocyte marker protein, in patients with inflammatory bowel disease. Scand J Gastroenterol 1999; 34: 50–54. [DOI] [PubMed] [Google Scholar]
- 8.Schoepfer AM, Beglinger C, Straumann A, et al. Ulcerative colitis: Correlation of the Rachmilewitz endoscopic activity index with fecal calprotectin, clinical activity, C-reactive protein, and blood leukocytes. Inflamm Bowel Dis 2009; 15: 1851–1858. [DOI] [PubMed] [Google Scholar]
- 9.Ricanek P, Brackmann S, Perminow G, et al. Evaluation of disease activity in IBD at the time of diagnosis by the use of clinical, biochemical, and fecal markers. Scand J Gastroenterol 2011; 46: 1081–1091. [DOI] [PubMed] [Google Scholar]
- 10.D'Haens G, Ferrante M, Vermeire S, et al. Fecal calprotectin is a surrogate marker for endoscopic lesions in inflammatory bowel disease. Inflamm Bowel Dis 2012; 18: 2218–2224. [DOI] [PubMed] [Google Scholar]
- 11.Schoepfer AM, Beglinger C, Straumann A, et al. Fecal calprotectin correlates more closely with the Simple Endoscopic Score for Crohn's disease (SES-CD) than CRP, blood leukocytes, and the CDAI. Am J Gastroenterol 2010; 105: 162–169. [DOI] [PubMed] [Google Scholar]
- 12.Smith LA, Gaya DR. Utility of faecal calprotectin analysis in adult inflammatory bowel disease. World J Gastroenterol 2012; 18: 6782–6789. [DOI] [PMC free article] [PubMed] [Google Scholar]
- 13.Lasson A, Stotzer PO, Ohman L, et al. The intra-individual variability of faecal calprotectin: A prospective study in patients with active ulcerative colitis. J Crohns Colitis 2015; 9: 26–32. [DOI] [PubMed] [Google Scholar]
- 14.Shastri YM, Bergis D, Povse N, et al. Prospective multicenter study evaluating fecal calprotectin in adult acute bacterial diarrhea. Am J Med 2008; 121: 1099–1106. [DOI] [PubMed] [Google Scholar]
- 15.Tibble J, Sigthorsson G, Foster R, et al. Faecal calprotectin and faecal occult blood tests in the diagnosis of colorectal carcinoma and adenoma. Gut 2001; 49: 402–408. [DOI] [PMC free article] [PubMed] [Google Scholar]
- 16.Lehmann FS, Trapani F, Fueglistaler I, et al. Clinical and histopathological correlations of fecal calprotectin release in colorectal carcinoma. World J Gastroenterol 2014; 20: 4994–4999. [DOI] [PMC free article] [PubMed] [Google Scholar]
- 17.Roseth AG, Kristinsson J, Fagerhol MK, et al. Faecal calprotectin: A novel test for the diagnosis of colorectal cancer? Scand J Gastroenterol 1993; 28: 1073–1076. [DOI] [PubMed] [Google Scholar]
- 18.Wildt S, Nordgaard-Lassen I, Bendtsen F, et al. Metabolic and inflammatory faecal markers in collagenous colitis. Eur J Gastroenterol Hepatol 2007; 19: 567–574. [DOI] [PubMed] [Google Scholar]
- 19.Maiden L, Thjodleifsson B, Theodors A, et al. A quantitative analysis of NSAID-induced small bowel pathology by capsule enteroscopy. Gastroenterology 2005; 128: 1172–1178. [DOI] [PubMed] [Google Scholar]
- 20.Manz M, Burri E, Rothen C, et al. Value of fecal calprotectin in the evaluation of patients with abdominal discomfort: An observational study. BMC Gastroenterol 2012; 12: 5–5. [DOI] [PMC free article] [PubMed] [Google Scholar]
- 21.Vincent Z, Hornby S, Ball S, et al. Faecal calprotectin as a marker for oesophago-gastric cancer. Ann Clin Biochem 2015; 52: 660–664. [DOI] [PubMed] [Google Scholar]
- 22.Burri E, Beglinger C. The use of fecal calprotectin as a biomarker in gastrointestinal disease. Expert Rev Gastroenterol Hepatol 2014; 8: 197–210. [DOI] [PubMed] [Google Scholar]
- 23.Sipponen T, Kolho KL. Fecal calprotectin in diagnosis and clinical assessment of inflammatory bowel disease. Scand J Gastroenterol 2015; 50: 74–80. [DOI] [PubMed] [Google Scholar]
- 24.Lopez RN, Leach ST, Lemberg DA, et al. Fecal biomarkers in inflammatory bowel disease. J Gastroenterol Hepatol 2017; 32: 577–582. [DOI] [PubMed] [Google Scholar]
- 25.Mendall MA, Chan D, Patel R, et al. Faecal calprotectin: Factors affecting levels and its potential role as a surrogate marker for risk of development of Crohn's disease. BMC Gastroenterol 2016; 16: 126–126. [DOI] [PMC free article] [PubMed] [Google Scholar]
- 26.Siddiqui I, Majid H, Abid S. Update on clinical and research application of fecal biomarkers for gastrointestinal diseases. World J Gastrointest Pharmacol Ther 2017; 8: 39–46. [DOI] [PMC free article] [PubMed] [Google Scholar]
- 27.Steinbakk M, Naess-Andresen CF, Lingaas E, et al. Antimicrobial actions of calcium binding leucocyte L1 protein, calprotectin. Lancet 1990; 336: 763–765. [DOI] [PubMed] [Google Scholar]
- 28.Fagerhol MK, Dale I, Anderson T. Release and quantitation of a leucocyte derived protein (L1). Scand J Haematol 1980; 24: 393–398. [Google Scholar]
- 29.Costa F, Mumolo MG, Ceccarelli L, et al. Calprotectin is a stronger predictive marker of relapse in ulcerative colitis than in Crohn's disease. Gut 2005; 54: 364–368. [DOI] [PMC free article] [PubMed] [Google Scholar]
- 30.De Vos M, Louis EJ, Jahnsen J, et al. Consecutive fecal calprotectin measurements to predict relapse in patients with ulcerative colitis receiving infliximab maintenance therapy. Inflamm Bowel Dis 2013; 19: 2111–2117. [DOI] [PubMed] [Google Scholar]
- 31.Garcia-Sanchez V, Iglesias-Flores E, Gonzalez R, et al. Does fecal calprotectin predict relapse in patients with Crohn's disease and ulcerative colitis? J Crohns Colitis 2010; 4: 144–152. [DOI] [PubMed] [Google Scholar]
- 32.Gisbert JP, Bermejo F, Perez-Calle JL, et al. Fecal calprotectin and lactoferrin for the prediction of inflammatory bowel disease relapse. Inflamm Bowel Dis 2009; 15: 1190–1198. [DOI] [PubMed] [Google Scholar]
- 33.Minderhoud IM, Steyerberg EW, van Bodegraven AA, et al. Predicting endoscopic disease activity in Crohn's disease: A new and validated noninvasive disease activity index (the Utrecht Activity Index). Inflamm Bowel Dis 2015; 21: 2453–2459. [DOI] [PubMed] [Google Scholar]
- 34.Joosen AM, Lecommandeur E, Kuhnle GG, et al. Effect of dietary meat and fish on endogenous nitrosation, inflammation and genotoxicity of faecal water. Mutagenesis 2010; 25: 243–247. [DOI] [PubMed] [Google Scholar]
- 35.Poullis A, Foster R, Shetty A, et al. Bowel inflammation as measured by fecal calprotectin: A link between lifestyle factors and colorectal cancer risk. Cancer Epidemiol Biomarkers Prev 2004; 13: 279–284. [DOI] [PubMed] [Google Scholar]
- 36.Health Quality Ontario. Fecal occult blood test for colorectal cancer screening: An evidence-based analysis. Ont Health Technol Assess Ser 2009; 9: 1–40. [PMC free article] [PubMed]
- 37.Pignone M, Campbell MK, Carr C, et al. Meta-analysis of dietary restriction during fecal occult blood testing. Eff Clin Pract 2001; 4: 150–156. [PubMed] [Google Scholar]
- 38.Moore JL, Becker KW, Nicklay JJ, et al. Imaging mass spectrometry for assessing temporal proteomics: Analysis of calprotectin in Acinetobacter baumannii pulmonary infection. Proteomics 2014; 14: 820–828. [DOI] [PMC free article] [PubMed] [Google Scholar]
- 39.Noebauer B, Ramic L, Konstantin A, et al. Analytical evaluation of a fully automated immunoassay for faecal calprotectin in a paediatric setting. Biochem Med (Zagreb) 2017; 27: 030710–030710. [DOI] [PMC free article] [PubMed] [Google Scholar]
- 40.Nilsen T, Sunde K, Hansson LO, et al. A novel turbidimetric immunoassay for fecal calprotectin optimized for routine chemistry analyzers. J Clin Lab Anal 2017; 31: 1–6. [DOI] [PMC free article] [PubMed] [Google Scholar]
- 41.Mandic-Havelka A, Nilsen T, Sunde K, et al. Turbidimetric determination of fecal calprotectin using two table top chemistry analyzers: Mindray BS-200E and Cobas(R) c111. Clin Lab 2017; 63: 907–913. [DOI] [PubMed] [Google Scholar]